. 2018 Sep;561(7722):201-205.
doi: 10.1038/s41586-018-0481-8. Epub 2018 Sep 3.

Precancerous neoplastic cells can move through the pancreatic ductal system

Affiliations

Precancerous neoplastic cells can move through the pancreatic ductal system

Alvin P Makohon-Moore et al. Nature. 2018 Sep.

Abstract

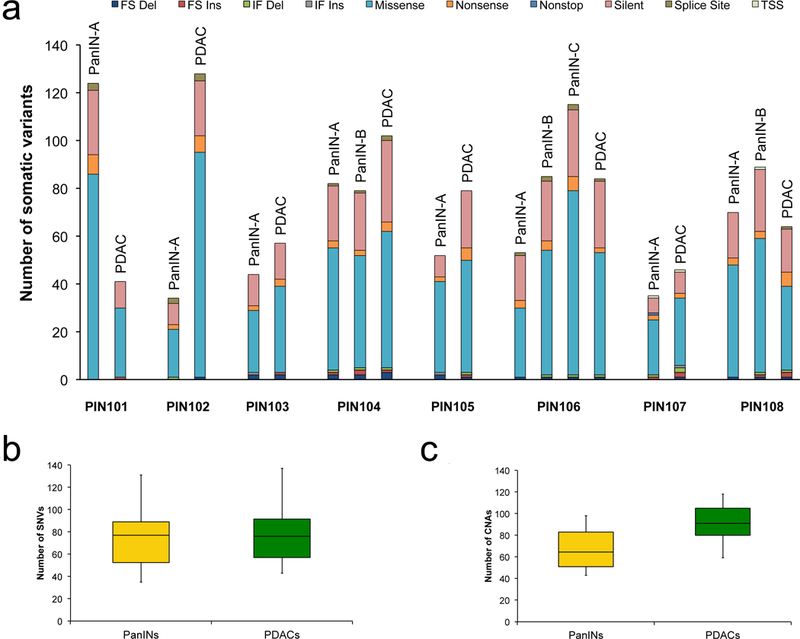
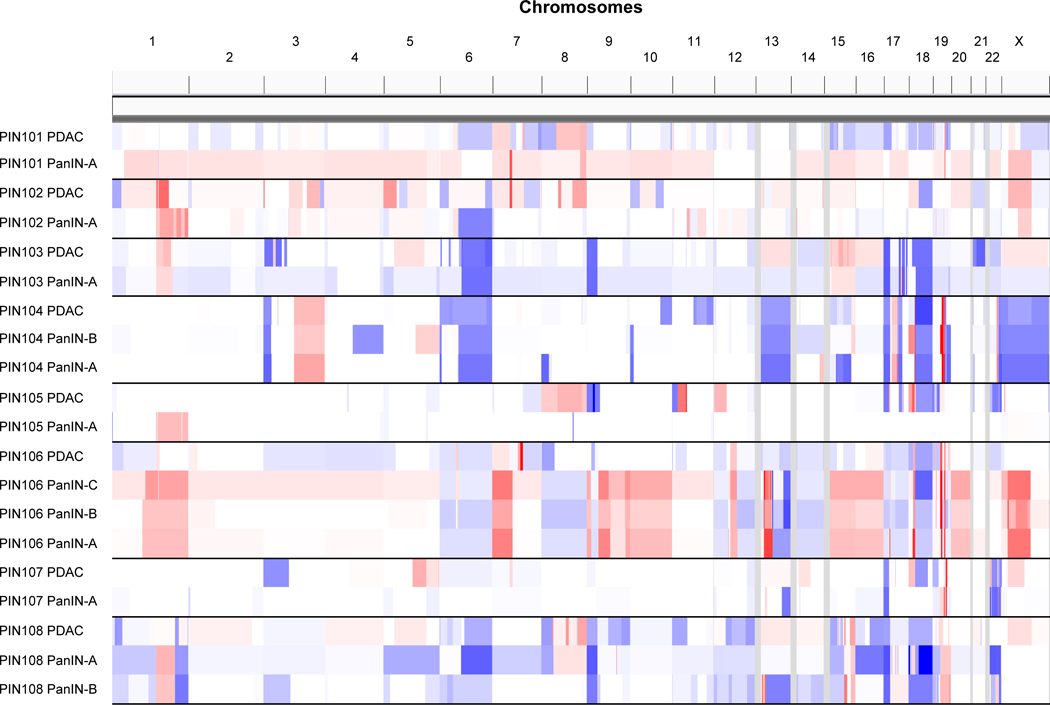
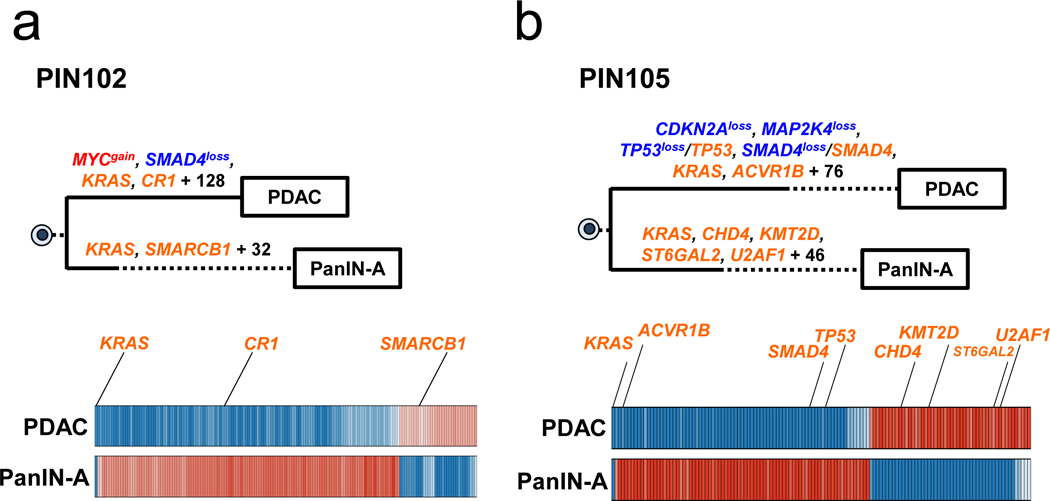
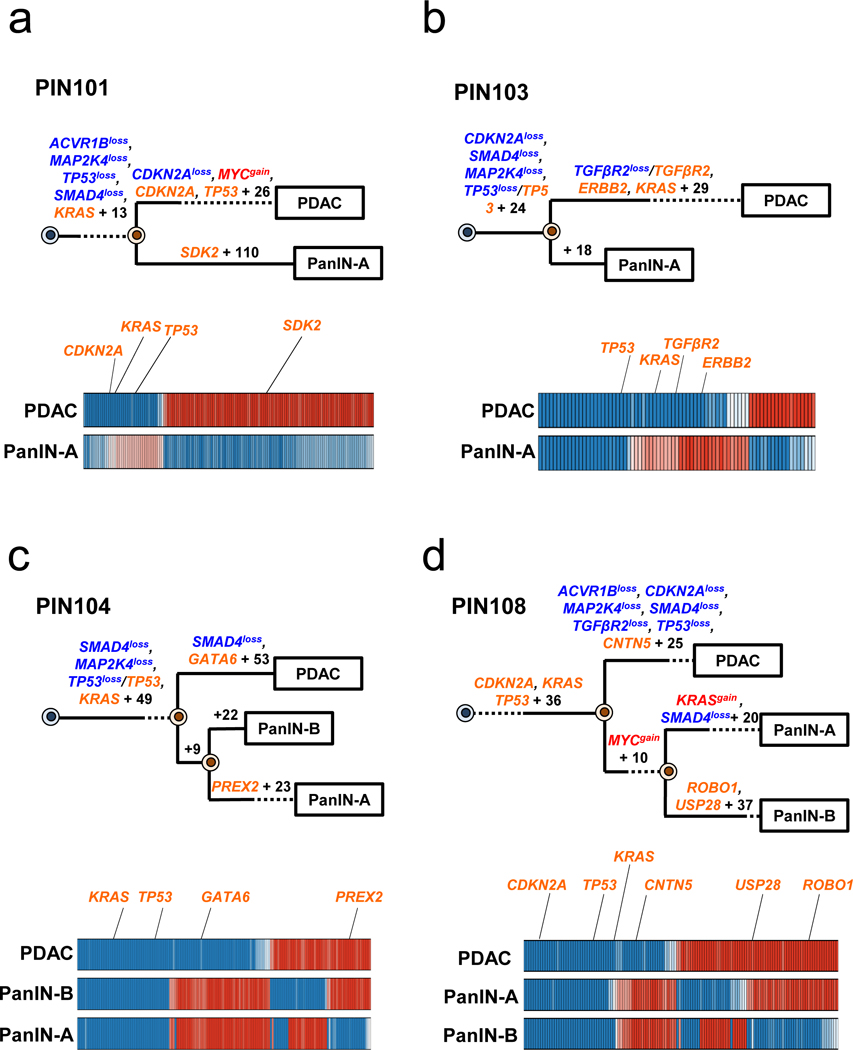
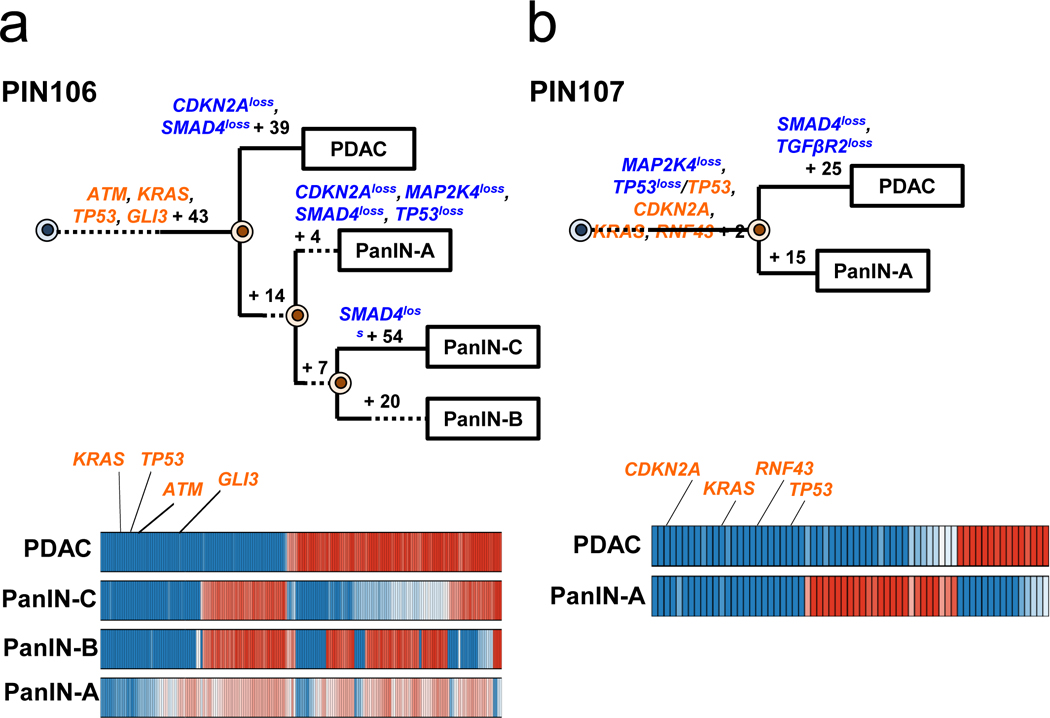
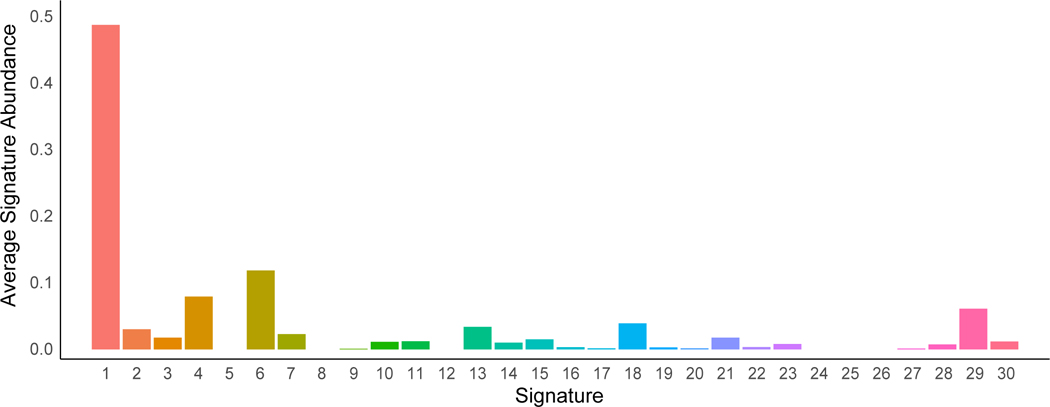
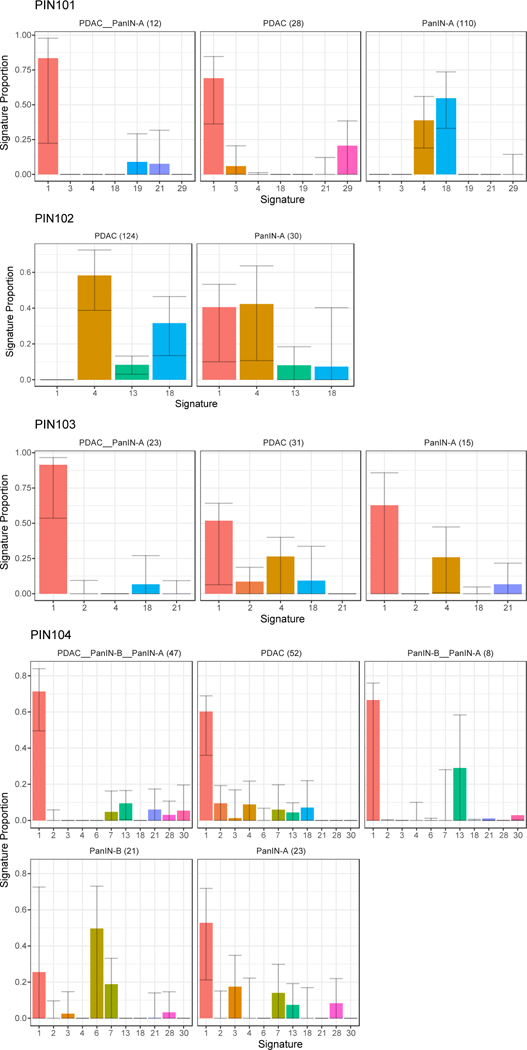
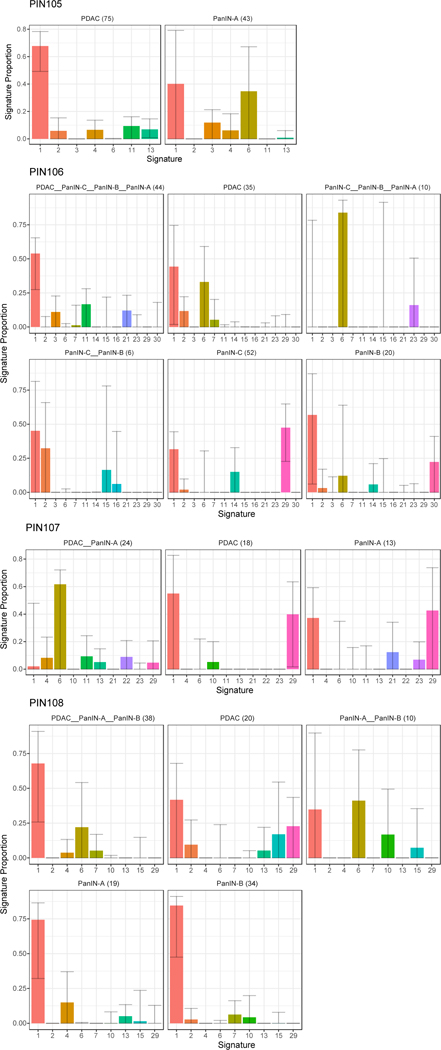
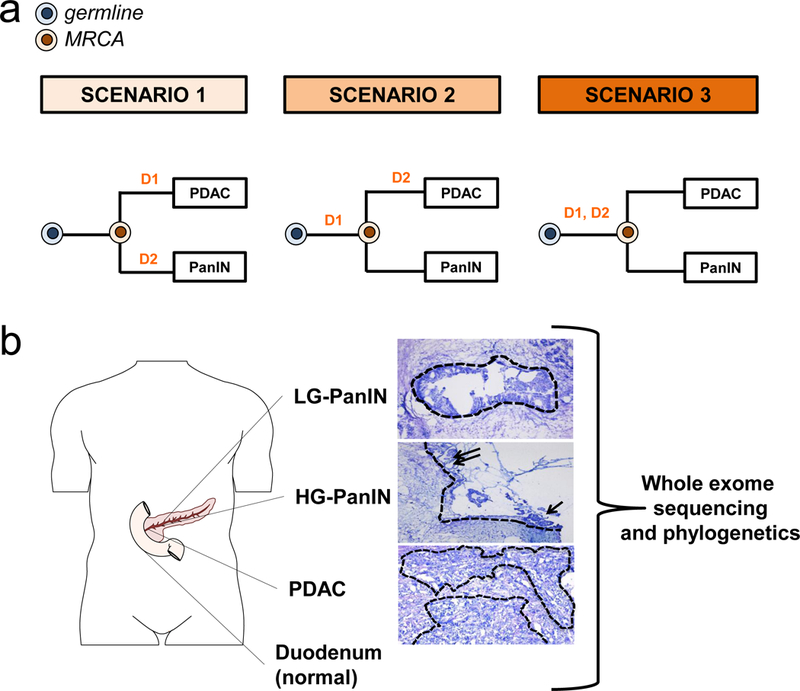
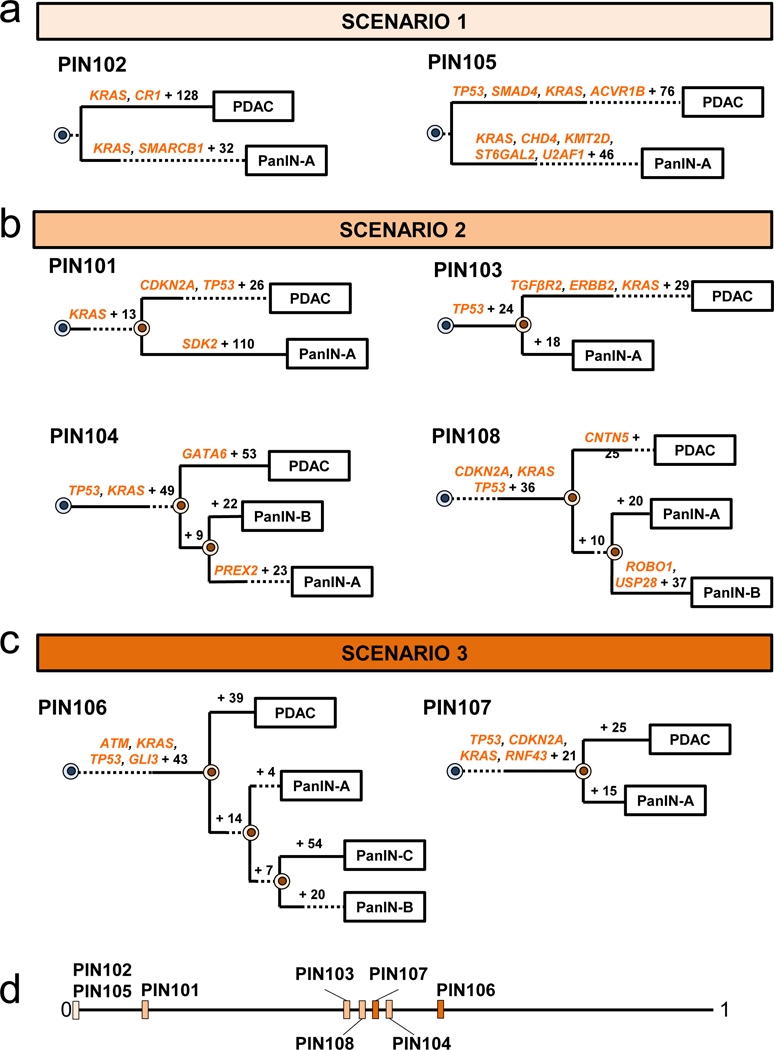
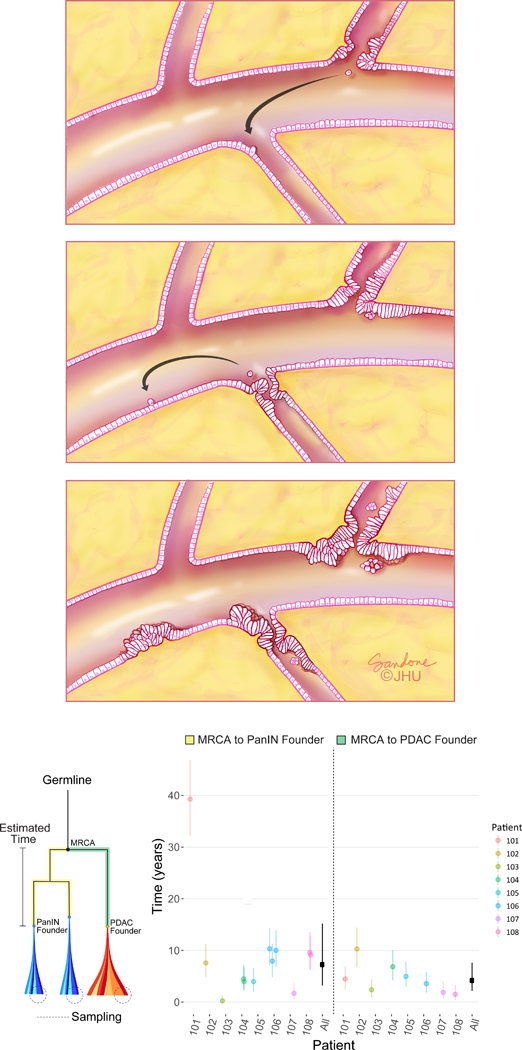
Most adult carcinomas develop from noninvasive precursor lesions, a progression that is supported by genetic analysis. However, the evolutionary and genetic relationships among co-existing lesions are unclear. Here we analysed the somatic variants of pancreatic cancers and precursor lesions sampled from distinct regions of the same pancreas. After inferring evolutionary relationships, we found that the ancestral cell had initiated and clonally expanded to form one or more lesions, and that subsequent driver gene mutations eventually led to invasive pancreatic cancer. We estimate that this multi-step progression generally spans many years. These new data reframe the step-wise progression model of pancreatic cancer by illustrating that independent, high-grade pancreatic precursor lesions observed in a single pancreas often represent a single neoplasm that has colonized the ductal system, accumulating spatial and genetic divergence over time.


Figures

Extended Data Figure 1.
Extended Data Figure 1.. Mutation counts and features of samples.
a. Number of somatic mutations detected per sample with clinical features of each patient. The y-axis shows mutation counts while the x-axis is patient ID. FS Del: frameshift deletion, FS Ins: frameshift insertion, IF Del: in-frame deletion, IF Ins: in-frame insertion, TSS: transcription start site. b,c. Box and whisker plots comparing number of somatic SNVs and CNAs between PanINs and PDACs. The PanIN data are in yellow while the PDAC data are shown in green. The x-axes show the two groups, the y-axes indicate the number. The whiskers indicate the minimum and maximum, while the box indicates the quartiles. The total number of independent PanIN lesions is n = 12, while the total number of PDACs is n = 8. b. Plot depicting the SNVs/INDELs between PanINs and PDACs. c. Plot depicting the CNAs between PanINs and PDACs. Panel c contains hisens results only.
Extended Data Figure 2.
Extended Data Figure 2.. Allelic copy number alterations (x-axis) across all patient samples (y-axis).
The CNAs were inferred using the FACETS algorithm (Supplementary Table 3, FACETs.purity variants shown in this figure). The scale of CNAs range from putative losses (blue) to putative gains (red).
Extended Data Figure 3.
Extended Data Figure 3.. Phylogenetics of PanINs and the matched primary tumor for patients PIN102 and PIN105.
See Supplementary Table 1 for sample identities. The primary tumor is labeled “PDAC” while the PanIN is labeled by a letter. Gene names in orange text are SNVs/INDELs, in blue are copy-number losses, and in red are copy-number gains affecting putative driver genes. The sequencing data for each driver gene variant was manually reviewed to verify phylogenetic position. For each phylogeny, the numbers of acquired mutations are in black font. The branch lengths are proportional to the number of SNVs/INDELs. The dashed line indicates the branch from the germline to the PDAC and PanIN-A. For the Bayesian heat maps, samples are indicated on each row while variants are represented by each column. The color of each tile indicates the probability that the variant is present or absent in the corresponding sample. Dark blue indicates a variant with a >99.9% probability of being present, while dark red indicates a variant with a >99.9% probability of being absent. Light blue and red tiles indicate lower probabilities, and white tiles indicate approximately a 50% probability. a. Phylogenetic tree and Bayesian heat map with each variant for PIN102. b. Phylogenetic tree and Bayesian heat map with each variant for PIN105.
Extended Data Figure 4.
Extended Data Figure 4.. Phylogenetics of PanINs and the matched primary tumor for patients PIN101, PIN103, PIN104, and PIN108.
See Supplementary Table 1 for sample identities. The primary tumor is labeled “PDAC” while the PanIN is labeled by a letter. Gene names in orange text are SNVs/INDELs, in blue are copy-number losses, and in red are copy-number gains affecting putative driver genes. The sequencing data for each driver gene variant was manually reviewed to verify phylogenetic position. For each phylogenetic tree, the numbers of acquired mutations are in black font. The branch lengths are proportional to the number of SNVs/INDELs. The dashed lines indicate branches that have been extended to accommodate gene annotation and variant numbers. For the Bayesian heatmaps, samples are indicated on each row while variants are represented by each column. The color of each tile indicates the probability that the variant is present or absent in the corresponding sample. Dark blue indicates a variant with a >99.9% probability of being present, while dark red indicates a variant with a >99.9% probability of being absent. Light blue and red tiles indicate lower probabilities, and white tiles indicate approximately a 50% probability. a. PIN101. In manual review of the sequencing data, a read supporting the presence of the KRAS p.G12D variant was detected in both the PDAC and PanIN-A samples and was thus moved to the trunk of the phylogeny despite the overall low coverage of KRAS in PanIN-A. b. PIN103. c. PIN104. The node leading from the first MRCA to the second MRCA has a confidence value of >99%. d. PIN108. The node leading from the first MRCA to the second MRCA has a confidence value of >99%.
Extended Data Figure 5.
Extended Data Figure 5.. Phylogenetics of PanINs and the matched primary tumor for patients PIN106 and PIN107.
See Supplementary Table 1 for sample identities. The primary tumor is labeled “PDAC” while the PanINs are labeled by letters. Gene names in orange text are SNVs/INDELs, in blue are copy-number losses, and in red are copy-number gains affecting putative driver genes. The sequencing data for each driver gene variant was manually reviewed to verify phylogenetic position. For each phylogeny, the numbers of acquired mutations are in black font. The branch lengths are proportional to the number of SNVs/INDELs. The dashed lines indicate branches that have been extended to accommodate gene annotation and variant numbers. For each Bayesian heat map, samples are indicated on each row while variants are represented by each column. The color of each tile indicates the probability that the variant is present or absent in the corresponding sample. Dark blue indicates a variant with a >99.9% probability of being present, while dark red indicates a variant with a >99.9% probability of being absent. Light blue and red tiles indicate lower probabilities, and white tiles indicate approximately a 50% probability. a. PIN106. The node leading from the first MRCA to the second MRCA has a confidence value of >99% and the node leading from the second MRCA to the third MRCA has a confidence value of 82%. b. PIN107.
Extended Data Figure 6.
Extended Data Figure 6.. Average signature abundance across samples.
Signature numbers 1–30 from Alexandrov et al. are shown on the x-axis with signature abundance averaged across phylogenetic branches shown on the y-axis. Each histogram is colored by signature identity.
Extended Data Figure 7.
Extended Data Figure 7.. The proportion of mutational signatures from Alexandrov et al. estimated in PIN101-PIN104.
Signatures are shown on the x-axis, with the proportion of each signature shown on the y-axis. Each bar is colored by signature identity. The text on the top of each panel denotes the corresponding phylogenetic branch and the number of mutations acquired along it in parentheses. Error bars depict 90% confidence intervals in the signature proportion estimated by 100 iterations of bootstrap resampling.
Extended Data Figure 8.
Extended Data Figure 8.. The proportion of mutational signatures from Alexandrov et al. estimated in PIN105-PIN108.
Signatures are shown on the x-axis, with the proportion of each signature shown on the y-axis. Each bar is colored by signature identity. The text on the top of each panel denotes the corresponding phylogenetic branch and the number of mutations acquired along it in parentheses. Error bars depict 90% confidence intervals in the signature proportion estimated by 100 iterations of bootstrap resampling.
Figure 1.
Figure 1.. Evolutionary scenarios and study strategy of coexistent PanIN(s) and PDAC.
a. Evolutionary scenarios of coexistent PanIN(s) and PDAC. For each of the three evolutionary scenarios, D1 and D2 indicate two hypothetical driver gene alterations whereas the colored cells represent the germline (matched normal sample) in blue and the most recent common ancestor (MRCA) in orange for each PanIN/PDAC pair. The primary tumor is labeled “PDAC” while the PanIN is labeled by a letter. In scenario 1, none of the somatic gene alterations are shared by the PanIN and PDAC. Mutation D1 is private to PDAC and mutation D2 is private to the PanIN. In scenario 2, only D1 is shared by the PanIN and PDAC. The mutation in D2 is private to the PDAC. In scenario 3, both D1 and D2 driver gene alterations are shared by the PanIN and PDAC. b. Tissue collection, histological review and microdissection, whole exome sequencing (WES), and phylogenetic analysis of human patients. Body diagram was adapted from the Motifolio toolkit. Example of PanINs and matched PDAC. The dashed outlines indicate regions that underwent laser capture microdissection of DNA extraction followed by whole exome sequencing (WES). The low-grade PanIN (LG-PanIN) shows well formed papillary structures with nuclear crowding and cytologic atypia. The high-grade PanIN (HG-PanIN) has regions of pseudopapillary formation (arrows) with high nuclear to cytoplasmic ratio. The matched PDAC shows features of poorly differentiated carcinoma with desmoplasia.
Figure 2.
Figure 2.. Phylogenetics of eight patients.
a-c. Phylogenetic trees from SNVs/INDELs. See Supplementary Table 1 for sample identities. For each phylogeny, gene names in orange text are SNVs/INDELs and the number of additionally acquired mutations are in black font. The branch lengths approximate the number of SNVs/INDELs. The dashed lines indicate branches that have been extended to accommodate gene annotation and variant numbers. The sequencing data for each driver gene variant was manually reviewed to verify phylogenetic position. a. PIN102 and PIN105 are both scenario 1. b. PIN101, PIN103, PIN104, and PIN108 are scenario 2. In manual review of the PIN101 sequencing data, a read supporting the presence of the KRAS p.G12D variant was detected in both the PDAC and PanIN-A samples and was thus moved to the trunk of the phylogeny despite the overall low coverage of KRAS in PanIN-A. c. PIN106 and PIN107 are scenario 3. d. Jaccard indices from SNVs/INDELs. For each evolutionary scenario, the average Jaccard index for each patient was calculated from all driver and passenger variants (see Supplementary Table 6 for values) and plotted on a range from 0 to 1, with values closer to 1 denoting higher genetic similarity.
Figure 3.
Figure 3.. Putative growth pattern of coexistent PanIN(s) and PDAC and mathematical model.
a. Spatial evolution and PanIN progression in intralobular ducts. Low grade PanIN (LG-PanIN) and high grade PanIN (HG-PanIN) lesions represent precursors with differing degrees of nuclear and cytologic atypia. A LG-PanIN develops and seeds a cell that travels to a second duct (arrow, left panel). The first LG-PanIN matures into a HG-PanIN, while a LG-PanIN develops at the second site and a cell subsequently travels to a third duct (arrow, center panel). The second site LG-PanIN matures into a HG-PanIN while a LG-PanIN develops at the second site (right panel). b. Estimated progression times. The lineage leading from the MRCA to the PanINs is illustrated in yellow, while the lineage leading from the MRCA to the PDAC is in green. Clonal passenger mutations were used to estimate progression times, shown for each patient with 90% CIs. Overall (black), the inferred median time elapsed between the common ancestral cell and the birth of the founder clone of a PanIN was 7.1 years (90% CI 3.3–12.2; MRCA to PanIN, n = 12). The median time elapsed between the common ancestral cell and the PDAC was 4.3 years (90% CI 2.3–7.2; MRCA to PDAC, n = 8). These estimates assume a mutation rate of 0.0224 per generation and a time per generation of 4 days (Online Methods).

Comment in

References

    1. Vogelstein B et al. Cancer genome landscapes. Science 339, 1546–58 (2013). - PMC - PubMed
    1. Vogelstein B & Kinzler KW The Path to Cancer --Three Strikes and You’re Out. N. Engl. J. Med. 373, 1895–8 (2015). - PubMed
    1. Basturk O et al. A Revised Classification System and Recommendations From the Baltimore Consensus Meeting for Neoplastic Precursor Lesions in the Pancreas. Am. J. Surg. Pathol. 39, 1730–1741 (2015). - PMC - PubMed
    1. Hruban RH, Goggins M, Parsons J & Kern SE Progression model for pancreatic cancer. Clin. cancer Res. 6, 2969–72 (2000). - PubMed
    1. van Heek NT et al. Telomere shortening is nearly universal in pancreatic intraepithelial neoplasia. Am. J. Pathol. 161, 1541–7 (2002). - PMC - PubMed

Publication types

MeSH terms