. 2019 Jan;38(5):716-730.
doi: 10.1038/s41388-018-0461-3. Epub 2018 Sep 3.

Heterogeneous cancer-associated fibroblast population potentiates neuroendocrine differentiation and castrate resistance in a CD105-dependent manner

Affiliations

Heterogeneous cancer-associated fibroblast population potentiates neuroendocrine differentiation and castrate resistance in a CD105-dependent manner

Manabu Kato et al. Oncogene. 2019 Jan.

Abstract

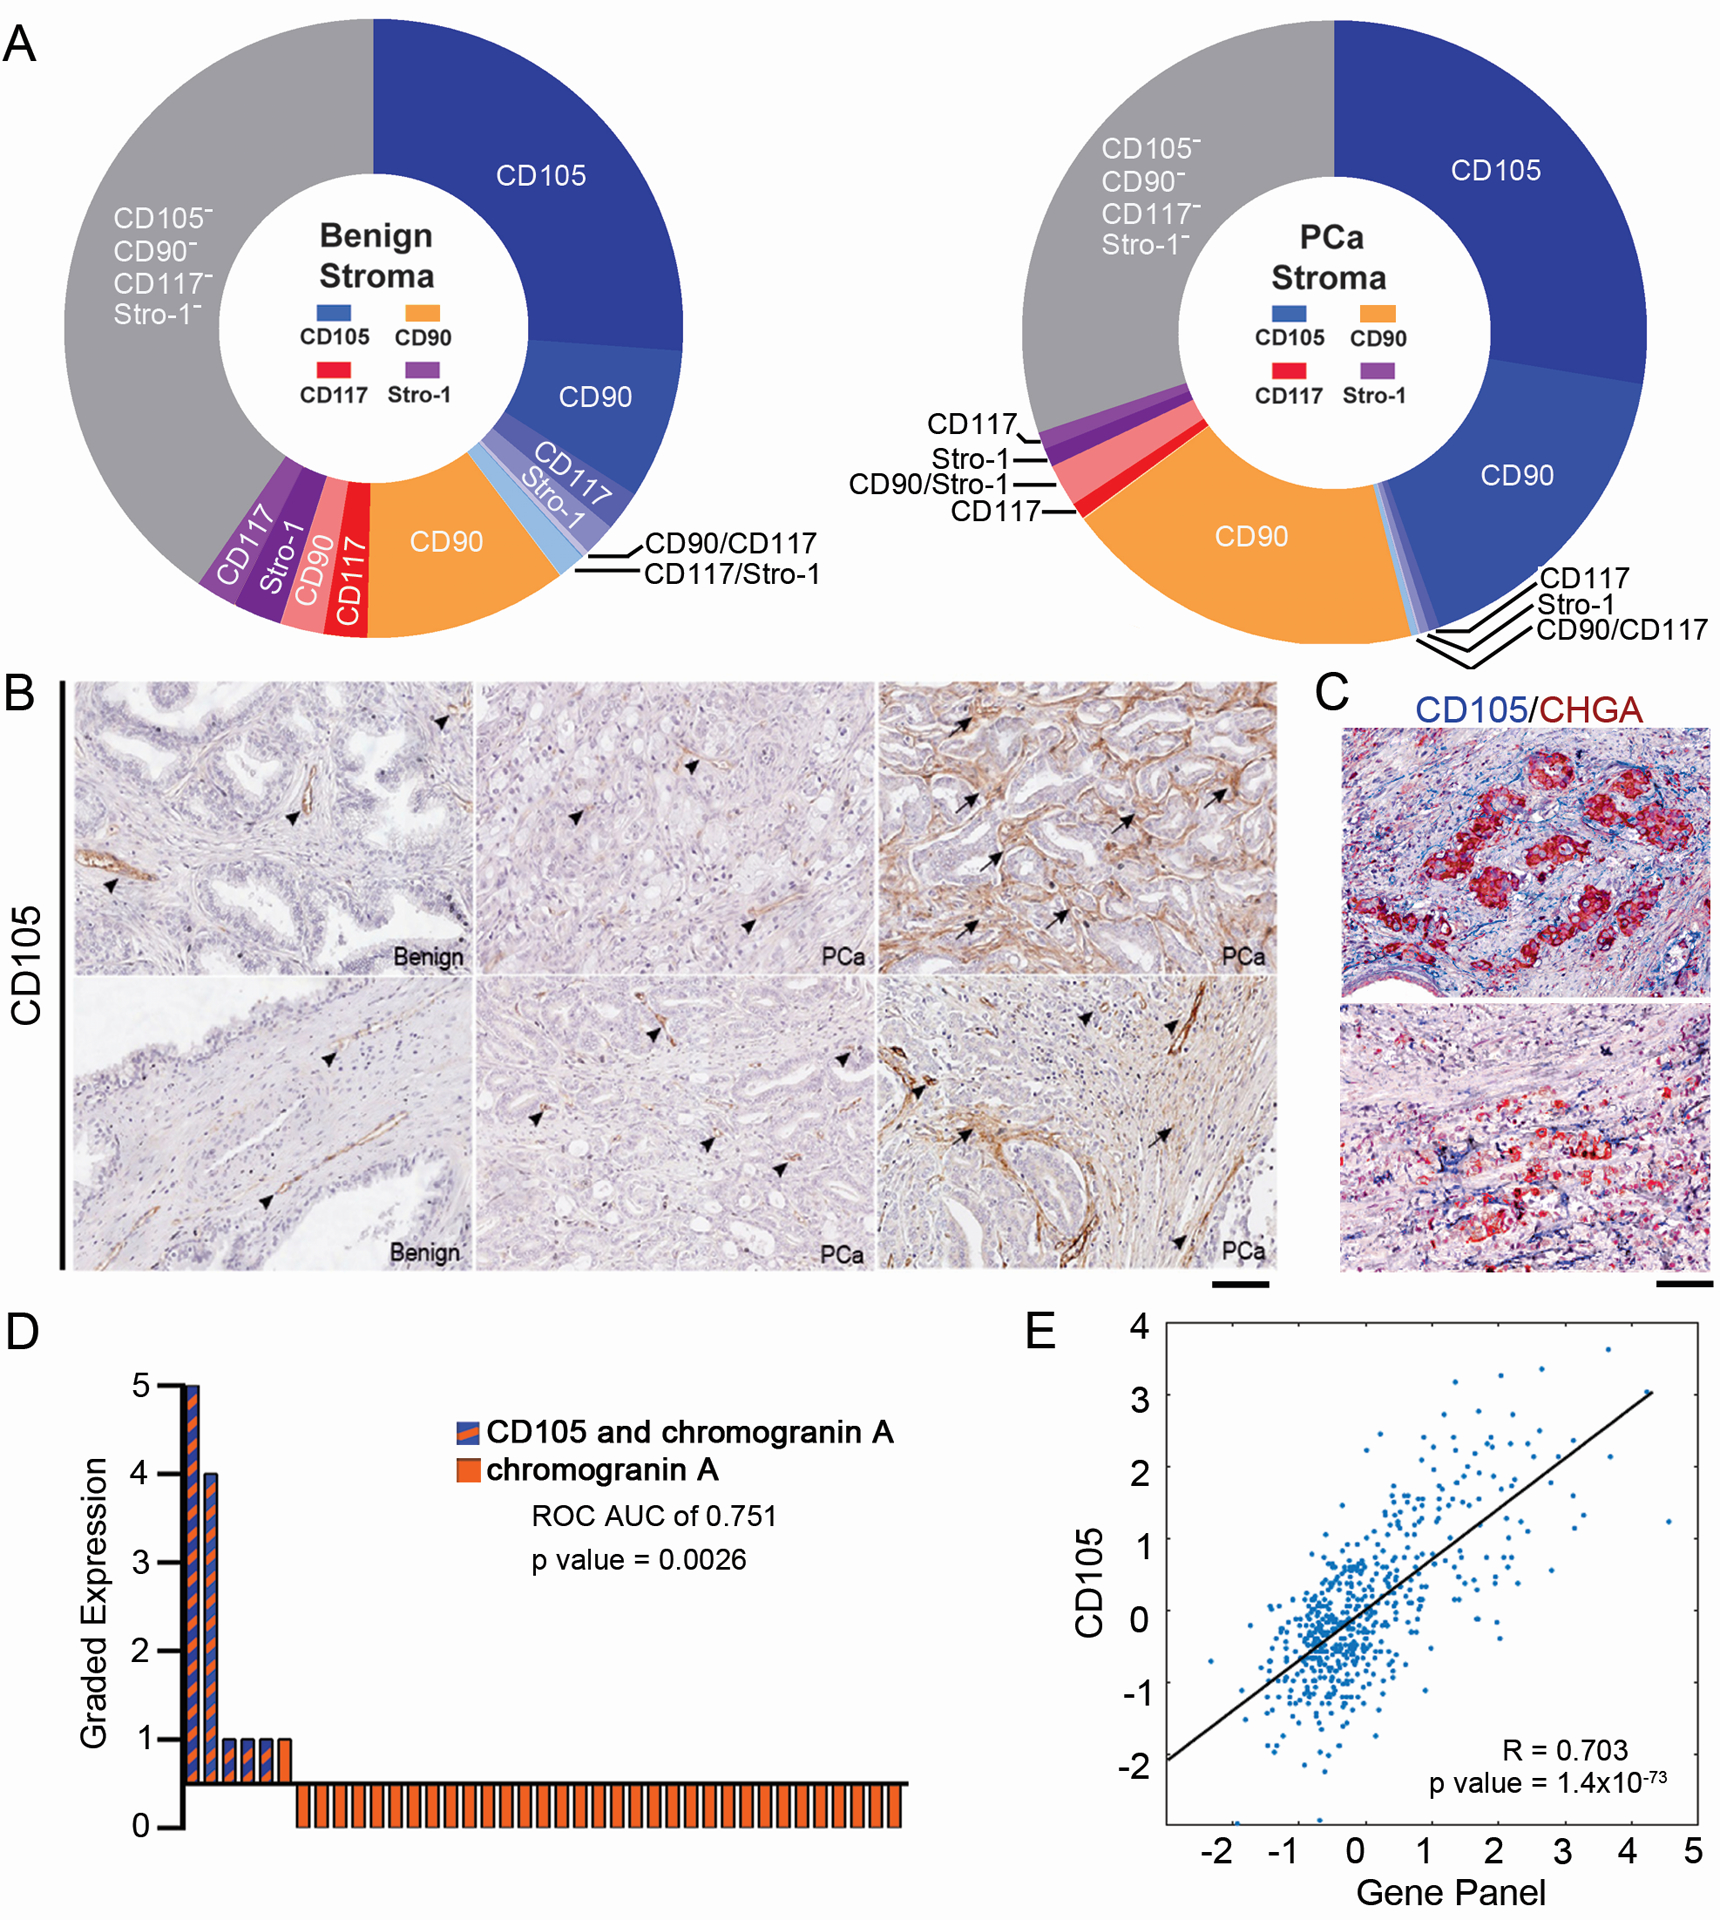
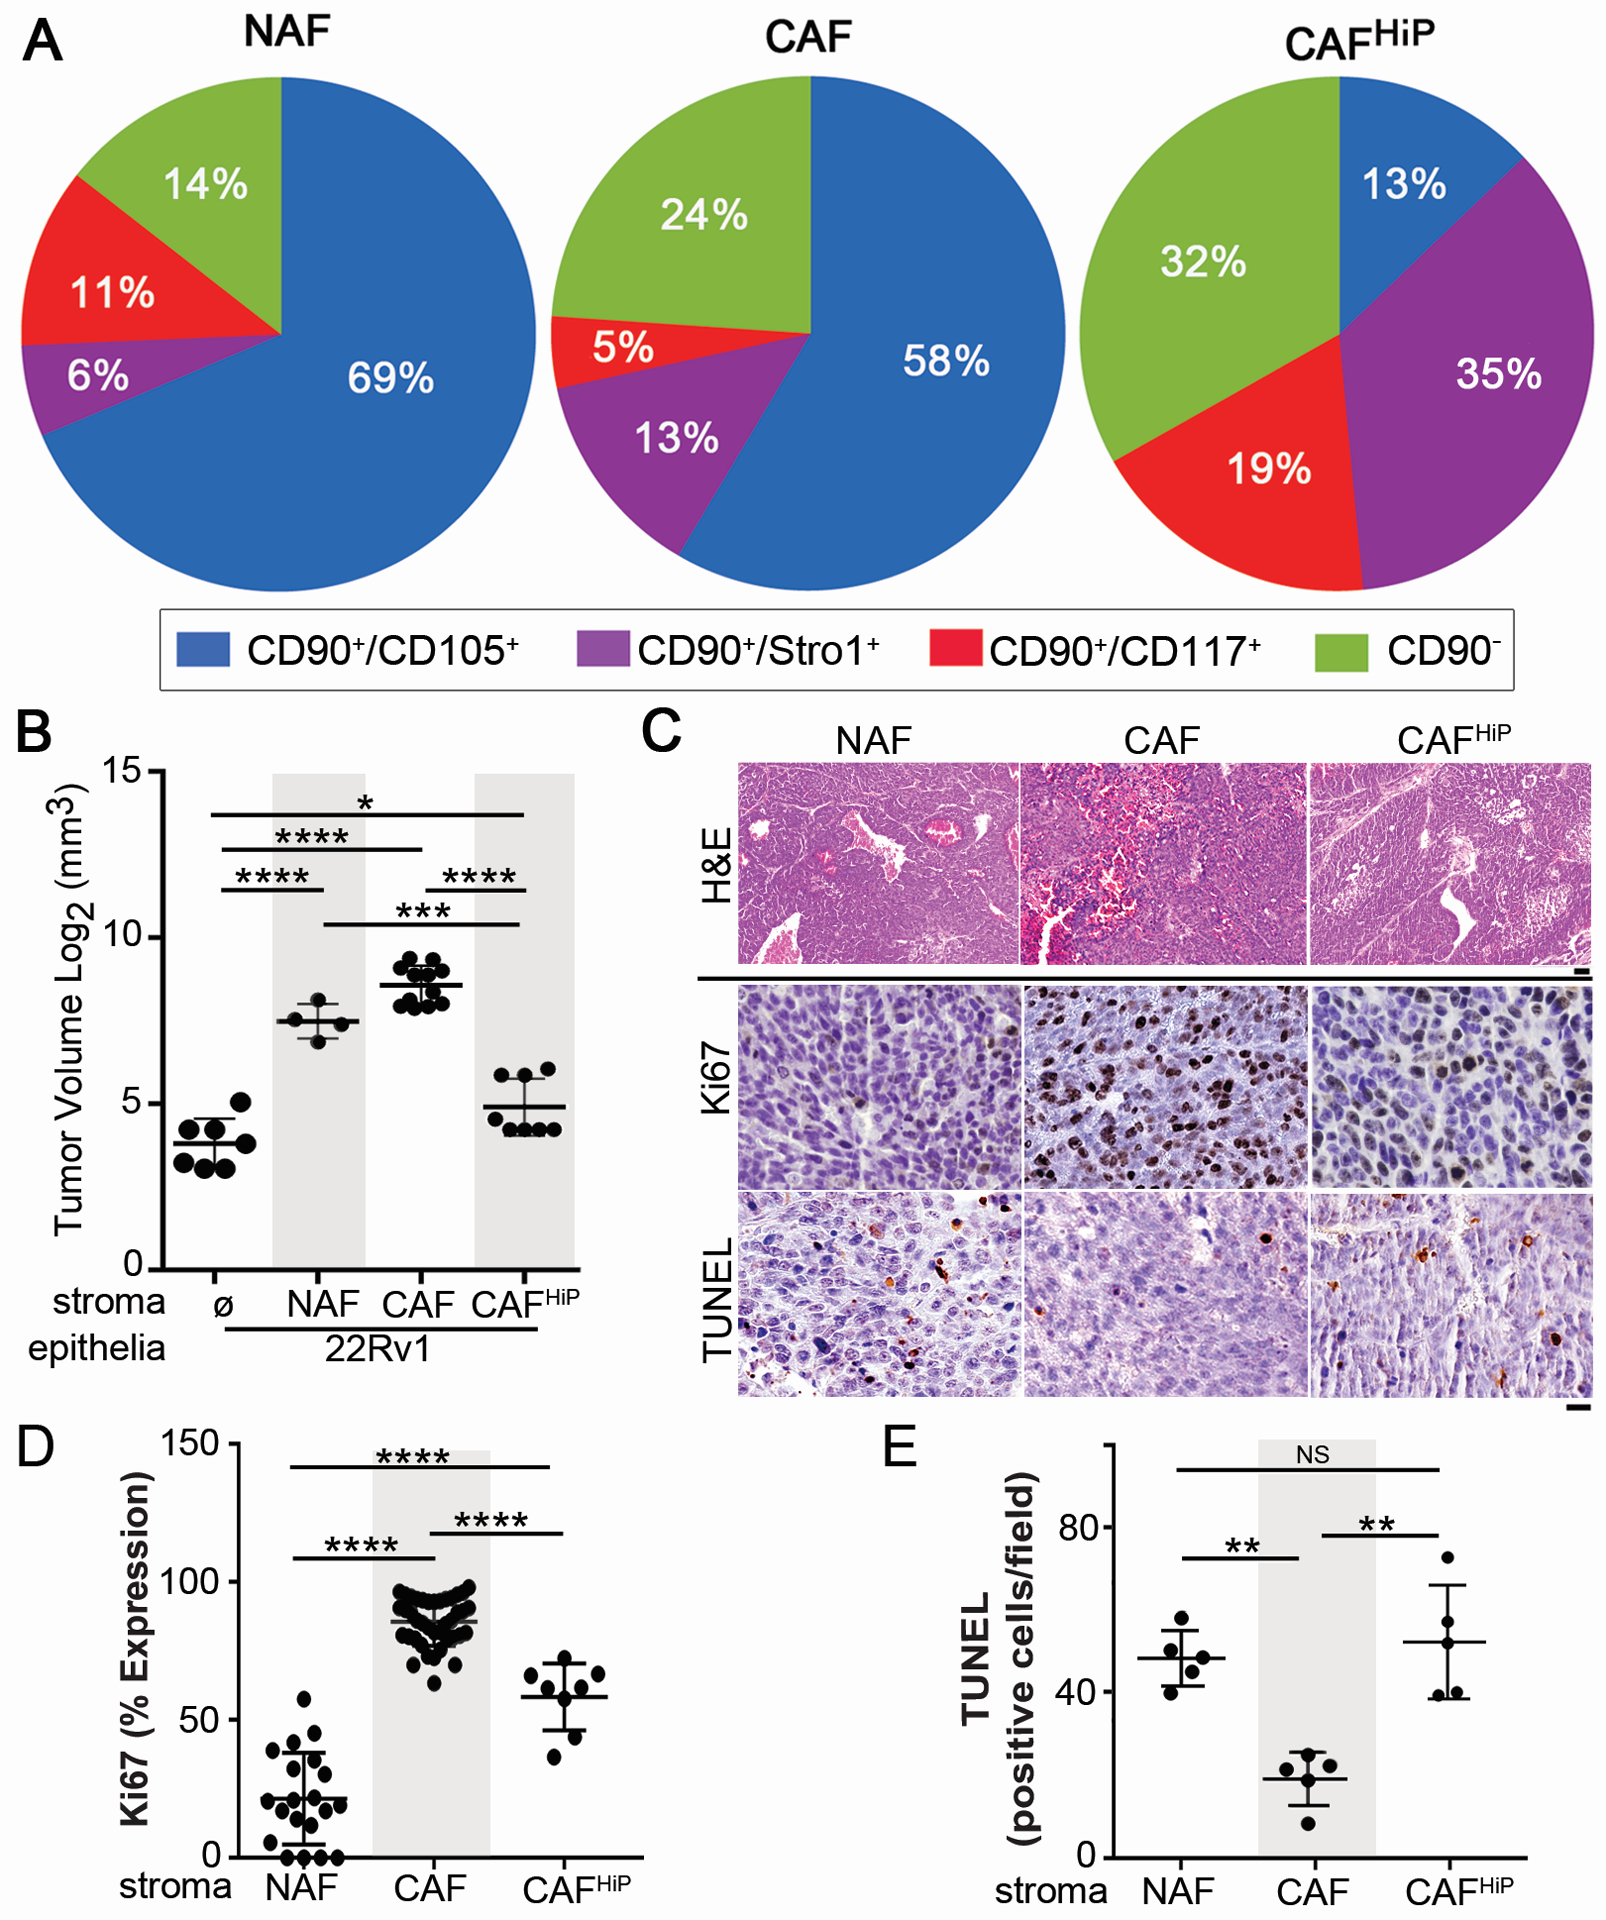
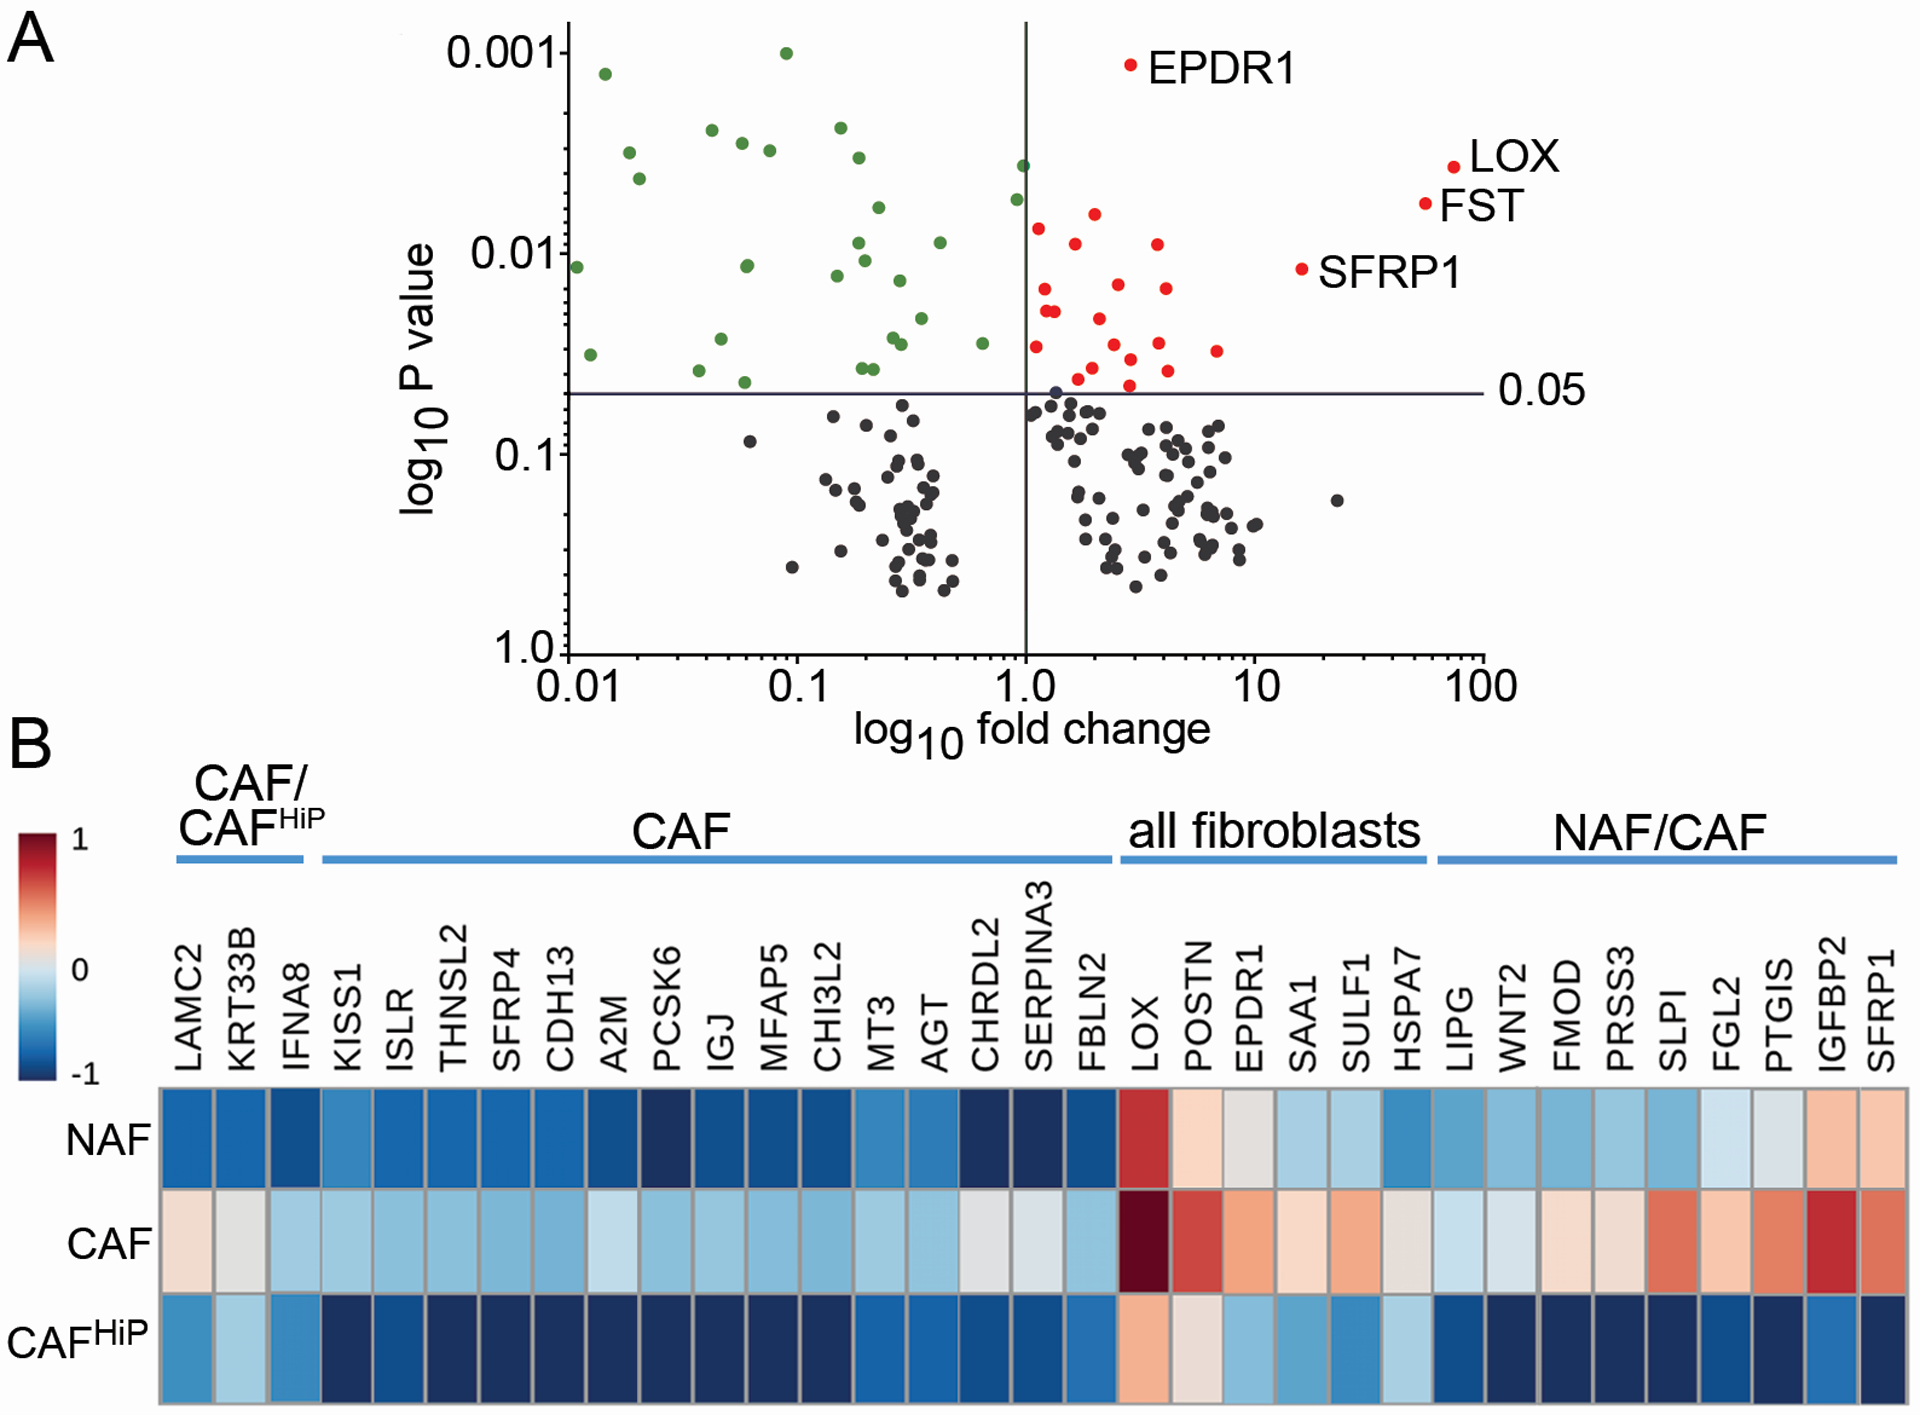
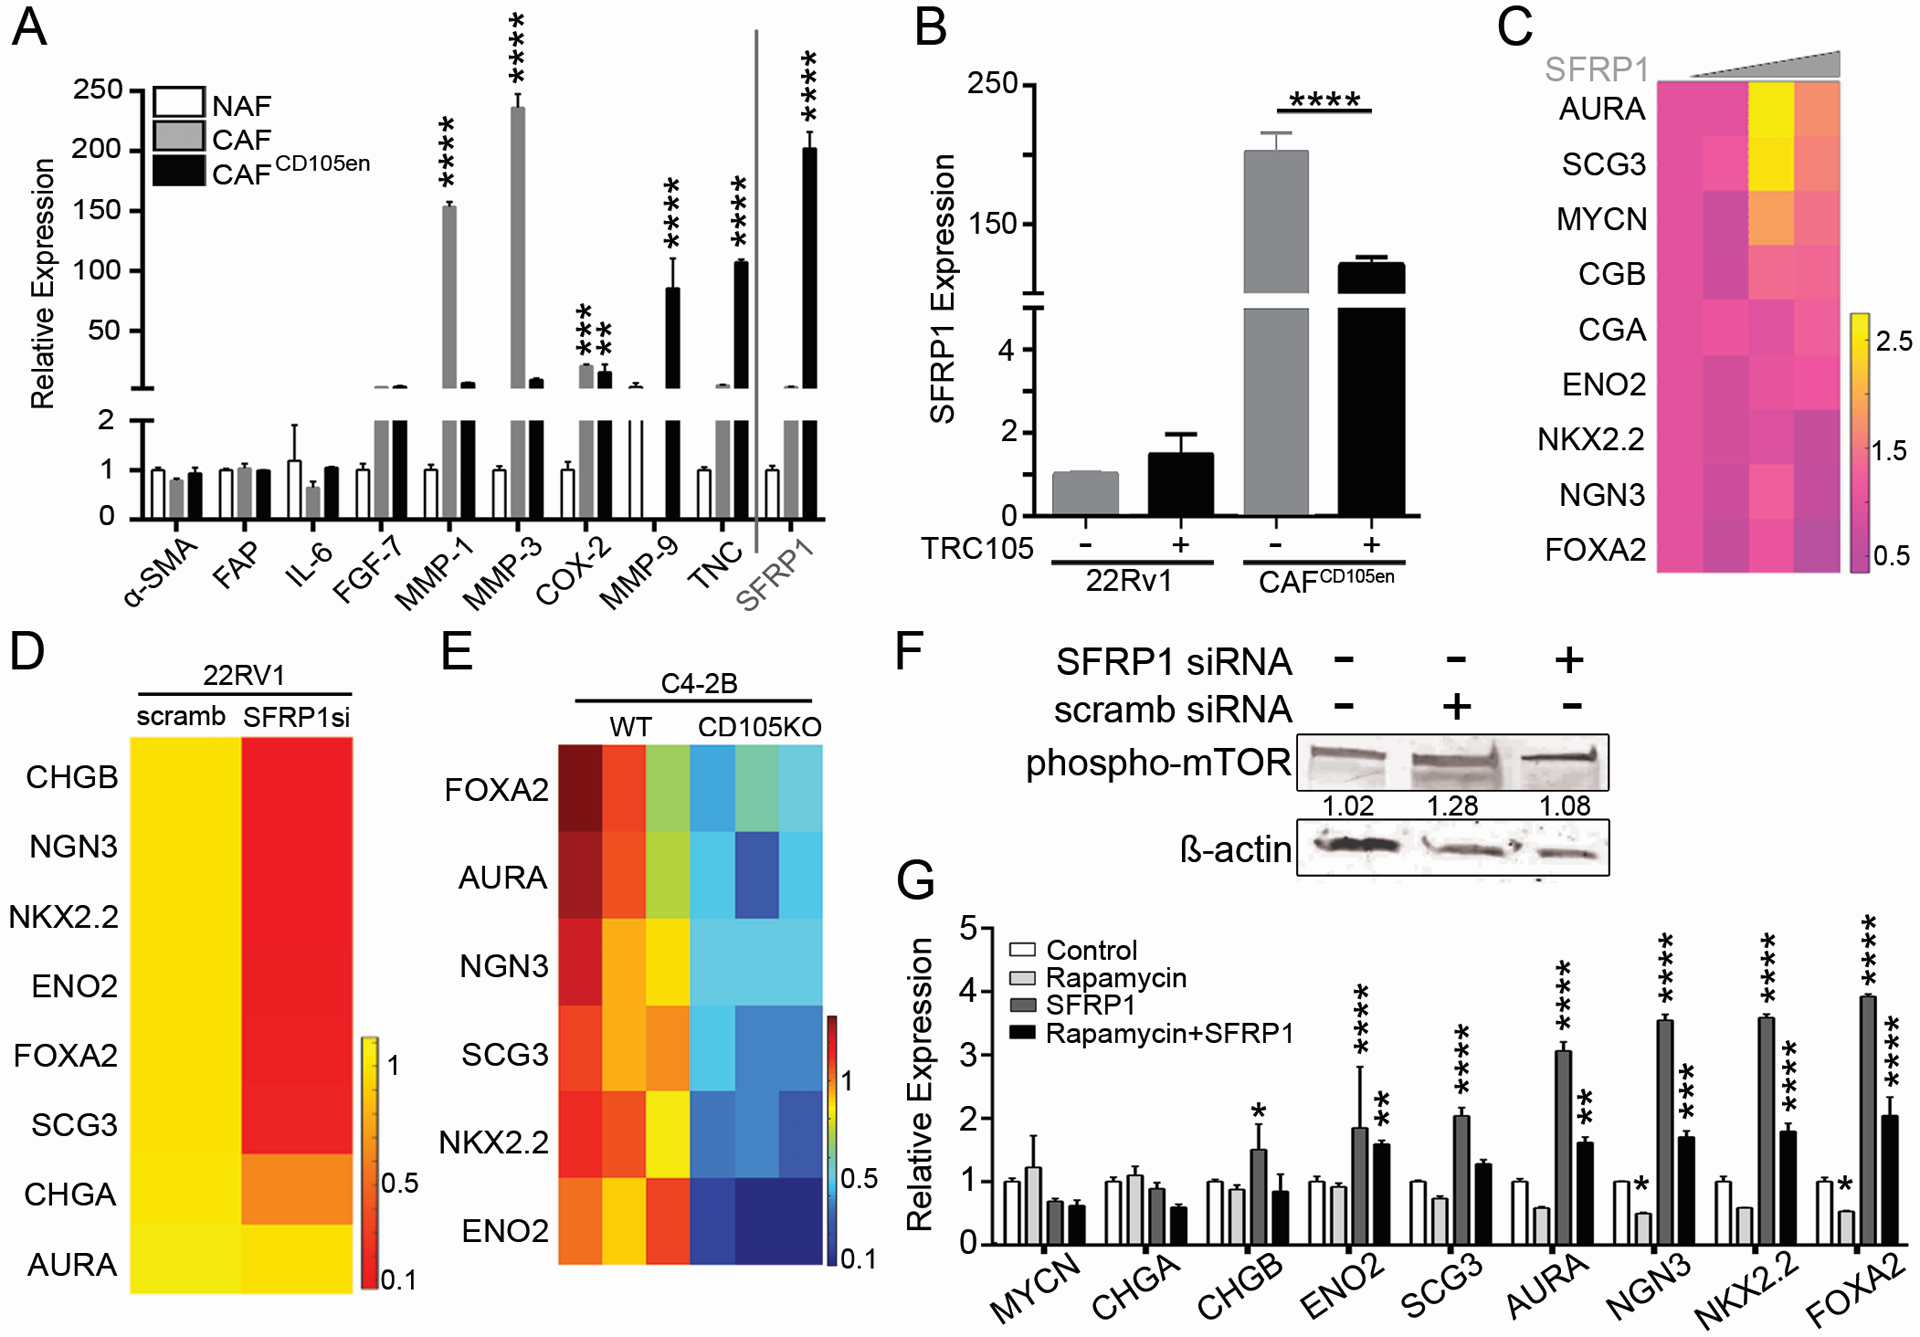
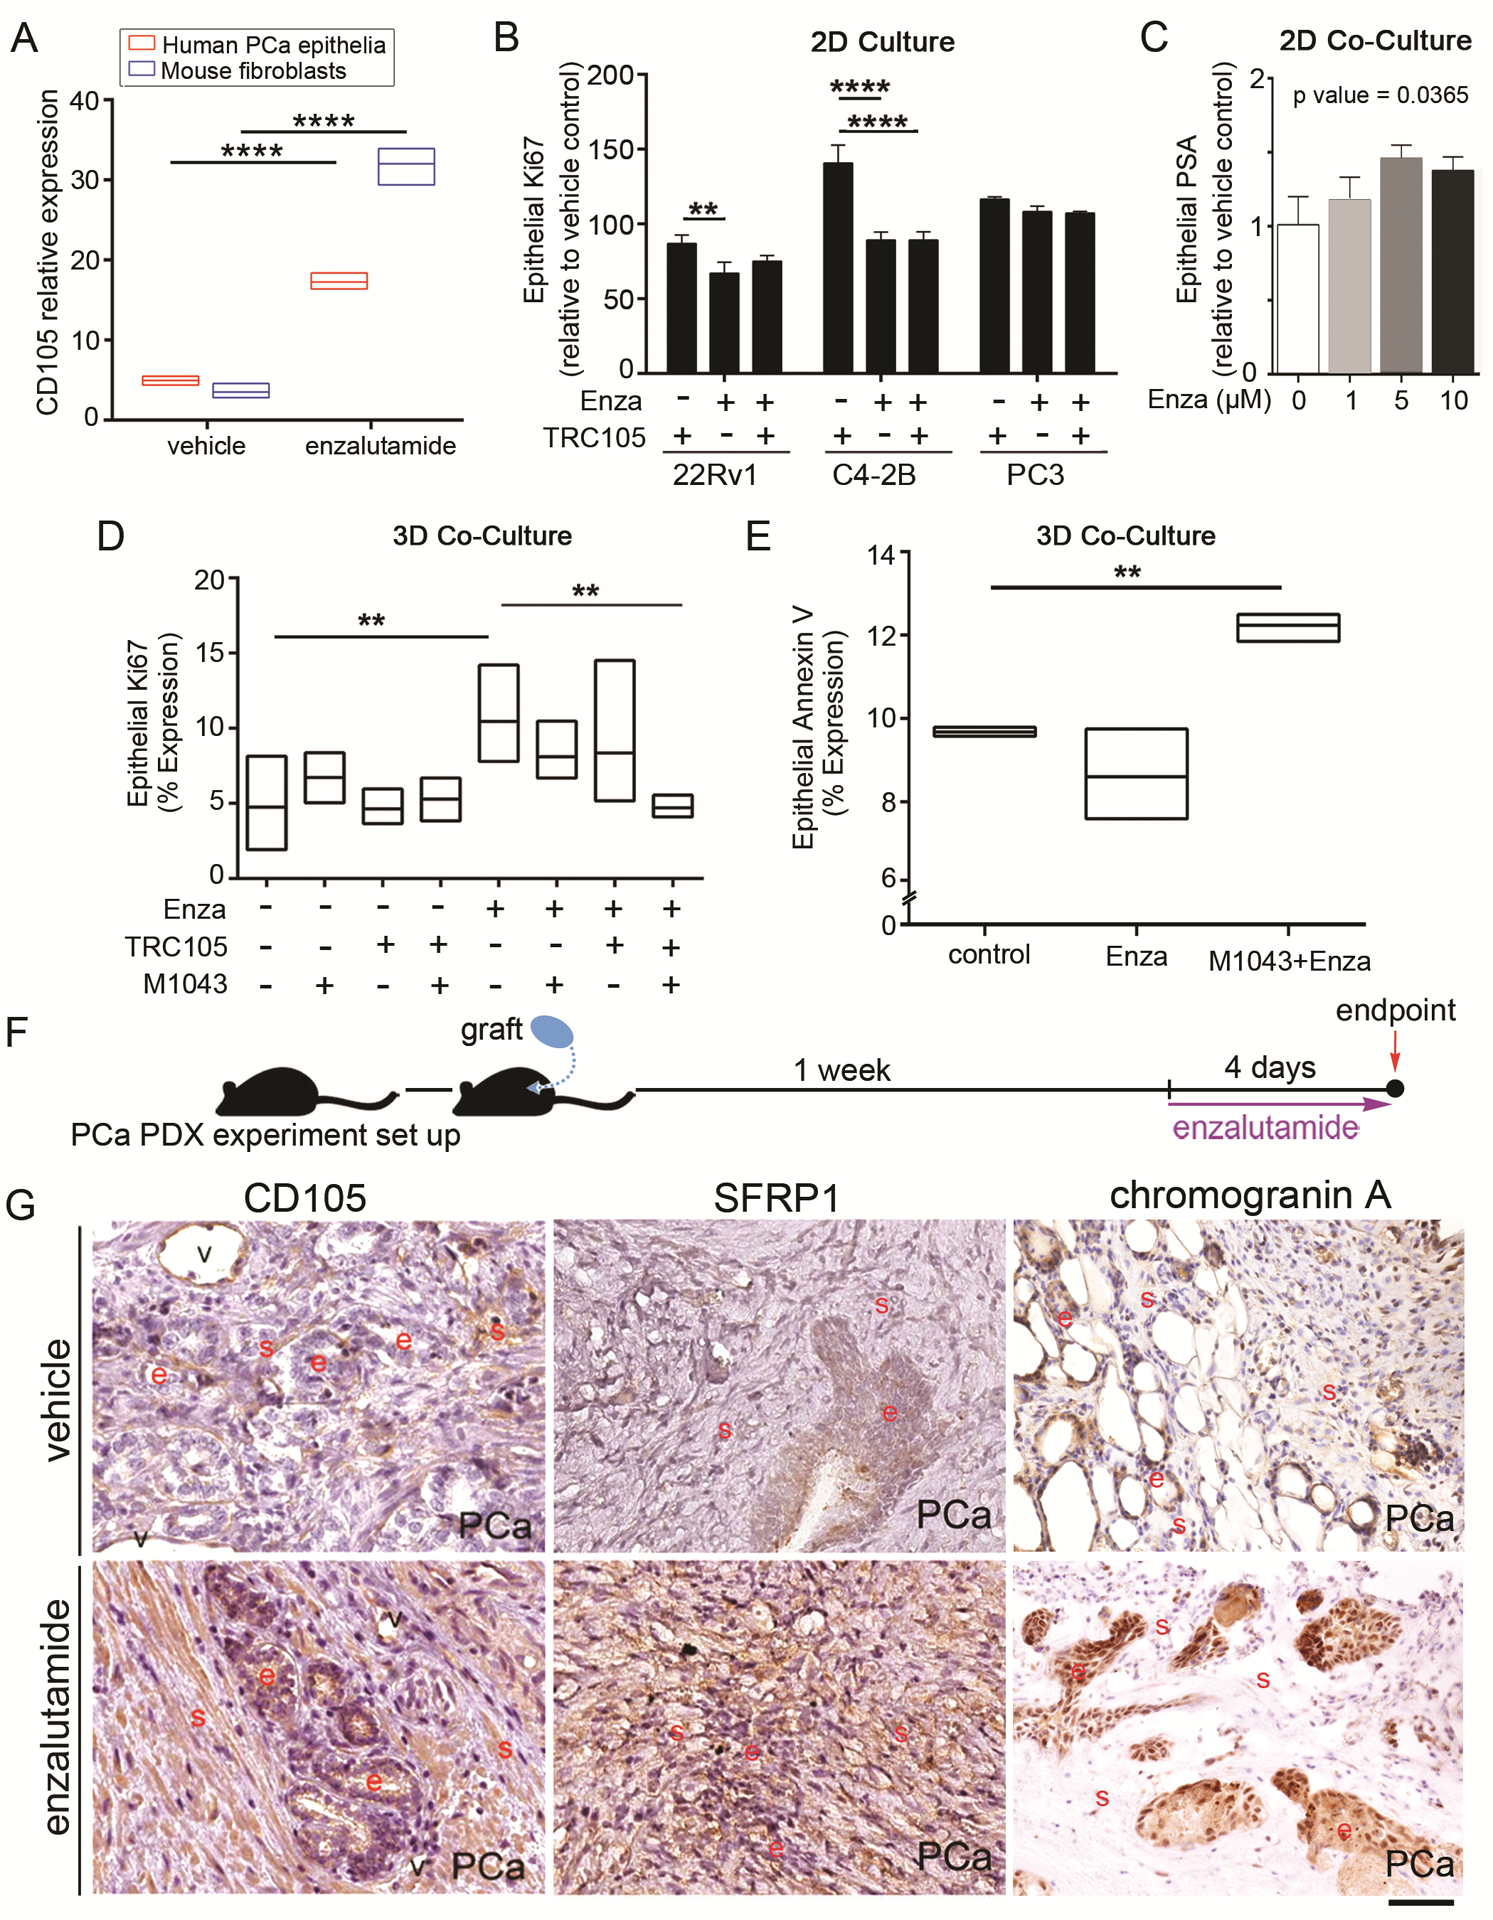
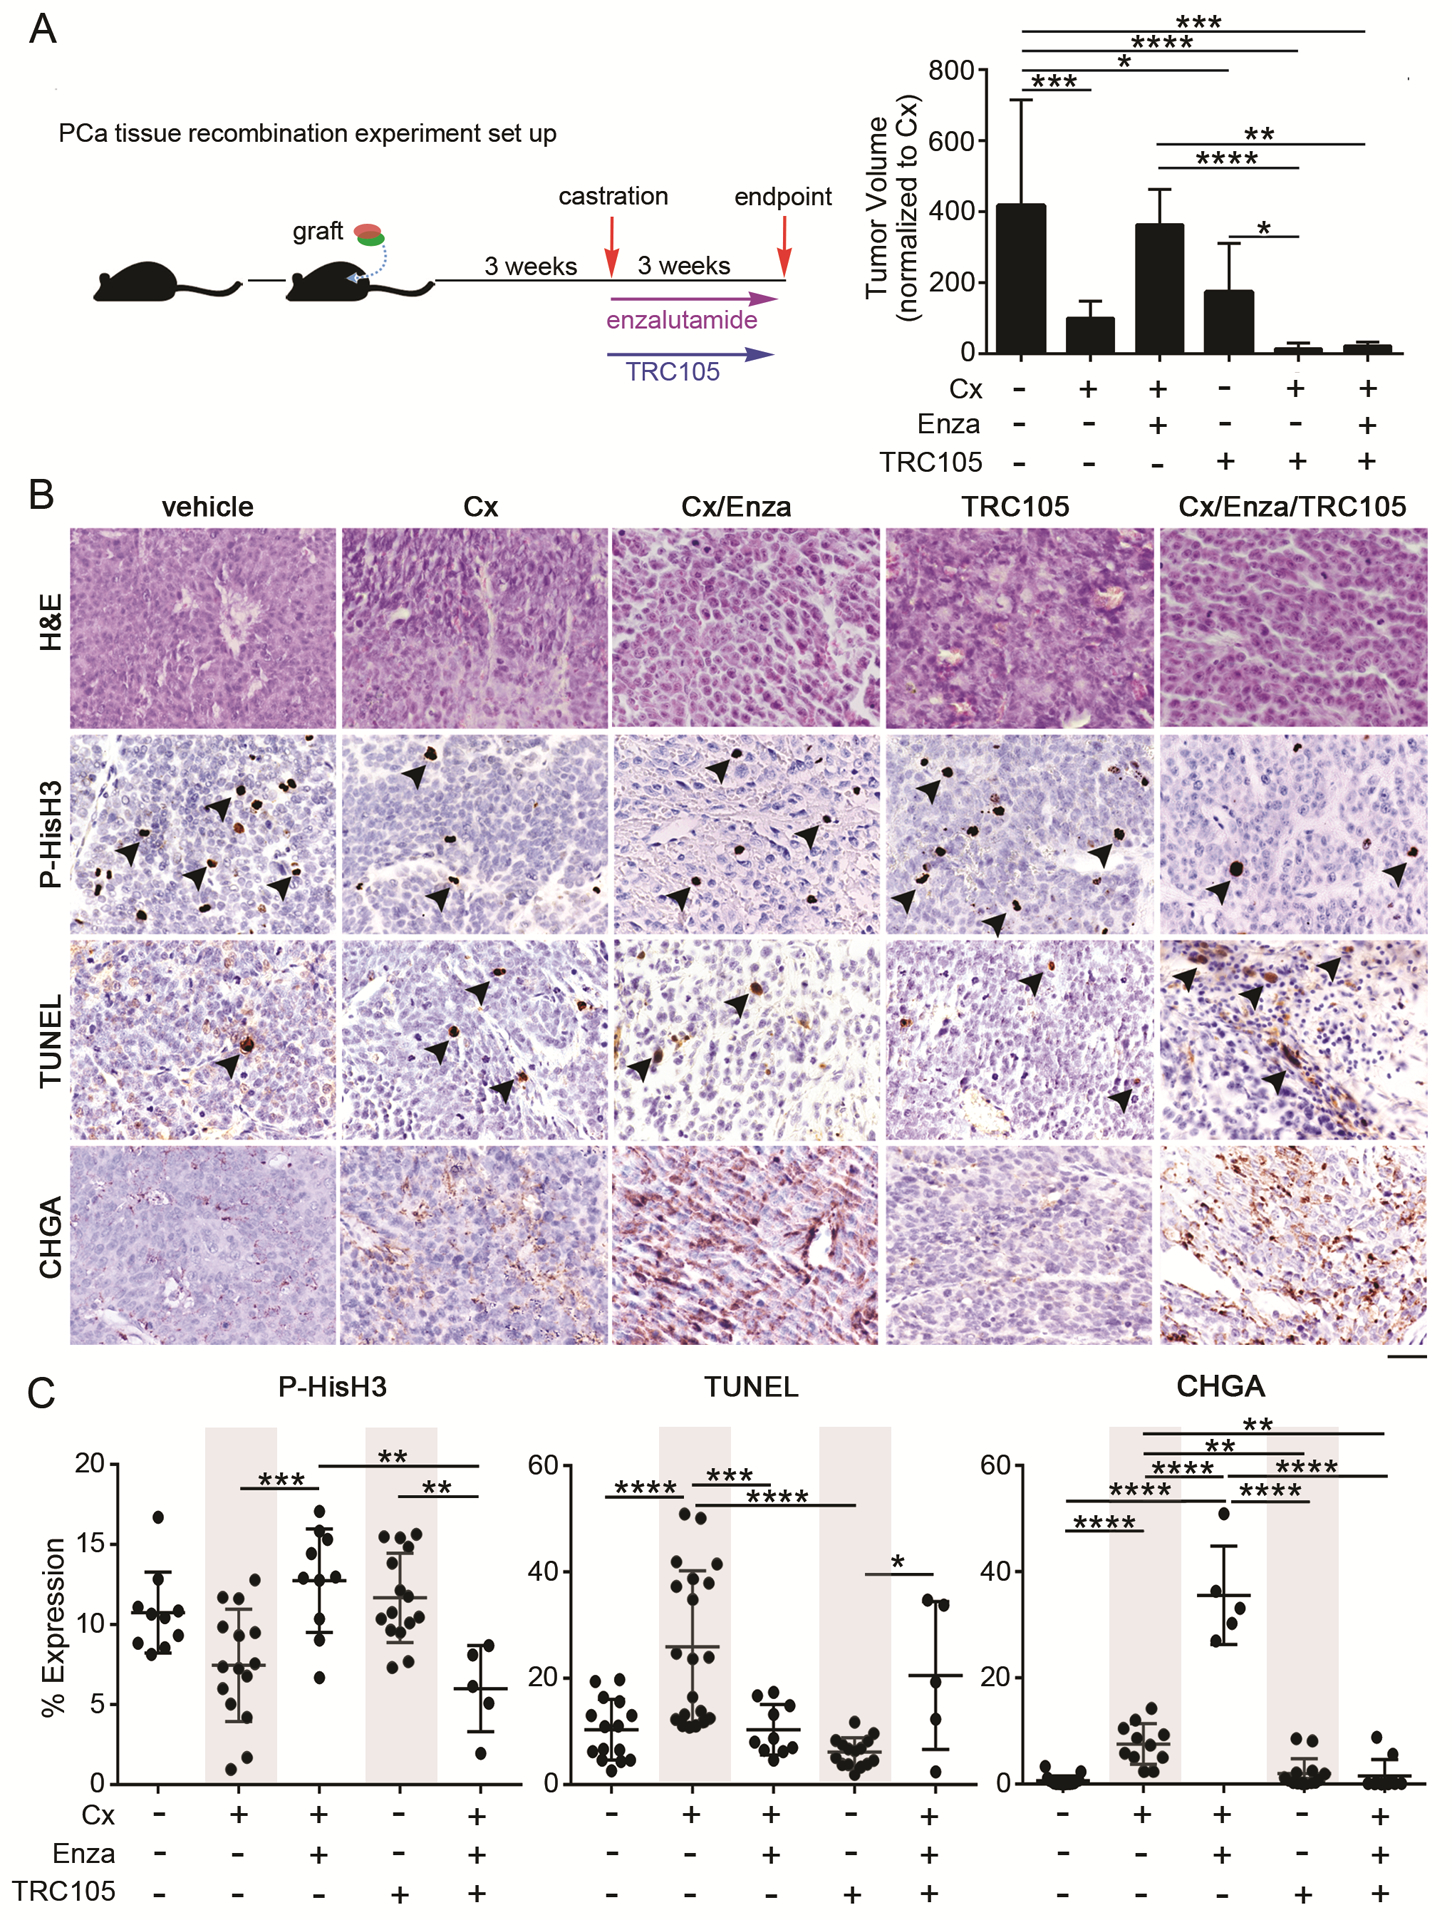
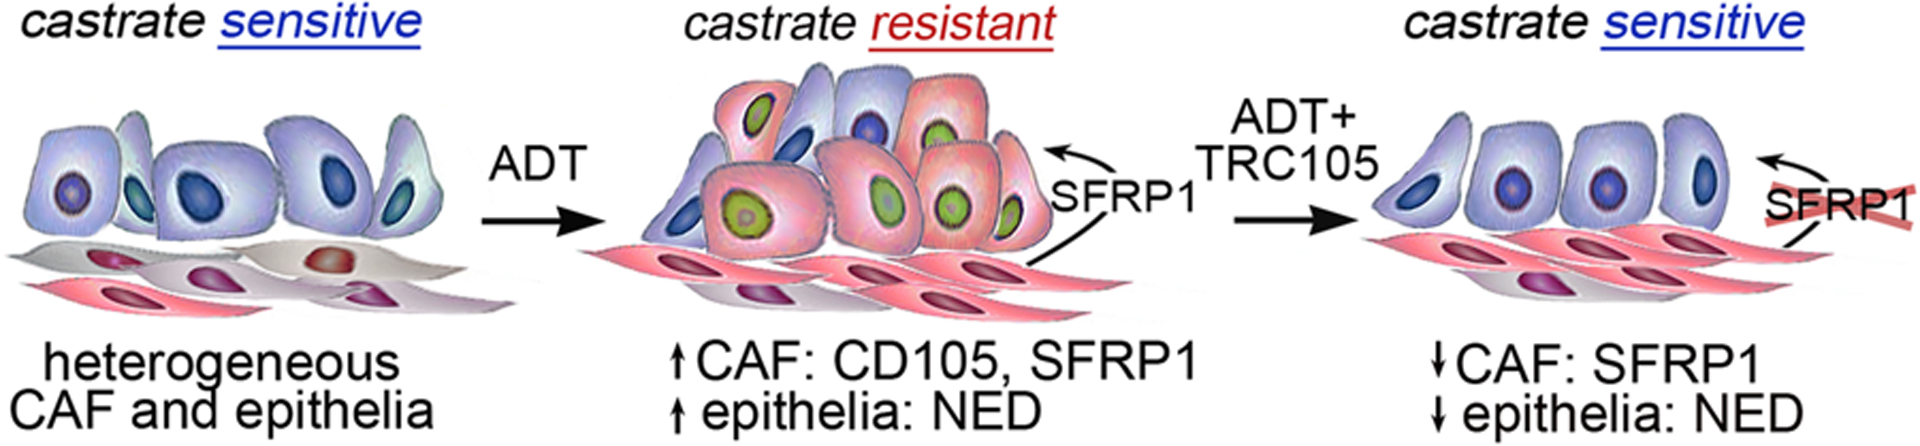
Heterogeneous prostatic carcinoma-associated fibroblasts (CAF) contribute to tumor progression and resistance to androgen signaling deprivation therapy (ADT). CAF subjected to extended passaging, compared to low passage CAF, were found to lose tumor expansion potential and heterogeneity. Cell surface endoglin (CD105), known to be expressed on proliferative endothelia and mesenchymal stem cells, was diminished in high passage CAF. RNA-sequencing revealed SFRP1 to be distinctly expressed by tumor-inductive CAF, which was further demonstrated to occur in a CD105-dependent manner. Moreover, ADT resulted in further expansion of the CD105+ fibroblastic population and downstream SFRP1 in 3-dimensional cultures and patient-derived xenograft tissues. In patients, CD105+ fibroblasts were found to circumscribe epithelia with neuroendocrine differentiation. CAF-derived SFRP1, driven by CD105 signaling, was necessary and sufficient to induce prostate cancer neuroendocrine differentiation in a paracrine manner. A partially humanized CD105 neutralizing antibody, TRC105, inhibited fibroblastic SFRP1 expression and epithelial neuroendocrine differentiation. In a novel synthetic lethality paradigm, we found that simultaneously targeting the epithelia and its microenvironment with ADT and TRC105, respectively, reduced castrate-resistant tumor progression, in a model where either ADT or TRC105 alone had little effect.


Figures

Figure 1.
Figure 1.. Stromal CD105 expression is associated with neuroendocrine differentiation of the adjacent epithelia.
(A) Donut charts show a representative patient stromal makeup from benign or cancer prostatectomy tissue. The relative percent is indicated for the stromal populations based on FACS, n = 4. The dominant population, determined by the marker of greatest intensity per cell, are colored with shades of: blue (CD105), gold (CD90), red (CD117), purple (Stro-1). The double, triple, and quadruple stained cell populations are shown as lighter shades among their dominant population. Gray indicates negative staining for CD105, CD90, CD117, and Stro-1. (B) Immunohistochemical staining of CD105 (brown) from representative core sections of tissue arrays counterstained with hematoxylin. Arrow heads indicate CD105-positive blood vessels and arrows indicate CD105-positive stromal fibroblast staining, n=94. Scale bar represents 100 μm. (C) Representative serial sections from tissue cores stained for CD105 and chromogranin A, counterstained with hematoxylin, n = 39 paired tissues. A pseudo-colored overlay is shown to emphasize the localization of CD105 positive (blue) staining relative to chromogranin A positive staining (magenta). Scale bar represents 100 μm. (D) Waterfall plot indicates relative expression of epithelial chromogranin A (orange bars) and those that had co-expression of stromal CD105 (hatched orange and blue bars) on a graded scale of 0–5, where 5 was the greatest staining in paired cores, n = 39. (E) Scatter plot of the canonical correlation based on the R2 analysis platform between the neuroendocrine gene panel (AURKA, SCG3, MYCN, CGA, CGB, ENO2, NKX2.2, FOXA2) and CD105.
Figure 2.
Figure 2.. Stromal heterogeneity dictates tumor progression.
(A) Pie charts illustrate the relative ratio of the indicated stromal fibroblastic populations based on cell surface expression of the indicated markers: CD90+/CD105+ (blue), CD90+/Stro-1+ (purple), CD90+/CD117+ (red), and CD90 (green), n > 3. ANOVA analysis demonstrates NAF, CAF, and CAFHiP have distinct populations (p < 0.03). (B) Scatter plot indicates individual tumor volume (log transformed) for tissue recombinant tumors made up of 22Rv1 epithelia with the indicated fibroblastic populations. n > 4. (C) Histology for representative recombinant tumor sections of 22Rv1 with the indicated fibroblastic populations are shown. H&E staining shows tumor morphology (scale bar represents 64 μm). Ki67 and TUNEL immune-localization, with hematoxylin nuclear counterstain (scale bar represents 32 μm), is shown, n > 5. (D) The scatter plot shows quantitation of percent expression for Ki67 immunohistochemical staining, n > 8. (E) The scatter plot shows quantitation of the number of TUNEL positive nuclei per field by immunohistochemical staining, n > 5. For all, error bars are mean +/− SD, and p values of less than 0.05 were considered statistically significant (*P<0.05, **P<0.01, ***P<0.001, ****P<0.0001).
Figure 3.
Figure 3.. Differential gene expression in NAF, CAF, and CAFHiP stromal fibroblasts.
(A) The top 200 differentially expressed genes identified by RNA sequencing were plotted in a volcano chart to compare the ratio of CAFHiP to CAF. The effect size ratio was set to 1 indicating less effect below this threshold. Genes in the upper right quadrant (red) are considered significant with an effect greater than 1. Genes in the upper left quadrant (green) were considered significant with less effect. (B) Among the top 200 differentially expressed genes, 33 coded for secreted proteins, illustrated in the heat map following log transformation. The labels above the gene names highlight expression in NAF, CAF, and CAFHiP.
Figure 4.
Figure 4.. Androgen axis inhibition mediates paracrine SFRP1-mediated neuroendocrine differentiation.
(A) Relative mRNA expression for the indicated genes is graphed for NAF (white), CAF (gray), and CAFCD105en (black) as mean +/− SD, n = 3. Primer sequences are listed in Supplementary Table S1. (B) Bar graph shows relative SFRP1 mRNA expression in human 22Rv1 and CAFCD105en regulated by TRC105 compared to IgG (control) treatment, n > 3. (C) Heat map shows the relative expression for the neuroendocrine gene panel in 22Rv1 cells, normalized to GAPDH, when treated with 0, 0.01, 0.1, and 1 μg/ml SFRP1, n = 3. Gradient scale from 2.5-fold increase (yellow) to 0.5-fold decrease (purple) indicates gene expression changes compared to control. (D) Heat map shows the relative expression for the neuroendocrine gene panel in 22Rv1 cells, normalized to β-actin, when treated with enzalutamide in combination with conditioned media from CAF nucleofected with scramble or siRNA against SFRP1, n = 3. Gradient scale from 1-fold increase (yellow) to 0.1-fold decrease (red) indicates gene expression changes compared to scramble control. (E) Heat map shows the relative expression for the neuroendocrine gene panel in C4–2B cells, normalized to β-actin, when treated with enzalutamide in combination with conditioned media from wild type fibroblasts or CD105 knockout fibroblasts, n=3. Gradient scale from 1-fold increase (red) to 0.1-fold decrease (blue) indicates gene expression changes compared to wild type conditioned media. (F) Immunoblot shows 22Rv1 cell protein expression for phosphorylated-mTOR and β-actin as the loading control, treated with control media or CAF-nucleofected with scramble or siRNA against SFRP1 as indicated for 72 hours. The ratio of phospho-mTOR/β-actin is shown. (G) Bar graph shows the relative gene expression for the indicated neuroendocrine differentiation genes in 22Rv1 cells treated with rapamycin (1 μM) and/or SFRP1 (0.1 ug/mL) for 72 hours, n = 3. * indicates significant gene expression compared to control. For all, error bars are mean +/− SD, and p values of less than 0.05 were considered statistically significant (**P<0.01, ***P<0.001, ****P<0.0001).
Figure 5.
Figure 5.. Antagonizing the androgen axis increases CD105 with elevated neuroendocrine differentiation.
(A) CD105 expression in human epithelial (22Rv1) and wild-type mouse prostatic fibroblastic cells in a 3D co-culture model is regulated by enzalutamide treatment, as determined by FACS analysis, n = 3. (B) Epithelial proliferation of prostatic epithelia 22Rv1, C4–2B, and PC3 was determined by FACS analysis for Ki67+ cells in the presence and absence of TRC105 (1 ug/mL) and enzalutamide (5 μM), n = 3. (C) Epithelial PSA expression is shown from a 2D co-culture of 22Rv1 with wild-type mouse prostatic fibroblasts after a 16 hour treatment with indicated enzalutamide doses in hypoxia, n=3. (D) Epithelial proliferation of human 22Rv1, in a 3D co-culture model with mouse prostatic fibroblasts, were analyzed for double EpCAM+ and Ki67+ expression by FACS. The cultures were treated with TRC105, M1043, and/or enzalutamide for 72 hrs, n > 3. (E) Epithelial cell death of human 22Rv1, in a 3D co-culture model with mouse prostatic fibroblasts, were measured for double EpCAM+ and Annexin V+ expression by FACS. The cultures were treated with M1043 and/or enzalutamide for 72 hrs, n = 3. (F) In a PDX model, the mice were xenografted with untreated human prostatectomy tissue under the renal capsules. Tissues grew for one week and then the mice were treated with either vehicle or enzalutamide for 4 days. (G) Immunohistochemical localization of CD105, SFRP1, or Chromogranin A in benign or PCa tissues were counterstained with hematoxylin. Red letters were used to highlight positive staining in blood vessels (v), epithelia (e), and stroma (s), n > 5. Scale bar represents 100 μm. For all, error bars are mean +/− SD, and p values of less than 0.05 were considered statistically significant (*P<0.05, **P<0.01, ***P<0.001, ****P<0.0001).
Figure 6.
Figure 6.. Antagonizing the androgen axis and CD105 reduced tumor growth and neuroendocrine differentiation.
(A) Mice were orthotopically grafted with tissue recombinants of 22Rv1 and CAF. The mice were castrated, treated with TRC105, and/or enzalutamide. Bar graph shows tumor volumes normalized to castrated (Cx) mice. (B) H&E staining was followed by immune-localization for phosphorylated-histoneH3 (P-HisH3), TUNEL, and chromogranin A (CHGA). Scale bar represents 32 μm. (C) The scatter plots show the mitotic (PHis-H3), cell death (TUNEL), and chromogranin A positive staining indexes, mean +/− SD, n > 5. For all, error bars are mean +/− SD, and p values of less than 0.05 were considered statistically significant (*P<0.05, **P<0.01, ***P<0.001, ****P<0.0001).
Figure 7.
Figure 7.. Antagonizing the androgen axis increases CD105 and SFRP1 expression with elevated neuroendocrine differentiation.
Diagram shows the evolution of prostate cancer stroma and epithelia. Castrate sensitive prostate cancer epithelia (blue top layer of cells) and stromal fibroblasts (bottom elongated layer of gray and CD105+ red cells) are both initially heterogeneous. After treatment with ADT, the epithelia and stroma express more CD105 (red). ADT induces SFRP1 secretion by fibroblasts that signal to the adjacent epithelia to induce neuroendocrine differentiation. The combined treatment with ADT and CD105 inhibition via TRC105 resulted in SFRP1 downregulation and reduced epithelial neuroendocrine differentiation in promoting castrate sensitivity.

References

    1. Bhowmick NA, Chytil A, Plieth D, Gorska AE, Dumont N, Shappell S et al. TGF-beta signaling in fibroblasts modulates the oncogenic potential of adjacent epithelia. Science 2004; 303: 848–851. - PubMed
    1. Ayala G, Tuxhorn JA, Wheeler TM, Frolov A, Scardino PT, Ohori M et al. Reactive stroma as a predictor of biochemical-free recurrence in prostate cancer. Clin Cancer Res 2003; 9: 4792–4801. - PubMed
    1. Hayward SW, Wang Y, Cao M, Hom YK, Zhang B, Grossfeld GD et al. Malignant transformation in a nontumorigenic human prostatic epithelial cell line. Cancer Res 2001; 61: 8135–8142. - PubMed
    1. Olumi AF, Grossfeld GD, Hayward SW, Carroll PR, Tlsty TD, Cunha GR. Carcinoma-associated fibroblasts direct tumor progression of initiated human prostatic epithelium. Cancer Res 1999; 59: 5002–5011. - PMC - PubMed
    1. Gleave M, Hsieh JT, Gao CA, von Eschenbach AC, Chung LW. Acceleration of human prostate cancer growth in vivo by factors produced by prostate and bone fibroblasts. Cancer Res 1991; 51: 3753–3761. - PubMed

Publication types

MeSH terms