. 2019 Feb;38(6):838-851.
doi: 10.1038/s41388-018-0462-2. Epub 2018 Sep 3.

Reduced Arginyltransferase 1 is a driver and a potential prognostic indicator of prostate cancer metastasis

Affiliations

Reduced Arginyltransferase 1 is a driver and a potential prognostic indicator of prostate cancer metastasis

Michael D Birnbaum et al. Oncogene. 2019 Feb.

Abstract

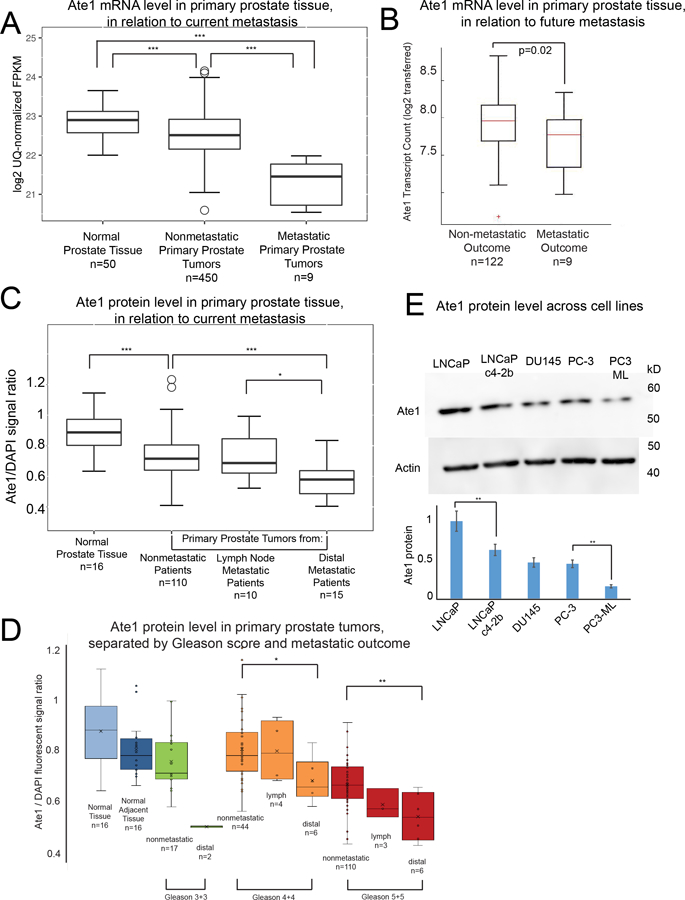
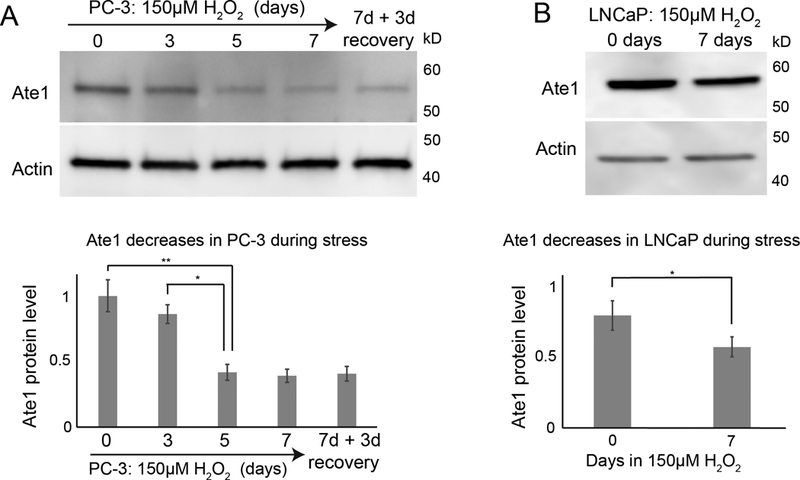
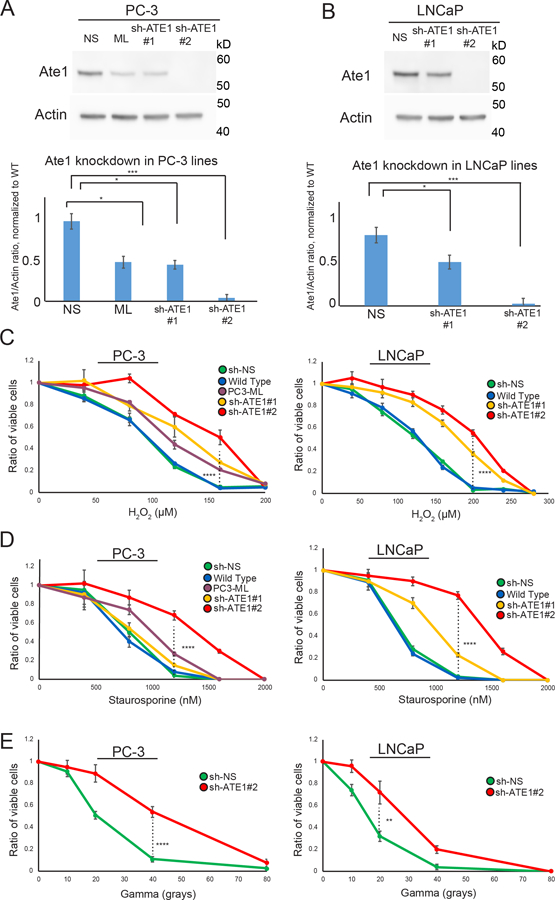
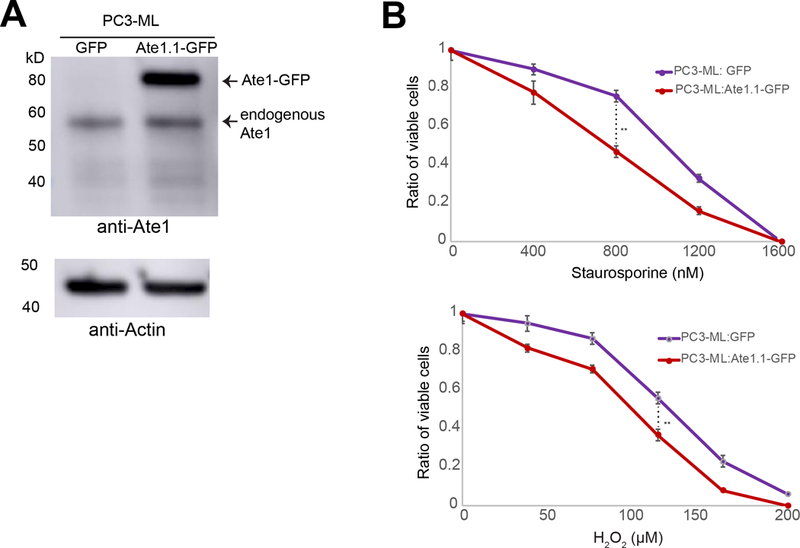
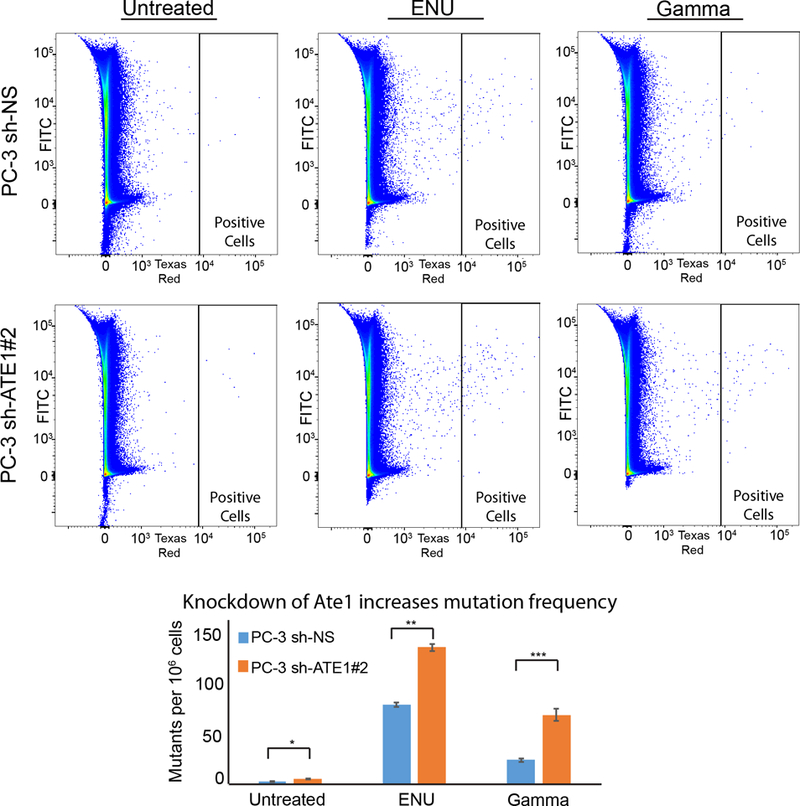
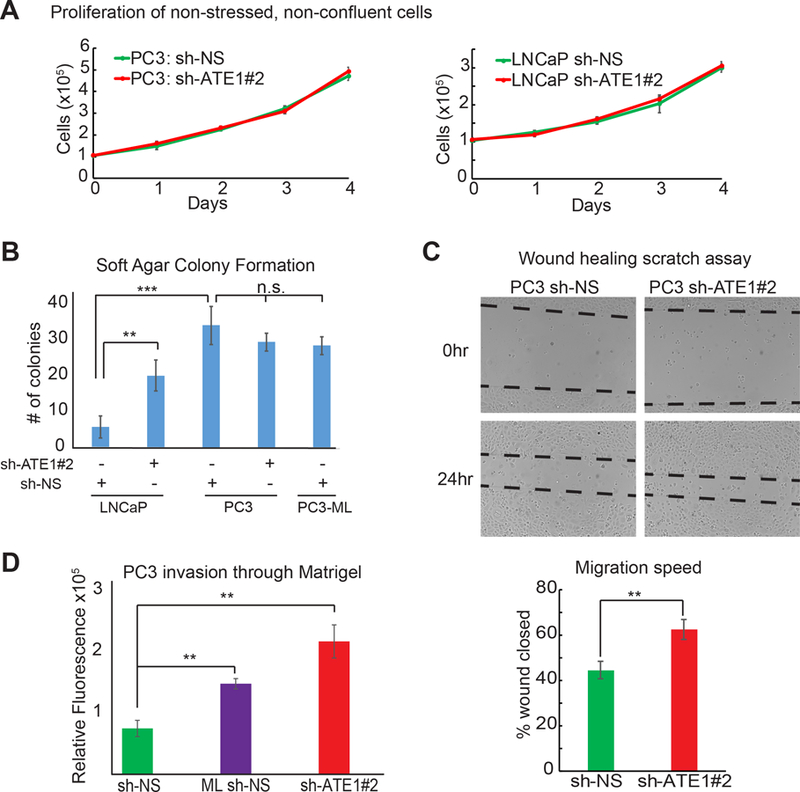
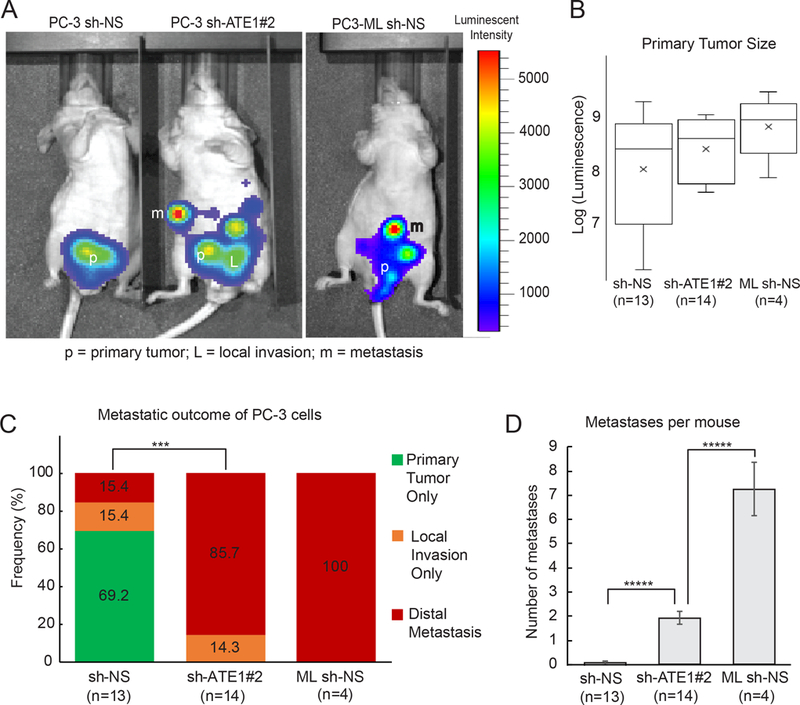
Most prostate cancer cases remain indolent for long periods of time, but metastatic progression quickly worsens the prognosis and leads to mortality. However, little is known about what promotes the metastasis of prostate cancer and there is a lack of effective prognostic indicators, making it immensely difficult to manage options for treatment or surveillance. Arginyltransferase 1 (Ate1) is the enzyme mediating post-translational protein arginylation, which has recently been identified as a master regulator affecting many cancer-relevant pathways including stress response, cell cycle checkpoints, and cell migration/adhesion. However, the precise role of Ate1 in cancer remains unknown. In this study, we found the occurrence of metastasis of prostate cancer is inversely correlated with the levels of Ate1 protein and mRNA in the primary tumor. We also found that metastatic prostate cancer cell lines have a reduced level of Ate1 protein compared to non-metastatic cell lines, and that a depletion of Ate1 drives prostate cancer cells towards more aggressive pro-metastatic phenotypes without affecting proliferation rates. Furthermore, we demonstrated that a reduction of Ate1 can result from chronic stress, and that shRNA-reduced Ate1 increases cellular resistance to stress, and drives spontaneous and stress-induced genomic mutations. Finally, by using a prostate orthotropic xenograft mouse model, we found that a reduction of Ate1 was sufficient to enhance the metastatic phenotypes of prostate cancer cell line PC-3 in vivo. Our study revealed a novel role of Ate1 in suppressing prostate cancer metastasis, which has a profound significance for establishing metastatic indicators for prostate cancer, and for finding potential treatments to prevent its metastasis.


Conflict of interest statement

Competing Interests

The authors have no competing interests to declare.

Figures

Figure 1:
Figure 1:. Reduced Ate1 levels are associated with the metastatic outcome of human prostate cancer and increased aggressiveness in prostate cancer cell lines.
(A) Box and whisker graph showing mRNA level in Fragments per Kilobase of transcript per million mapped reads (FPKM) of Ate1 in primary tumors from patients with metastatic or non-metastatic status in comparison to normal prostate tissue. The data for mRNA were retrieved from the TCGA-PRAD dataset as well as the Beltran dataset (36). The mRNA levels were assessed by RNA sequencing in these databases. See Supp. Fig. S1 for additional information on the normalization protocol. (B) Analysis of dataset of RNA level examined by microarray in excised primary prostate cancer tissue mRNA that had up to 5 years of patient follow-up after time of radical prostatectomy (20). Samples were separated into groups by patient outcome (metastatic or not) to determine the relationship between future metastatic outcome and the Ate1 mRNA levels in the primary tumors. (C) Quantification of Ate1 protein levels on human primary prostate tumor sites by immunohistochemistry, with DAPI staining for loading normalization with DNA. The analysis was performed on human prostate cancer arrays containing primary prostate tumors with either metastatic or non-metastatic outcome, as well as normal (non-diseased) prostate tissues. The samples were separately grouped by the patient outcome (metastatic or non-metastatic) for analysis. (D) Protein level of Ate1 in tissue samples from C were further stratified by Gleason Score and metastatic outcomes. See also Supp. Fig. S2 for representative images. (E) A representative Western blot showing protein levels of Ate1 in multiple human prostate cancer cell lines, including androgen-dependent and indolent cell line LNCaP, its castration-resistant derivative LNCaP c4–2b cells, castration-resistant and intermediate aggressive cell lines DU145 and PC3, and the castration-resistant and highly aggressive PC3-ML, a derivative of PC3. Actin was used as a loading control. The graph shows the quantification from 3 independent repeats, showing a trend of reduced Ate1 correlating with cell line progression and aggressive phenotypes. Statistical significance was assessed with two-tailed Mann-Whitney U test for the human samples, and with the Student’s t-test for cell-based data. * = p<0.05, ** = p<0.01, *** = p<0.001. The monoclonal Ate1 antibody (clone 6F11, Millipore) used in this study has been shown to be highly specific for Western blot and IHC(30, 40). See also Supp. Fig. S3 for additional data demonstrating the specificity of this antibody.
Figure 2:
Figure 2:. Ate1 is downregulated following chronic stress.
(A) Top panel is a representative Western blot showing the level of Ate1 for PC-3 cells treated with culture media supplemented with 150 μM H2O2 for 7 days then allowed to recover for 3 days in normal media. For matching time points, the “0”-treatment group was treated with H2O through the time course. Actin was used as loading control. Bottom graph shows quantification from three independent repeats. (B) LNCaP cells were treated with 150 μM H2O2 or H2O control for 7 days and Ate1 levels were measured by Western blot. Actin was used as loading control. Bottom graph shows quantification from three independent repeats. Error bars represent Standard Error of Mean (SEM). Statistical significance based on p value from the Student’s t-test: * = p<0.05, ** = p<0.01.
Figure 3:
Figure 3:. Ate1 reduction in prostate cancer cells promotes stress resistance.
(A) Top panel shows representative Western blot of Ate1 and actin (loading control) for PC-3 cells, which were stably infected with two different shRNAs (#1 and #2) targeting Ate1, or the nonsilencing control. PC3-ML cells, which have naturally lower level of Ate1 compared to the parental PC3 cells, were used as another control. Bottom panel shows quantification from three independent repeats, showing that sh-ATE1#1 has 40–60% efficiency, while #2 has >95% efficiency. For this reason #2 is used for knockdown of Ate1 through this study unless otherwise specified. (B) Similarly as done in (A), Western blots and their corresponding quantifications were presented for LNCaP (C) PC-3 and LNCaP cells either transduced with shRNA against Ate1 or non-silencing control or non-transduced were treated with various doses of H2O2 or Staurosporine for 12 hours, or a single dose of Gamma irradiation followed by 24 hours of recovery, then assessed for cell viability via Calcein AM staining. Graphs showing quantification from three independent experiments. Error bars represent SEM. Statistical significance of group comparison at select data points were assessed with the Student’s t-test: * = p<0.05, *** = p<0.001. See also Supp. Fig. S4 for similar effects of Ate1 reduction on STS and gamma irradiation for human foreskin fibroblasts (HFF), a non-tumorigenic primary cell line.
Figure 4:
Figure 4:. Ate1 overexpression in prostate cancer cells reduces stress resistance.
(A) Representative western blot of PC3-ML cells expressing Ate1-GFP. For the construction of recombinant protein, Ate1 is represented by isoform 1 (Ate1.1), the most potent and ubiquitous splice variant of Ate1. It was fused with a C-terminal GFP and cloned into a retroviral vector pBABE-puro for low-level expression in mammalian cells, which is fully functional and not expected to cause cell death as shown by previous reports(4, 30). The expression of GFP alone was used as a control. (B) PC3-ML cells transduced with Ate1.1-GFP or GFP control were treated with various doses of H2O2 or Staurosporine for 12 hours, then assessed for cell viability via Calcein AM staining. Graphs showing quantification from three independent experiments. Error bars represent SEM. Statistical significance of group comparison at select data points were assessed with the Student’s t-test: ** = p<0.01.
Figure 5:
Figure 5:. Ate1 reduction increases spontaneous and stress-induced mutagenesis in PC-3 cells.
(A) Representative flow diagrams of PC-3 cells carrying CherryOFF-GFP reporter and pLKO.1-puro shRNA targeting Ate1 (shRNA #2) or NS control are shown. Cells were either treated with 3mM ENU for 24 hours, or irradiated with 10Gy of gamma radiation. 72 hours after the initiation of treatments, cells were analyzed by FACS for the acquired mutations that activate the mCherryFP fluorescence (indicated in the window of “Positive Cells”). (B) Quantification of A from three independent repeats shows the changes of mutation rates with the knockdown of Ate1. Error bars represent SEM. Statistical significances of the two-group comparison were assessed with the Student’s t-test: * = p<0.05, ** = p<0.01, *** = p<0.001.
Figure 6:
Figure 6:. Ate1 reduction increases soft-agar colony formation, migration, and invasion in prostate cancer cells without affecting proliferation rates.
(A) Cell proliferation curves of PC-3 and LNCaP cells expressing shRNA targeting Ate1 (shRNA #2) or NS control are shown. These cells were plated in 10-cm dishes at low density and grown for 4 days without reaching confluency. Viable cells were treated with Calcein AM dye and counted. (B) Graph shows numbers of colonies formed after 2 weeks in soft agar suspensions on 35mm dishes by LNCaP and PC-3 cells expressing sh-ATE1#2 or NS control. Three independent experiments were performed. (C) Left side is the representative photos of PC-3 cells expressing shRNA targeting Ate1 (shRNA #2) or NS control in the wound healing migration assay, before and after 24 hours incubation. The dashed lines indicate edges of the cell wound. Right side is the quantification from three independent experimental repeats. (D) Quantification of cell invasion through Matrigel in Boyden chamber is shown from PC-3 cells expressing shRNA targeting Ate1 (shRNA #2) or NS control. PC3-ML, which is known to be more invasive than PC3, is used as a positive control. The experiment was repeated three times. All error bars represent SEM. Statistical significance based on the Student’s t-test: ** = p<0.01, *** = p<0.001. See also Supp. Fig. S6 for the effects of Ate1 over-expression in PC3-ML on cell migration and Matrigel invasion.
Figure 7:
Figure 7:. Ate1 reduction drives metastasis of prostate orthotopic xenograft in mice.
(A) Representative photo of luminescence detection of mouse tumors, 40 days after orthotopic injection of PC-3 and PC3-ML cells into the dorsal prostates of nude mice. The PC3 cells were transduced shRNA targeting Ate1 (shRNA #2) or NS control, and also transduced with luciferase as a tracing marker. PC3-ML, which has been shown to metastasize following orthotopic xenograft (27) was used as a positive control and transduced with NS control shRNA and luciferase. Arrows point to a few remote metastatic sites in these mice. (B) Quantification of primary tumor burden in these mice at the termination of the study was determined by bioluminescent signal count. No statistical significance was found. (C) Percentage of mice containing either only primary tumor, or with local invasion, or distal metastasis by these different cell lines is shown. Statistical significance was assessed by the Fisher’s exact test. *** = p<0.001. (D) Quantification of the average number of distal metastases per mouse. Error bars represent SEM. Statistical significance based on the Student’s t-test: **** = p<0.0001. See also Supp Fig. S7 for representative H&E stained images for the morphology of primary and metastatic tumors, as well as the distribution of the metastatic locations, formed by these above mentioned cells.

References

    1. Torre LA, Siegel RL, Ward EM, Jemal A. Global Cancer Incidence and Mortality Rates and Trends--An Update. Cancer epidemiology, biomarkers & prevention : a publication of the American Association for Cancer Research, cosponsored by the American Society of Preventive Oncology 2016;25(1):16–27. Epub 2015/12/17. - PubMed
    1. Jiang WG, Sanders AJ, Katoh M, Ungefroren H, Gieseler F, Prince M, et al. Tissue invasion and metastasis: Molecular, biological and clinical perspectives. Seminars in Cancer Biology 2015;35(Supplement):S244–S75. - PubMed
    1. Klein CA. Selection and adaptation during metastatic cancer progression. Nature 2013;501(7467):365–72. Epub 2013/09/21. - PubMed
    1. Kumar A, Birnbaum MD, Patel DM, Morgan WM, Singh J, Barrientos A, et al. Posttranslational arginylation enzyme Ate1 affects DNA mutagenesis by regulating stress response. Cell death & disease 2016;7(9):e2378 Epub 2016/09/30. - PMC - PubMed
    1. Eisenach PA, Schikora F, Posern G. Inhibition of arginyltransferase 1 induces transcriptional activity of myocardin-related transcription factor A (MRTF-A) and promotes directional migration. The Journal of biological chemistry 2014;289(51):35376–87. Epub 2014/11/09. - PMC - PubMed

Publication types