. 2019 Feb;38(6):852-867.
doi: 10.1038/s41388-018-0470-2. Epub 2018 Sep 3.

TPX2/Aurora kinase A signaling as a potential therapeutic target in genomically unstable cancer cells

Affiliations

TPX2/Aurora kinase A signaling as a potential therapeutic target in genomically unstable cancer cells

Stephanie E van Gijn et al. Oncogene. 2019 Feb.

Abstract

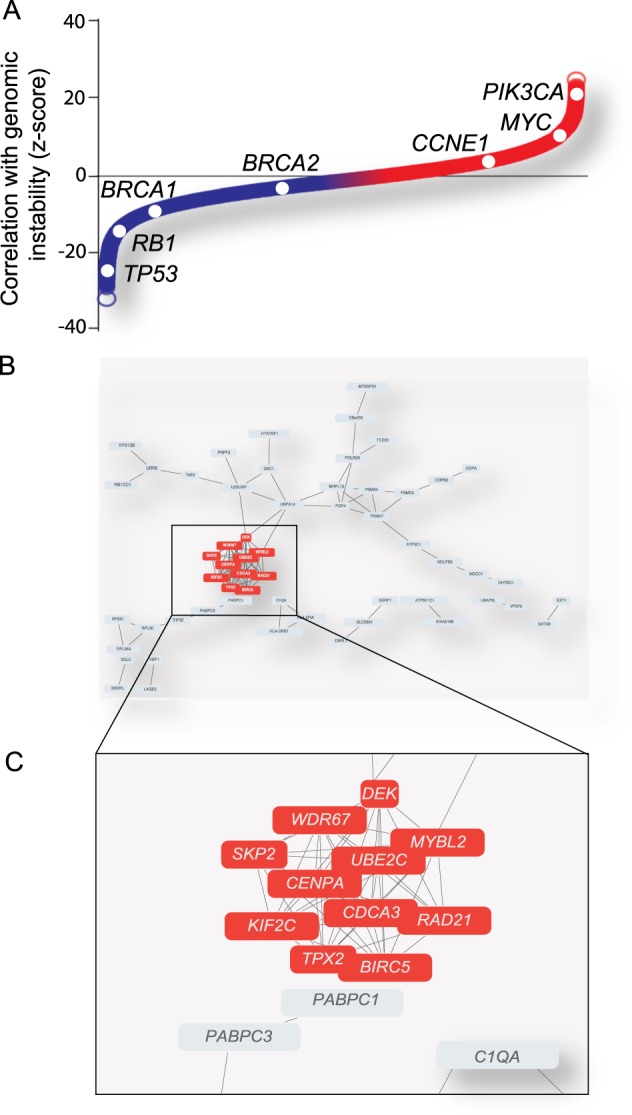
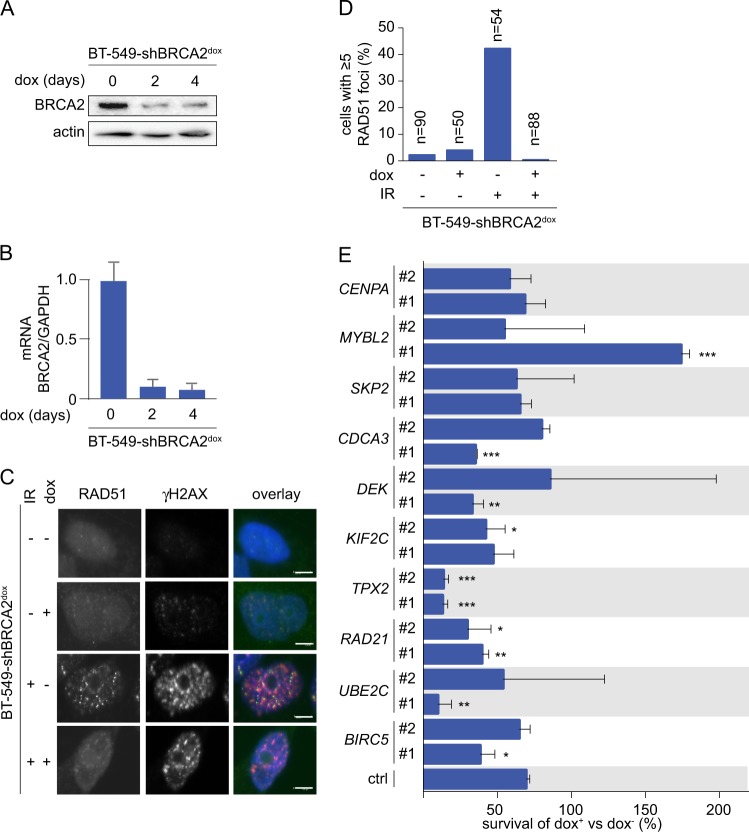
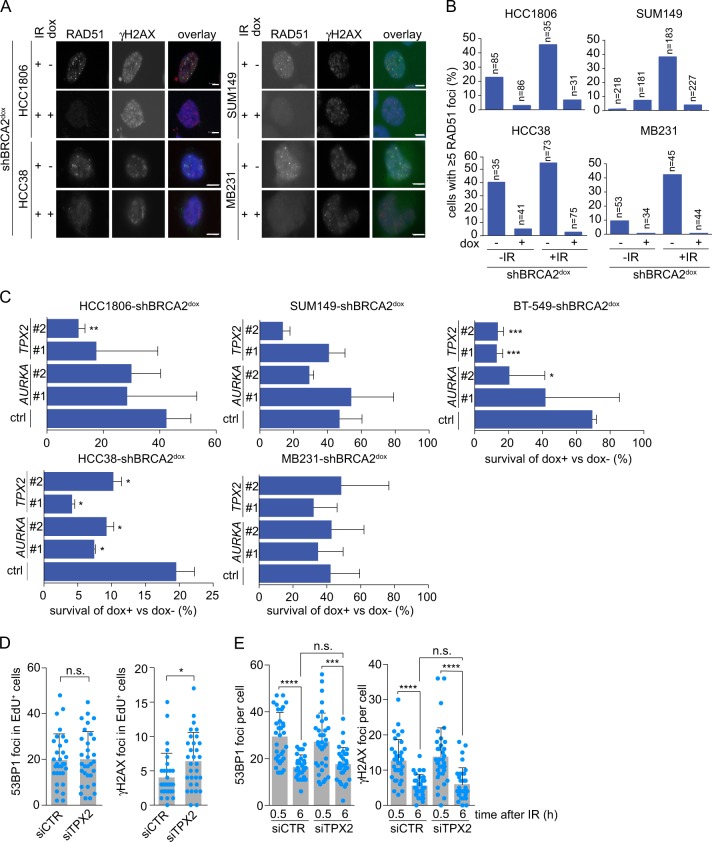
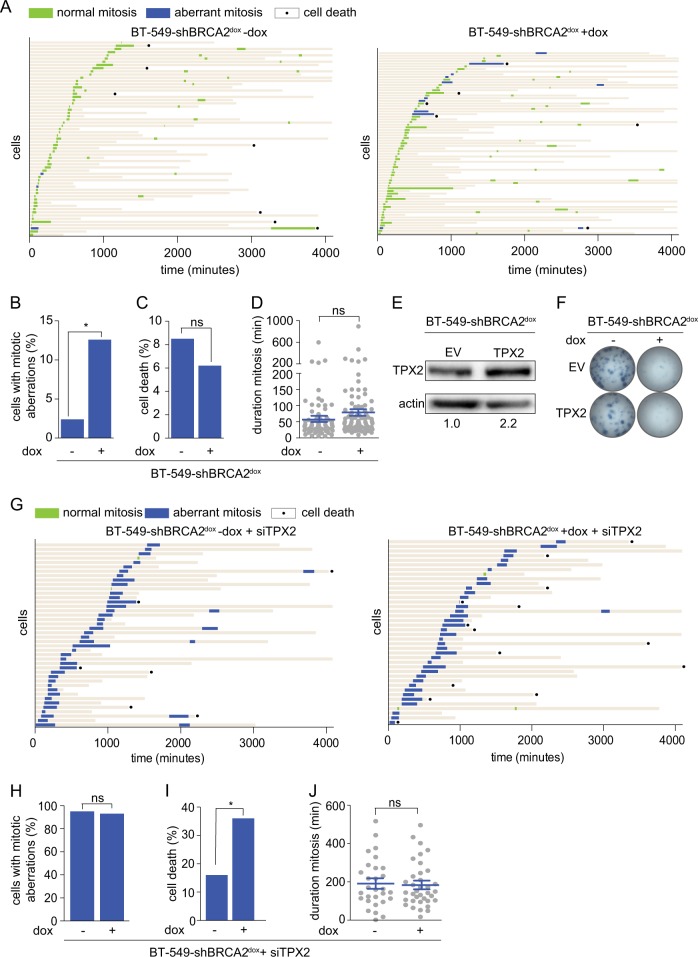
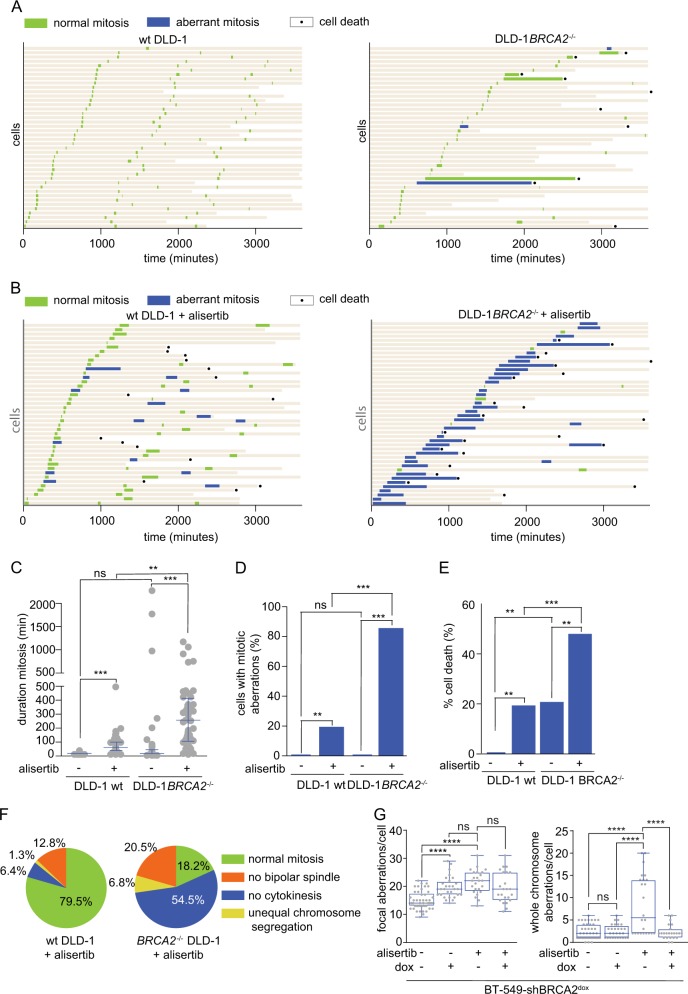
Genomic instability is a hallmark feature of cancer cells, and can be caused by defective DNA repair, for instance due to inactivation of BRCA2. Paradoxically, loss of Brca2 in mice results in embryonic lethality, whereas cancer cells can tolerate BRCA2 loss. This holds true for multiple DNA repair genes, and suggests that cancer cells are molecularly "rewired" to cope with defective DNA repair and the resulting high levels of genomic instability. In this study, we aim to identify genes that genomically unstable cancer cells rely on for their survival. Using functional genomic mRNA (FGmRNA) profiling, 16,172 cancer samples were previously ranked based on their degree of genomic instability. We analyzed the top 250 genes that showed a positive correlation between FGmRNA levels and the degree of genomic instability, in a co-functionality network. Within this co-functionality network, a strong cluster of 11 cell cycle-related genes was identified, including TPX2. We then assessed the dependency on these 11 genes in the context of survival of genomically unstable cancer cells, induced by BRCA2 inactivation. Depletion of TPX2 or its associated kinase Aurora-A preferentially reduced cell viability in a panel of BRCA2-deficient cancer cells. In line with these findings, BRCA2-depleted and BRCA2-mutant human cell lines, or tumor cell lines derived from Brca2-/-;p53-/- mice showed increased sensitivity to the Aurora-A kinase inhibitor alisertib, with delayed mitotic progression and frequent mitotic failure. Our findings reveal that BRCA2-deficient cancer cells show enhanced sensitivity to inactivation of TPX2 or its partner Aurora-A, which points at an actionable dependency of genomically unstable cancers.


Conflict of interest statement

The authors declare that they have no conflict of interest.

Figures

Fig. 1
Fig. 1
Identification of a cluster of genes of which individual gene expression associates to the degree of genomic instability. a Ranked associations of mRNA expression of individual genes and their association to the degree of genomic instability (z-scores). b, c Co-functionality analysis based on similar biological processes of the top 250 genes (b), of which expression is positively associated with genomic instability, revealed a cluster of 11 genes (correlation coefficient > 0.5) (c)
Fig. 2
Fig. 2
TPX2 depletion preferentially affects cell viability in BRCA2-deficient cancer cells. a BT-549-shBRCA2dox cells were left untreated or were treated with doxycycline (2 or 4 days), and subsequently harvested for western blotting for BRCA2 and actin. b BT-549-shBRCA2dox cells were treated as in panel A, and mRNA expression levels of BRCA2 were analyzed relative to GAPDH using qRT-PCR. c BT-549-shBRCA2dox cells were grown on coverslips and treated with doxycycline (3 days) and/or irradiated (IR, 5 Gy) as indicated. At 3 h after irradiation, cells were fixed and analyzed for RAD51 and γH2AX foci formation. Scale bars represent 5 μm. d Percentages of cells with ≥5 RAD51 foci per nucleus are indicated. (n ≥ 50 per condition). e BT-549-shBRCA2dox cells were treated with doxycycline (3 days) and were subsequently transfected with indicated siRNAs. A total of 30,000 cells were plated 48 h following transfection. Viable cells were counted 5 days later. Percentages of cell survival of doxycycline-treated vs untreated cells are depicted. Error bars indicate standard deviations of two experimental replicates. Unpaired two-tailed t tests were used to test for statistical significance (*p ≤ 0.05, **p ≤ 0.01, ***p ≤ 0.001)
Fig. 3
Fig. 3
Depletion of TPX2 or Aurora-A reduces cell viability of BRCA2-deficient breast cancer cells. a HCC1806-shBRCA2dox, HCC38-shBRCA2dox, SUM149-shBRCA2dox, and MB231-shBRCA2dox were grown on coverslips and treated with doxycycline (3 days) and/or irradiated (IR, 5 Gy) as indicated. Subsequently, cells were stained for RAD51 and γH2AX. Scale bars represent 5 μm. b Quantification of results from a. Percentages of cells with ≥5 RAD51 foci per nucleus are indicated (n ≥ 31). c Percentages of cell survival of doxycycline-treated cells vs untreated cells, transfected with indicated siRNAs. Unpaired two-tailed t tests were used to test for statistical significance (*p ≤ 0.05, **p ≤ 0.01, ***p ≤ 0.001). d BT-549 cells were transfected with siTPX2 or control siRNA (CTR). Cells were grown on coverslips for 3 days after which they were incubated with EdU conjugated to azide-Alexa 488 (10 μM) for 15 min. Subsequently, cells were fixed and stained for 53BP1 and γH2AX. Amounts of 53BP1 and γH2AX foci per cell of at least 30 EdU-positive cells were counted. Means and standard deviations are depicted. Mann–Whitney U tests were used to analyze statistical significance (*p ≤ 0.05, ** = p ≤ 0.01, ***p ≤ 0.001, ns not significant). e BT-549 cells were transfected as in d, irradiated (IR, 5 Gy), and fixated 0.5 or 6 h after irradiation. Amounts of 53BP1 and γH2AX foci per cell were counted. Means and standard deviations are depicted. Mann–Whitney U tests were used to analyze statistical significance (*p ≤ 0.05, **p ≤ 0.01, ***p ≤ 0.001, ns = not significant)
Fig. 4
Fig. 4
Depletion of TPX2 leads to aberrant mitoses. a BT-549-shBRCA2dox cells, stably expressing H2B–GFP were treated with doxycycline (24 h), and subsequently followed with live-cell microscopy for 65 h. The left panel represents untreated cells, the right panel represents doxycycline-treated cells. Each bar represents a single cell: green bars indicate normal mitoses, blue bars indicate cells with aberrant mitoses, and black dots indicate cell death. b Percentages of BT-549-shBRCA2dox cells, left untreated or treated with doxycycline, that showed aberrant mitoses (unpaired two-tailed t test, p = 0.03). c Percentages of BT-549-shBRCA2dox cells, left untreated or treated with doxycycline, that died (unpaired two-tailed t test, p = 0.56). d Duration of mitosis in BT-549-shBRCA2dox cells, treated with or without doxycycline. Means and standard errors of the mean are depicted (unpaired two-tailed t test, p = 0.12). e BT-549-shBRCA2dox cells were infected with pBabe-EV or pBabe-TPX2, and immunoblotted for TPX2 and actin. f Clonogenic survival assay of BT-549-shBRCA2dox cells, infected with pBabe-EV or pBabe-TPX2, and treated with or without doxycycline as indicated. g BT-549-shBRCA2dox cells were transfected with TPX2 siRNA and treated with doxycycline or left untreated, and were followed with live-cell microscopy for 65 h. Each bar represents a single cell: green bars indicate normal mitoses, blue bars indicate cells with aberrant mitoses, and black dots indicate cell death. h Percentages of mitotic aberrations in BT-549-shBRCA2dox cells transfected with TPX2 siRNA and treated with or without doxycycline (unpaired two-tailed t test, p = 0.58). i Percentages of cell death after mitosis in BT-549-shBRCA2dox cells, transfected with TPX2 siRNA and treated with or without doxycycline (unpaired two-tailed t test, p = 0.02). j Duration of mitosis in BT-549-shBRCA2dox cells transfected with TPX2 siRNA, and treated with or without doxycycline. Means and standard errors of the mean are depicted (unpaired two-tailed t test, ns not significant)
Fig. 5
Fig. 5
BRCA2-mutant cancer cells are differentially sensitive to Aurora-A inhibition. a BT-549 cells were left untreated or treated with 200 and 1000 nM of alisertib for 24 h. Cells were fixed and co-stained for pHH3, MPM2, and DNA was stained using propidium iodide. Cells were analyzed by flow cytometry. Percentages of cells stained positive for pHH3 and MPM2 are quantified. b Mouse mammary tumor cells were treated with indicated concentrations of alisertib. Results of three replicates were analyzed using ANOVA with Bonferroni post test, p < 0.05 at 200 nM. c Mouse mammary tumor cells were treated continuously with alisertib, and clonogenic cell survival was assessed. d Quantifications of colony numbers of three independent experiments as performed in c. Statistical analysis was done using ANOVA with Bonferroni post test, p < 0.01 at 100 nM. e Percentages of cell survival of BRCA2–/– DLD-1 vs wt DLD-1 cells after transfection with siRNAs (unpaired two-tailed t test, TPX2: #1 p = 0.0006, #2 p = 0.0007, AURKA: #1 p = 0.0034, and for #2 p = 0.0026). f wt and BRCA2–/– DLD-1 cells were treated with indicated concentrations of alisertib and clonogenic survival was assessed. g Quantifications of colony numbers of three independent experiments as performed in g. Statistical analysis was done using ANOVA with Bonferroni post test, p < 0.001 at 20 nM and, p < 0.01 at 40 nM
Fig. 6
Fig. 6
Depletion of Aurora-A impedes cytokinesis and is preferentially cytotoxic in BRCA2-deficient cells. a wt and BRCA2–/– DLD-1 cells stably expressing H2B–GFP were followed with live-cell microscopy for 65 h. The left panel shows the mitotic behavior of wt DLD-1 cells and the right panel the mitotic behavior of BRCA2–/– DLD-1 cells. Each bar represents a single cell: green bars indicate normal mitoses, blue bars indicate aberrant mitoses, and cell death is indicated with a black dot. b wt and BRCA2–/– DLD-1 cells stably expressing H2B–GFP and treated with 200 nM alisertib. Graph depictions are similar as in a. c Quantification of the duration of mitosis of wt and BRCA2–/– DLD-1 cells treated with 200 nM alisertib or untreated. The median with interquartile range is depicted. Significance was tested with a Kruskal–Wallis test with Dunn’s multiple comparisons, *p ≤ 0.05, **p ≤ 0.01, ***p ≤ 0.001, ns not significant. d Percentages of wt and BRCA2–/– DLD-1 cells treated with 200 nM alisertib or not, with mitotic aberrations. e Percentages of wt and BRCA2–/– DLD-1 cells treated with 200 nM alisertib or left untreated, that undergo cell death (Kruskal–Wallis test with Dunn’s multiple comparisons, *p ≤ 0.05, **p ≤ 0.01, ***p ≤ 0.001, ns not significant). f Pie charts with the different types of mitotic aberrations in wt and BRCA2–/– DLD-1 cells treated with 200 nM alisertib. g BT-549-shBRCA2dox cells were pretreated for 3 days with doxycycline and treated with alisertib for an additional 2 days. Cells were single-cell sorted and whole-genome sequenced. The number of focal aberrations and the number of whole-chromosome aberrations per cell were counted. Medians with interquartile range are depicted and statistical analyses were performed using a Kruskal–Wallis test with Dunn’s multiple comparisons, *p ≤ 0.05, **p ≤ 0.01, ***p ≤ 0.001, ns not significant

References

    1. Buccitelli C, Salgueiro L, Rowald K, Sotillo R, Mardin BR, Korbel JO. Pan-cancer analysis distinguishes transcriptional changes of aneuploidy from proliferation. Genome Res. 2017;27:501–11. doi: 10.1101/gr.212225.116. - DOI - PMC - PubMed
    1. Fehrmann RSN, Karjalainen JM, Krajewska M, Westra HJ, Maloney D, Simeonov A, et al. Gene expression analysis identifies global gene dosage sensitivity in cancer. Nat Genet. 2015;47:115–25. doi: 10.1038/ng.3173. - DOI - PubMed
    1. Shah SP, Roth A, Goya R, Oloumi A, Ha G, Zhao Y, et al. The clonal and mutational evolution spectrum of primary triple-negative breast cancers. Nature. 2012;486:395–9. doi: 10.1038/nature10933. - DOI - PMC - PubMed
    1. Cancer Genome Atlas Network. Comprehensive molecular portraits of human breast tumours. Nature. 2012;490:61–70. doi: 10.1038/nature11412. - DOI - PMC - PubMed
    1. Ashworth A, Lord CJ, Reis-Filho JS. Genetic interactions in cancer progression and treatment. Cell. 2011;145:30–38. doi: 10.1016/j.cell.2011.03.020. - DOI - PubMed

Publication types

MeSH terms