. 2018 Sep 3;9(1):3554.
doi: 10.1038/s41467-018-05896-w.

Disentangling astroglial physiology with a realistic cell model in silico

Affiliations

Disentangling astroglial physiology with a realistic cell model in silico

Leonid P Savtchenko et al. Nat Commun. .

Erratum in

Abstract

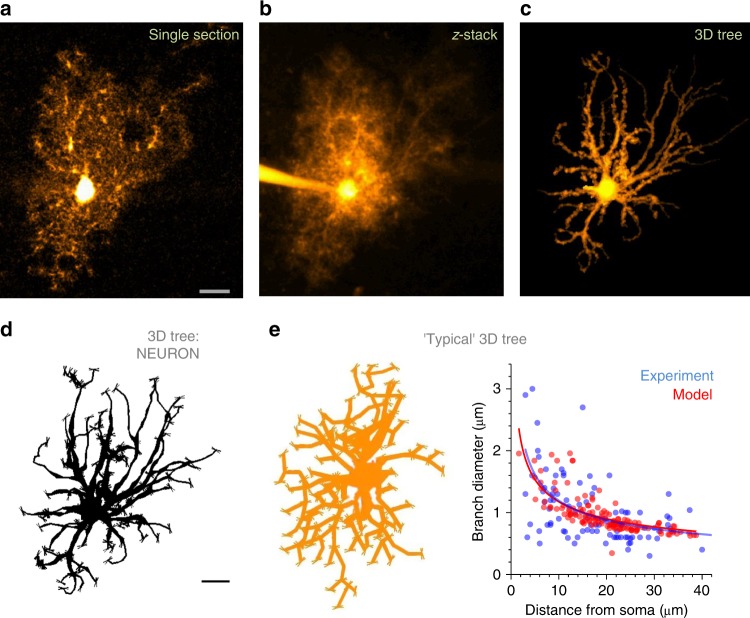
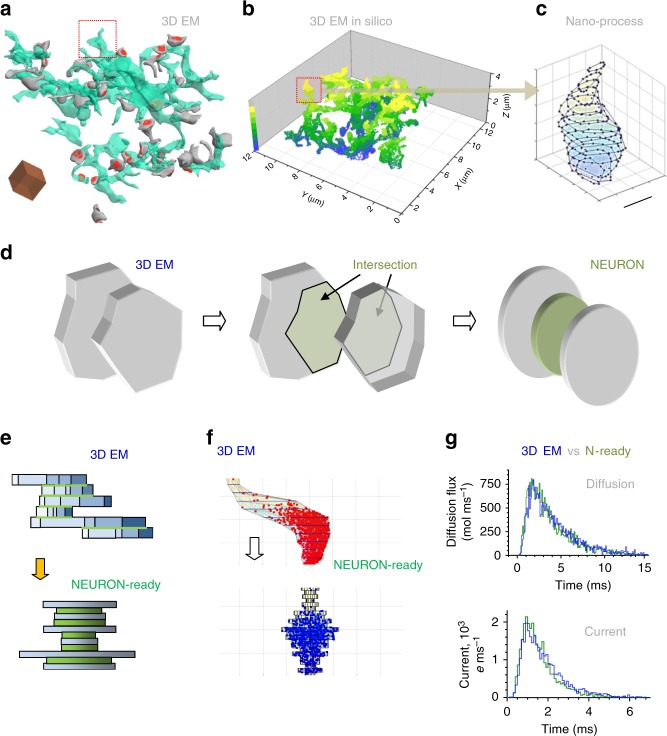
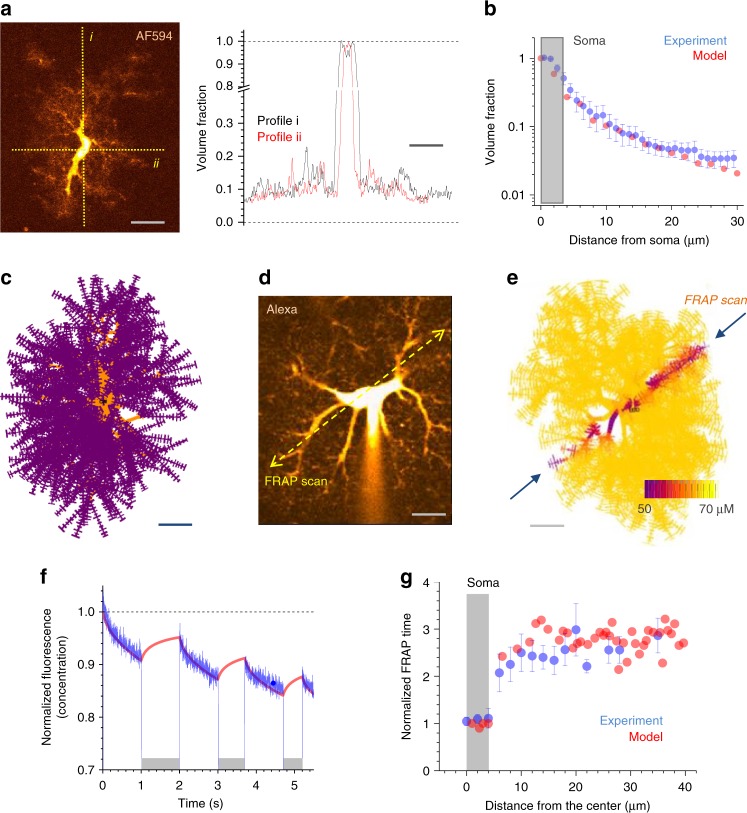
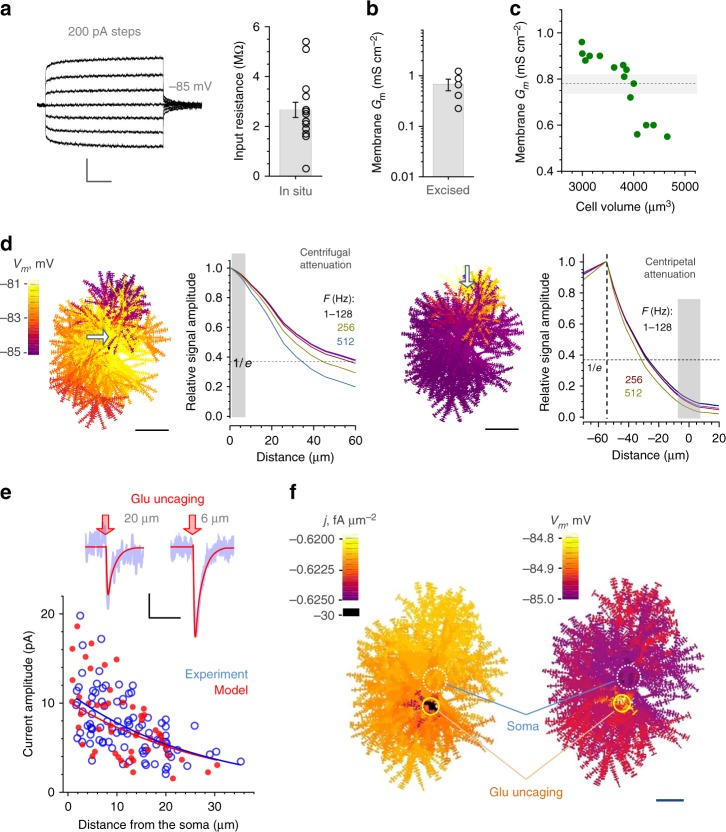
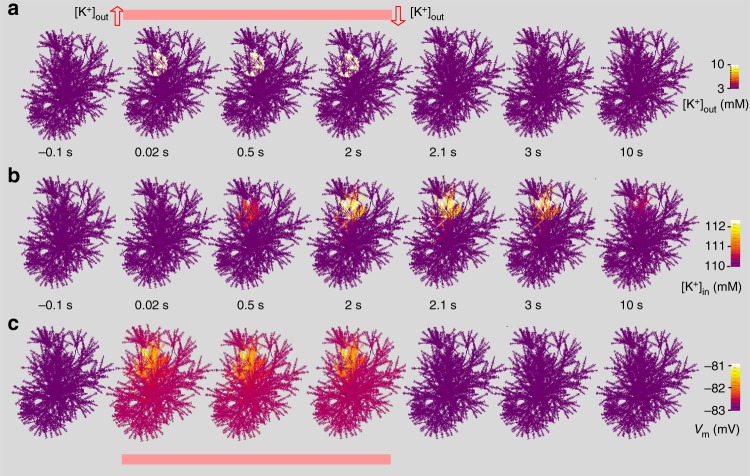
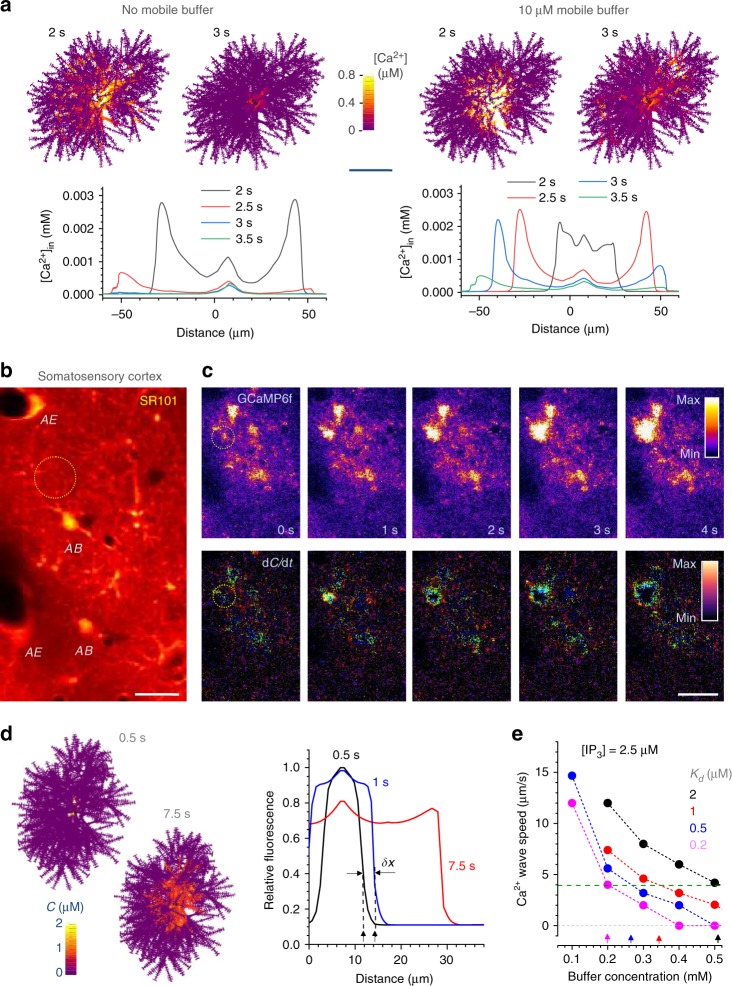
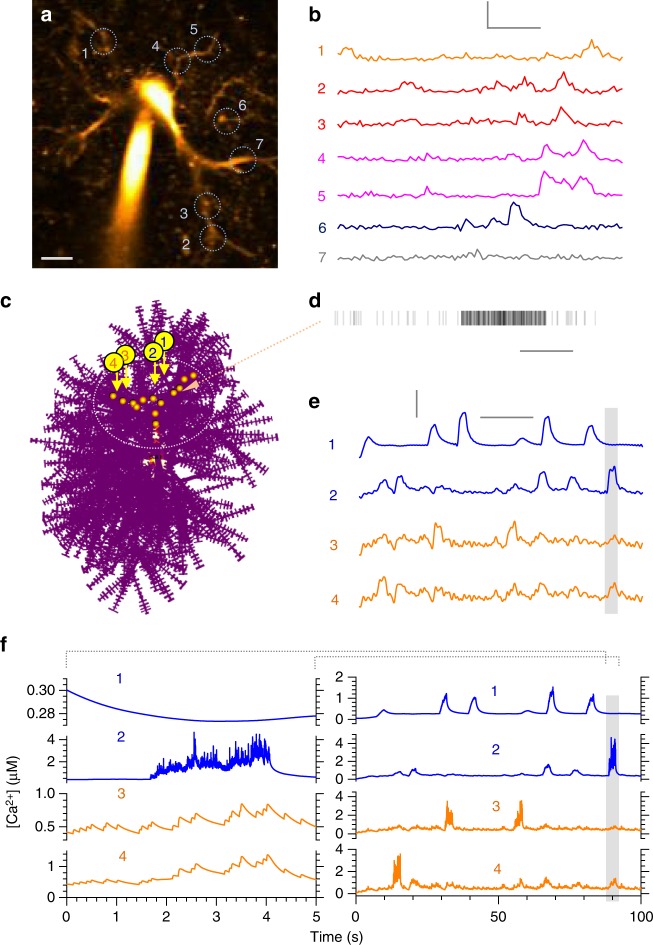
Electrically non-excitable astroglia take up neurotransmitters, buffer extracellular K+ and generate Ca2+ signals that release molecular regulators of neural circuitry. The underlying machinery remains enigmatic, mainly because the sponge-like astrocyte morphology has been difficult to access experimentally or explore theoretically. Here, we systematically incorporate multi-scale, tri-dimensional astroglial architecture into a realistic multi-compartmental cell model, which we constrain by empirical tests and integrate into the NEURON computational biophysical environment. This approach is implemented as a flexible astrocyte-model builder ASTRO. As a proof-of-concept, we explore an in silico astrocyte to evaluate basic cell physiology features inaccessible experimentally. Our simulations suggest that currents generated by glutamate transporters or K+ channels have negligible distant effects on membrane voltage and that individual astrocytes can successfully handle extracellular K+ hotspots. We show how intracellular Ca2+ buffers affect Ca2+ waves and why the classical Ca2+ sparks-and-puffs mechanism is theoretically compatible with common readouts of astroglial Ca2+ imaging.


Conflict of interest statement

The authors declare no competing interests.

Figures

Fig. 1
Fig. 1
Reconstructing astroglial stem tree in silico. a A characteristic image of CA1 astroglia, whole-cell load with Alexa Fluor 594 (λx2p = 800 nm), single optical section (stratum radiatum, depth of ~100 µm). Scale bar, 10 µm (applies to ac). b Cell as in panel a shown as a full z-stack projection. c Stem tree of astroglia shown in a and b, separated and reconstructed in 3D using NeuroTrace (Fiji ImageJ, NIH); 2D view of a 3D image. d Astrocyte stem tree shown in panel c quantified, loaded and displayed in NEURON format using Vaa3D (Allen Institute); thin ‘buds’ indicate initial seeds for ‘planting’ nanoscopic protrusions at a certain longitudinal density; 2D view. Scale bar, 10 µm (applies to d and e). e Diagram, ‘typical’ astrocyte stem tree built by modifying a library neurogliaform cell (2D view); plot, matching the branch diameters in the model (red) and in recorded astroglia (blue; n = 13 cells including 98 dendrites); solid lines, the best-fit dependence (power low, y = a ∙ xb) for the corresponding data scatters
Fig. 2
Fig. 2
Nanoscopic astroglial protrusions: from 3D EM to in silico. a 3D EM serial-section reconstruction of an astrocytic fragment (green) and adjacent dendritic spines (grey) with postsynaptic densities (red) in area CA1; surface rendering applied; dotted square, selected nano-process; Scale cube side, 1 µm. b Fragment in a shown using surface point scatter; false colour scale, z-depth as indicated; dotted square, selected nano-process, as in a. c, Selected process (highlighted in a and b) as a stack of polygonal sections (60 nm thick, to follow EM sectioning) delimited by surface points. Scale bar, 500 nm. d Transformation of the adjacent 3D EM sections (left; grey polygonal slabs with base areas Si and Si+1) with intersection area Ti (middle; green polygons) into NEURON-compatible two main (grey, ‘leaves’) and one transitional (green, ‘stalk’) cylindrical slabs with the corresponding base areas (right). e Transformation of 3D EM reconstructed processes (top) into NEURON-compatible cylinder section stacks (bottom). Individual sections (blue, top) are transformed into ‘main’ cylinders (blue, bottom), and green segments (top) depict adjacent surfaces between sections represented by green ‘transitional’ cylinders (bottom), as in d. f A characteristic example of a 3D EM reconstructed astroglial process made up by its serial polygonal sections (top) and its representation by serial cylindrical compartments (bottom). Scattered dots illustrate a snapshot of the Monte Carlo simulation test (monitored live in ASTRO; Supplementary Movie 1) in which Brownian particles are injected into the bottom of the 3D structure, and their arrival time at the top is registered, to compare molecular diffusivity (no electric field) and electrodynamic properties (2.5×10³ V m−1 electric field in the z-direction, one electron charge e = 1.6×10⁻¹⁹ C per particle applied) between the two shapes. g The outcome of Monte Carlo tests comparing two shapes shown in f, for the molecular diffusion flux (top) and ion current (bottom), measured at the top exit of the shapes (as in f), upon injection of the Brownian particles into the bottom entry (as in f); blue and green, 3D EM reconstructed and NEURON-compatible shapes, respectively. See ref. for electrodiffusion simulation detail
Fig. 3
Fig. 3
NEURON-based astrocyte model: determining volumetric quantities. a Image panel, a characteristic astrocyte in area CA1 (Alexa Fluor 594, λx2p = 800 nm) seen in a single 2PE optical section (~1 μm thick) crossing the cell soma; dotted lines, sampling fluorescence intensity profiles reporting the astrocyte tissue volume fraction (VF); scale bar, 15 µm. Graph, VF profiles (fluorescence local/soma ratio) obtained along the dotted lines i and ii in the image, as indicated; scale bar, 10 µm. b Matching modelled (red) and experimental (blue; mean ± SEM; n = 13 astrocytes) VF values (ordinate, dimensionless) sampled at different distances from the soma (abscissa). c A complete NEURON-generated astrocyte model (z-projection), with main branches depicted in orange (partly obscured by smaller processes) and nanoscopic protrusions (schematic depiction) in purple. Note that tortuous processes of real-life astroglia are represented here by biophysically equivalent ‘straightened’ processes. Scale bar, 10 µm. d An example of astroglia as in a; dotted line, line-scan position to measure internal diffusion connectivity (using Alexa Fluor 594 photobleaching); patch pipette tip is seen. Scale bar, 10 µm. e A snapshot of a photobleaching experiment in silico showing the intracellular Alexa concentration dynamics in a modelled astrocyte; arrows, photobleaching line positioning; false colour scale, intracellular Alexa concentration, as indicated (Supplementary Movie 2). f Matching the modelled (red) and the experimental (blue) time course of intracellular Alexa Flour fluorescence during a photobleaching experiment as shown in d and e, one-cell example (CA1 area, stratum radiatum astrocyte). Grey segments indicate laser shutter-on when fluorescence recovery occurs (red). g Statistical summary of photobleaching experiments (n = 10 astrocytes) and related simulations, as depicted in d and e, comparing experimental (blue) and simulated (red) data
Fig. 4
Fig. 4
Electrogenic properties of protoplasmic astroglia. a Traces, a characteristic current-voltage recording of CA1 astroglia; graph, input resistance (bar, mean ± SEM; dots, individual cell data; n = 15). Scale bars (v, h): 1 mV, 100 ms. b Specific membrane conductance Gm measured in excised whole-cell (outside-out) patches of CA1 astrocytes (bar, mean ± SEM; dots, individual cell data; n = 5). c Dots, Gm values obtained from Ohm’s law Gm = (SmemRi)−1 in stochastically generating astrocyte models within the empirical range of cell volumes (abscissa) and input resistance matching data shown in a; dotted line and grey shade, mean ± SEM for the sample shown; note that NEURON-model astrocyte surface area accounts for both sides and bases of individual cylindrical compartments (Methods). d Membrane space constant estimated using a full astrocyte model for centrifugal (left panels) and centripetal (right panels) voltage signal propagation. Cell shape diagrams: Vm landscape snapshots generated by local application (shown by arrow) of a sine voltage signal (amplitude + 5 mV). Graphs: signal amplitude attenuation at various signal frequencies, as indicated, for centrifugal and centripetal cases, as indicated. Scale bars, 20 µm. e, Traces, example of whole-cell recordings (blue) in response to spot-uncaging of glutamate (λu2p = 720 nm, 20 ms duration), at two distances from the astrocyte soma, as indicated; red lines, simulated whole-cell current in the corresponding model arrangement (~5 µm wide glutamate application; GLT-1 kinetics;, GLT-1 surface density 104 µm−2 as estimated earlier ). Plot, a summary of glutamate uncaging experiments (blue open dots, n = 8 cells/90 uncaging spots) and uncaging tests simulated in the model (red solid dots, n = 39). Scale bars (v, h): 2 pA, 150 ms. f Model snapshot 5 ms post glutamate spot-uncaging depicting the cell membrane current density (j, left) and voltage (Vm; right) landscape (example in Supplementary Movie 3); false colour scale. Scale bar, 10 µm
Fig. 5
Fig. 5
Cellular dynamics triggered by extracellular potassium rise. a Cell shape diagrams, time series snapshots of the cell shape (3D-reconstruction reconstruction shown in Fig. 1a–d) illustrating a spherical 20 µm wide area within which extracellular [K+]out was elevated from baseline 3 to 10 mM, for 2 s (onset at t = 0), as indicated; Kir4.1 channels were evenly distributed with unit conductance of 0.4 mS cm−2 (no other leak conductance) generating peak current density (in the region with [K+]out = 10 mM) of 0.01 mA cm−2. The Kir4.1 kinetics were incorporated in NEURON, in accord with ref. , as IKir=GK0*VAVKAVA1K+out1+expVAVKAVA2VA31+ILA where GK0* is the effective conductance factor, VKA is the Nernst astrocyte K+ potential, VA astrocyte membrane potential, K0 is [K+]out, VA1 an equilibrium parameter (sets IKir to 0 at −80 mV), VA2 and VA3 are constants calibrated by the I–V curve, and ILA residual leak current. b Cell shape diagrams, snapshots illustrating the spatiotemporal dynamics of internal [K+]in in the test shown in a; false colour scale, as indicated. c Snapshots illustrating the spatiotemporal dynamics of the membrane voltage in the test shown in a; false colour scale, as indicated
Fig. 6
Fig. 6
Ca2+ waves and Ca2+ buffering capacity of astrocytes. a Cell diagrams, [Ca2+] landscape snapshots (some branches obstruct full 3D view) at time points after wave generation, with and without Ca2+ buffer, as indicated; graphs, [Ca2+] dynamics snapshots (zero Distance, soma centre), as indicated. Model parameters: Ca2+ diffusion coefficient, 0.3 µm2 ms−1; immobile/endogenous Ca2+ buffer concentration, 200 µM (Kf = 1000 mM−1 ms−1; KD = 20 ms−1); mobile Ca2+ buffer concentration, 10 µM (Kf = 600 mM−1 ms−1; KD = 0.5 ms−1; D = 0.05 µm2 ms−1); Ca2+ pump activation threshold, 50 nM; Ca2+ pump flux density, 20 µM ms−1; basal IP3 concentration, 0.8 µM; IP3 concentration upon release, 5 µM (onset, 1 s; further detail in Supplementary Note 1, ASTRO User Guide, Supplementary Movie 4). Scale bar, 30 µm. b Rat somatosensory cortex in vivo (~100 µm deep) single 2PE optical section, bolus-loading with sulforhodamine 101 to label astroglial structures; AB and AE, examples of astrocyte somata and endfoot processes, respectively. Scale bar, 15 µm. c Region of interest (as in b) in the GCaMP6f (green) channel. Top, snapshot sequence (Supplementary Movie 5; awake-animal example in Supplementary Movie 6) depicting an intracellular Ca2+ wave (dotted circle); bottom, same sequence shown as the time derivative (over 50 ms interval) highlighting Ca2+ wave front; false colour scale. Scale bar, 30 µm. d Cell diagrams, snapshots of Ca2+ wave spreading with the speed that matches experimental observations; false colour scale (C, concentration). Plot, intracellular [Ca2+] profile depicting the centrifugal Ca2+ wave propagation (seen in vivo); δx illustrates wave speed measurement (distance travelled over 0.5 s). e Summary: estimated combination of Ca2+ buffer affinity (Kd) and concentration that correspond to the observed Ca2+ wave speed; [IP3], assumed intracellular concentration of IP3,,; horizontal dotted line, average experimental speed of astroglial Ca2+ waves in vivo (as in c; n = 54 events in ~20 cells)
Fig. 7
Fig. 7
Ca2+ dynamics decoded from fluorescence Ca2+ imaging in situ. a Example, astrocyte (CA1 area, acute hippocampal slice; Fluo 4 channel, λx2P = 800 nm) held in whole cell, with regions of interest for Ca2+ monitoring (circles, ROIs 1–7; Supplementary Movie 7). Scale bar, 5 µm. b Time course of Ca2+ sensitive fluorescence (Fluo-4 channel) recorded in ROIs 1–7 as in a, over 100 s; same colours correspond to ROIs on the same branch (ROIs 2–3 and 4–5). Scale bars (v, h): 200% ΔF/F, 20 s. c, An astrocyte model with localized Ca2+-puff sources (orange dots) and four recording points (arrows, 1–4); dotted oval, region for analyses: cell area outside has a negligible effect of the Ca2+ sources as shown (Supplementary Movie 8). The model is ‘filled’ with free-diffusing Fluo-4 (150 µM; kon = 600 mM−1 ms−1, koff = 21 ms−1) and the endogenous buffer as estimated (Fig. 6d; 200 µM, KD = 0.2 µM; other combinations produced similar results). d Example of channel-like local Ca2+ entry activity generated by a single localized Ca2+ source, in accord with the known biophysical properties of cellular Ca2+ sparks and hotspots. Scale bar, 1 s. e Time course of simulated Fluo-4 fluorescence (150 µM ‘added’) in ROIs 1–4 shown in c: it has statistical properties similar to those recorded in situ (b); shaded area, time window for higher temporal resolution (see f); same line colours correspond to ROIs on the same cell branch. Scale bars (v, h): 100% ΔF/F, 20 s. f, Right, simulated intracellular [Ca2+] dynamics underlying Fluo-4 fluorescence shown in e. Left, trace fragments on the expanded time scale (shaded area in e), as indicated; the fragments correspond to the period of relatively high [Ca2+]

Similar articles

Cited by

References

    1. Parpura V, et al. Glutamate-mediated astrocyte-neuron signalling. Nature. 1994;369:744–747. doi: 10.1038/369744a0. - DOI - PubMed
    1. Nedergaard M. Direct signaling from astrocytes to neurons in cultures of mammalian brain cells. Science. 1994;263:1768–1771. doi: 10.1126/science.8134839. - DOI - PubMed
    1. Verkhratsky A, Kettenmann H. Calcium signalling in glial cells. Trends Neurosci. 1996;19:346–352. doi: 10.1016/0166-2236(96)10048-5. - DOI - PubMed
    1. Araque A, et al. Gliotransmitters travel in time and space. Neuron. 2014;81:728–739. doi: 10.1016/j.neuron.2014.02.007. - DOI - PMC - PubMed
    1. Volterra A, Liaudet N, Savtchouk I. Astrocyte Ca2+ signalling: an unexpected complexity. Nat. Rev. Neurosci. 2014;15:327–335. doi: 10.1038/nrn3725. - DOI - PubMed

Publication types