. 2018 Sep 3;9(1):3555.
doi: 10.1038/s41467-018-05901-2.

Microbiota-derived short-chain fatty acids promote Th1 cell IL-10 production to maintain intestinal homeostasis

Affiliations

Microbiota-derived short-chain fatty acids promote Th1 cell IL-10 production to maintain intestinal homeostasis

Mingming Sun et al. Nat Commun. .

Abstract

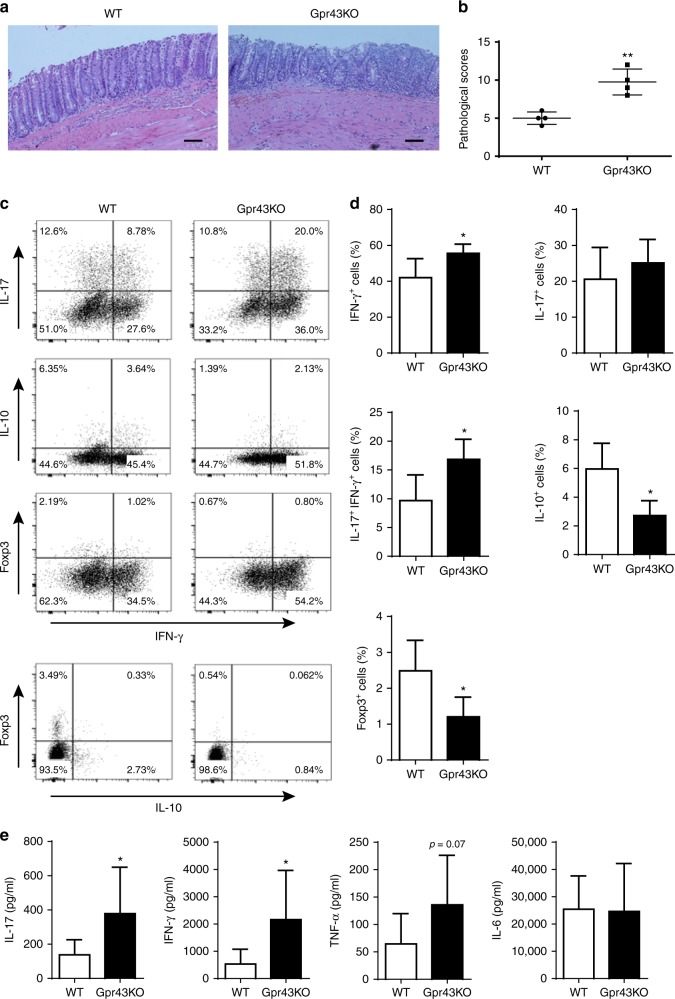
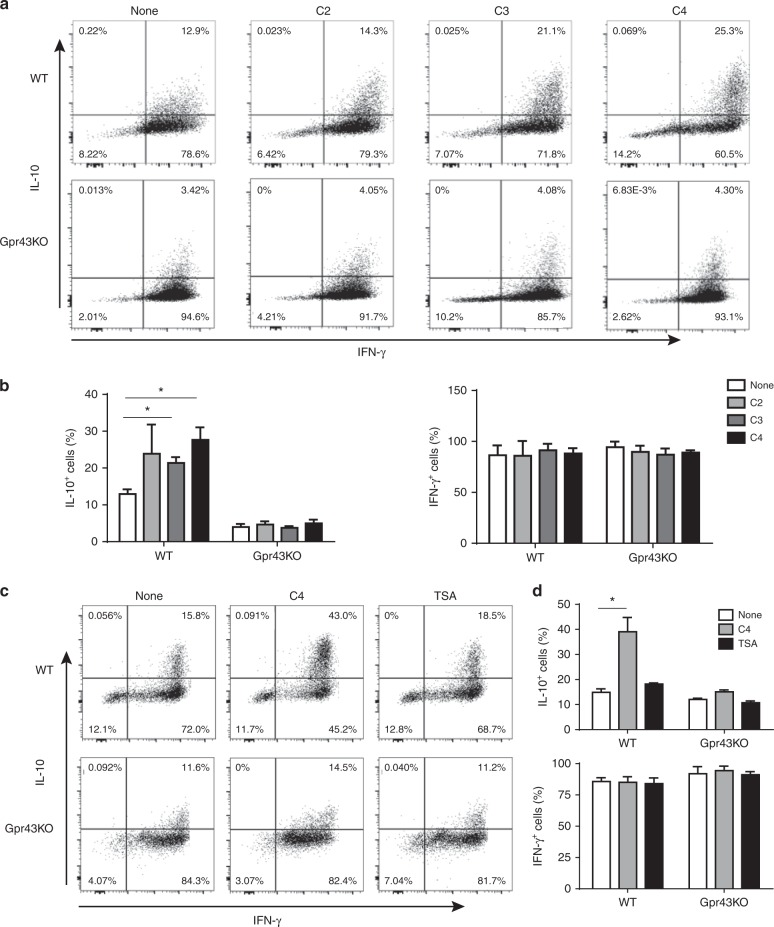
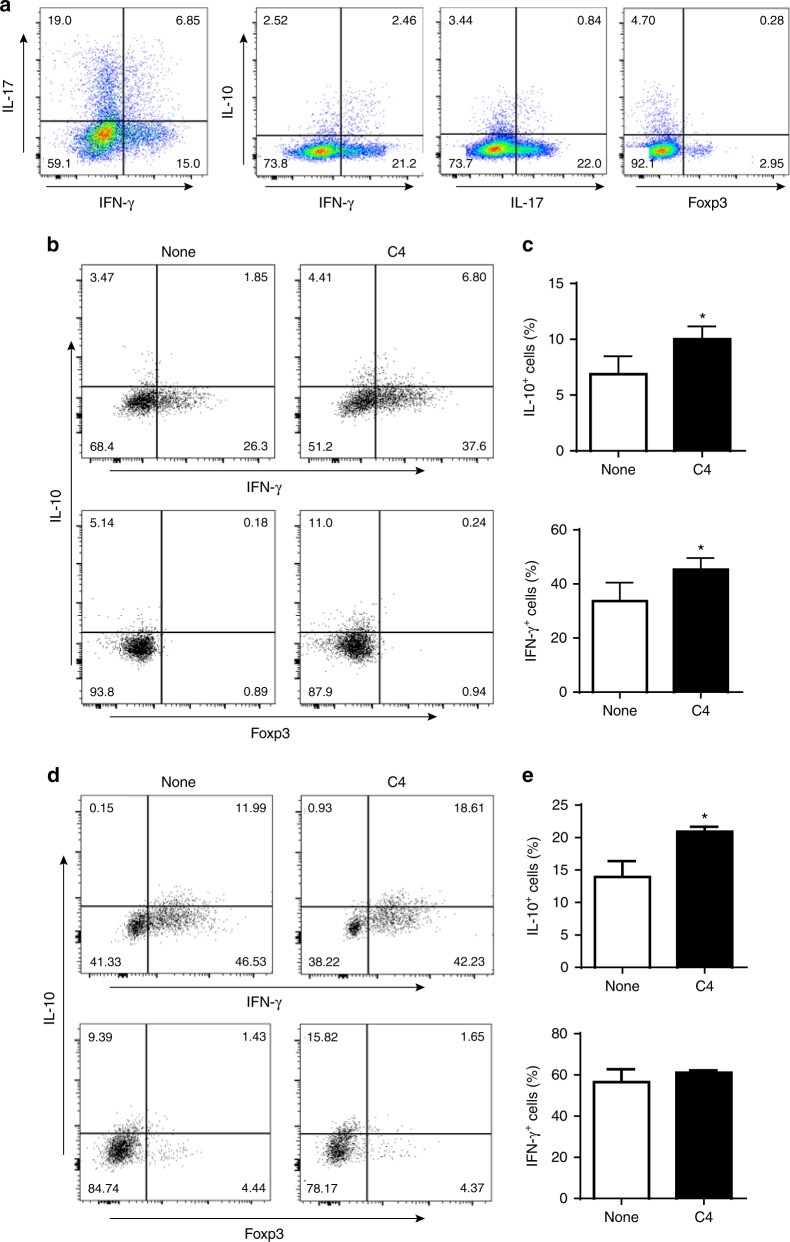
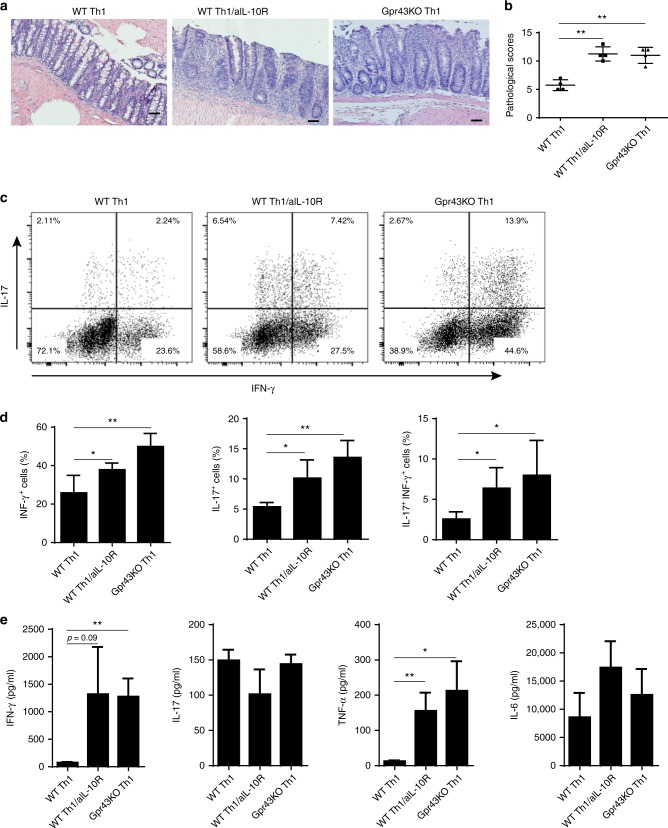
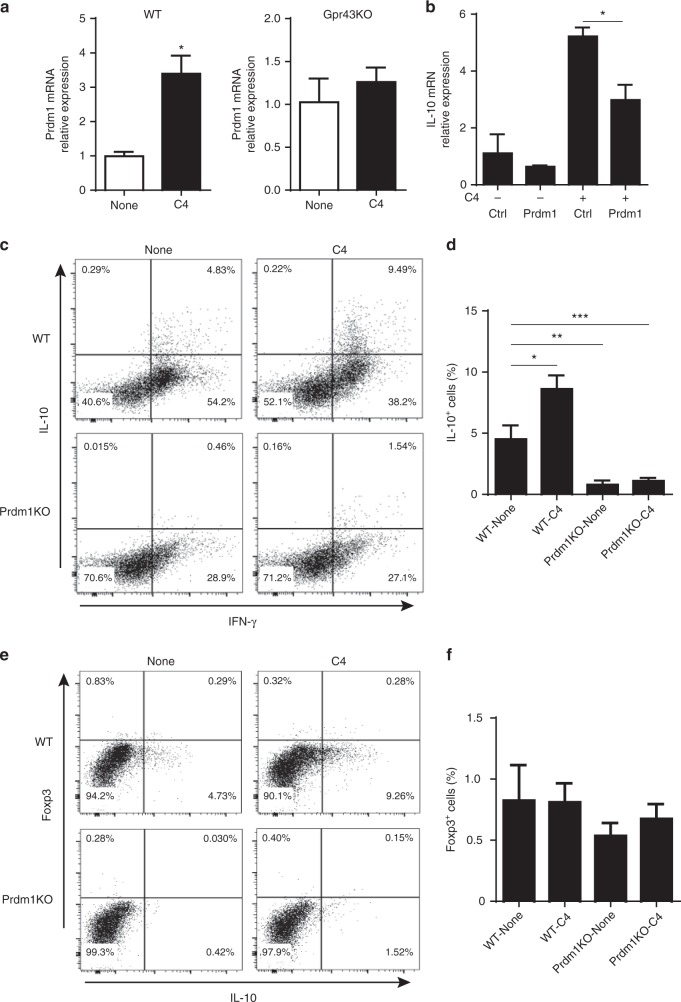
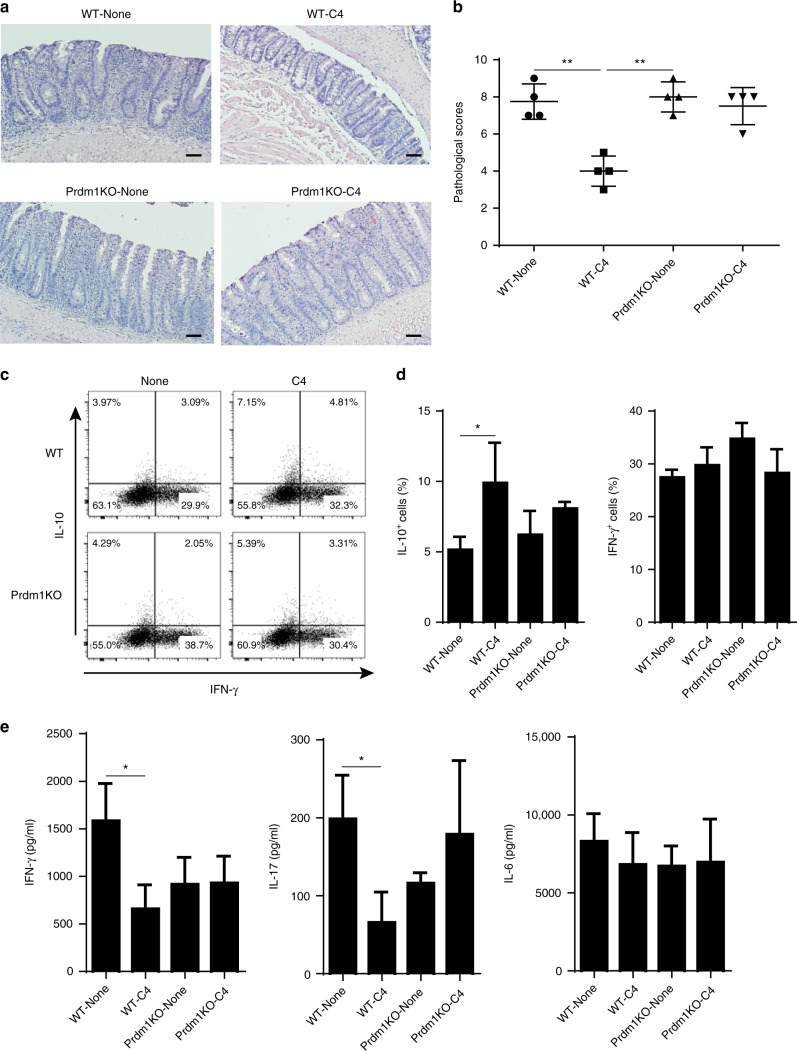
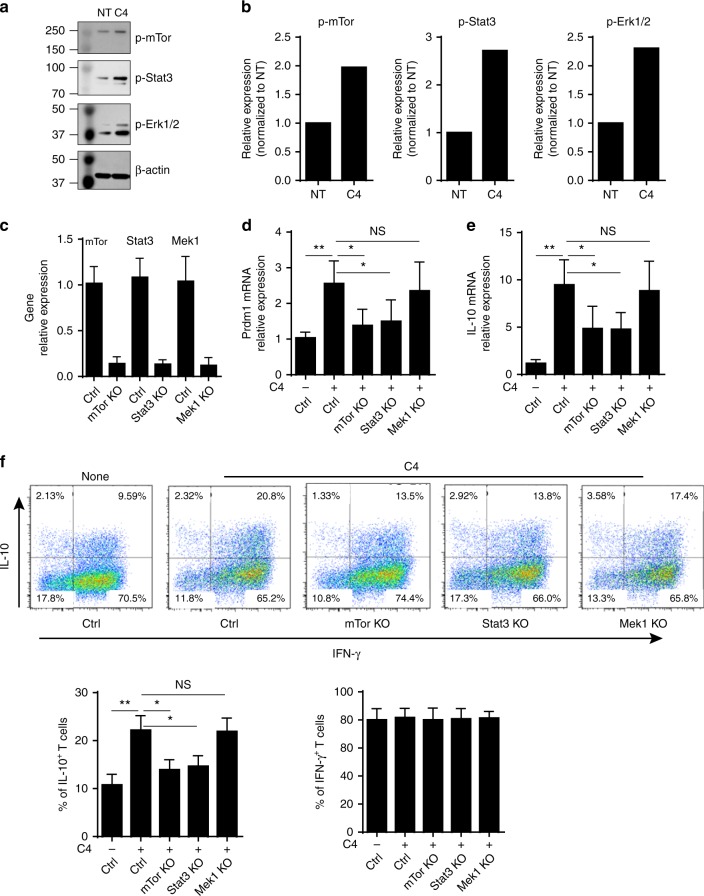
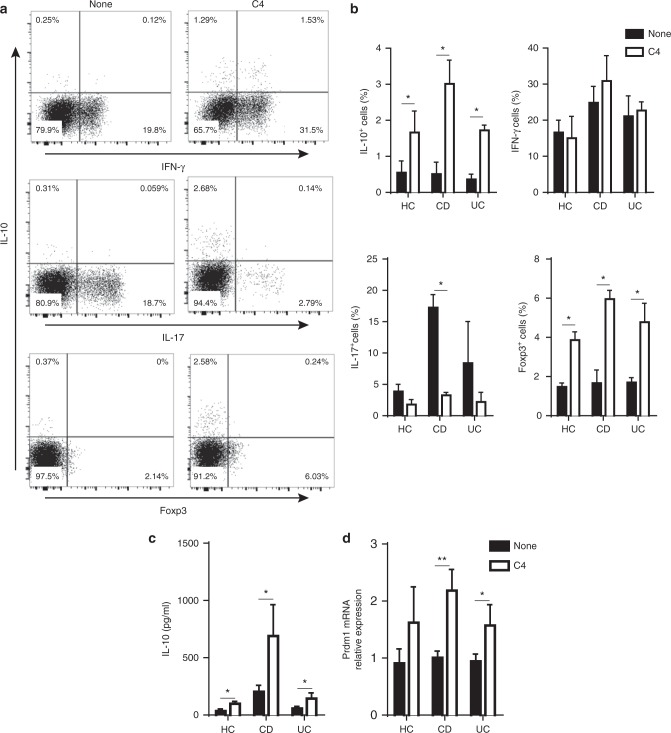
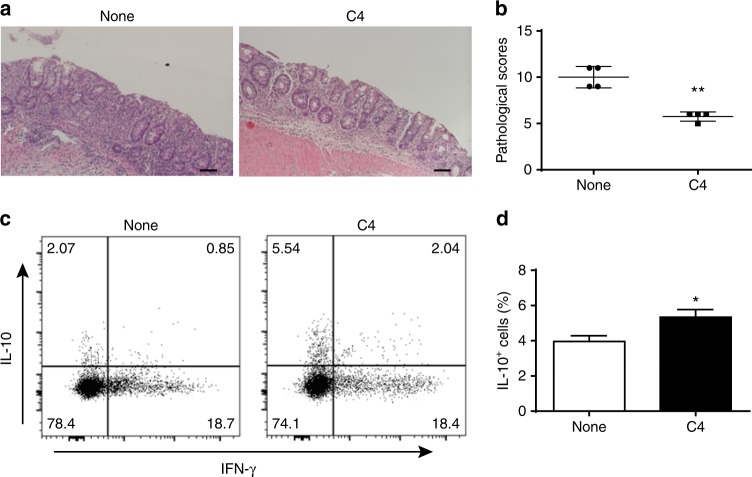
T-cells are crucial in maintanence of intestinal homeostasis, however, it is still unclear how microbiota metabolites regulate T-effector cells. Here we show gut microbiota-derived short-chain fatty acids (SCFAs) promote microbiota antigen-specific Th1 cell IL-10 production, mediated by G-protein coupled receptors 43 (GPR43). Microbiota antigen-specific Gpr43-/- CBir1 transgenic (Tg) Th1 cells, specific for microbiota antigen CBir1 flagellin, induce more severe colitis compared with wide type (WT) CBir1 Tg Th1 cells in Rag-/- recipient mice. Treatment with SCFAs limits colitis induction by promoting IL-10 production, and administration of anti-IL-10R antibody promotes colitis development. Mechanistically, SCFAs activate Th1 cell STAT3 and mTOR, and consequently upregulate transcription factor B lymphocyte-induced maturation protein 1 (Blimp-1), which mediates SCFA-induction of IL-10. SCFA-treated Blimp1-/- Th1 cells produce less IL-10 and induce more severe colitis compared to SCFA-treated WT Th1 cells. Our studies, thus, provide insight into how microbiota metabolites regulate Th1 cell functions to maintain intestinal homeostasis.


Conflict of interest statement

The authors declare no competing interests.

Figures

Fig. 1
Fig. 1
Gpr43−/− microbiota antigen-specific Th1 cells increase pathological potency in induction of colitis. 1 × 106 WT CBir1 (WT) and Gpr43−/– CBir1 (Gpr43KO) Tg Th1 cells were injected i.v. into groups of Rag−/– mice (n = 4/group). Six weeks post-T-cell transfer, the severity of intestinal inflammation was assessed. a, b Colonic histopathology (a) and histological scores (b) are shown. Scale bar, 100 μm. **p < 0.01 Mann–Whitney U-test. c LP CD4+ T-cell cytokine production and Foxp3 expression were determined by flow cytometry. Plot numbers represent the percentage of CD4+ T-cells in the respective quadrants. d Bar charts of the percentage of cytokine-expressing CD4+ T-cells. e Colonic tissues were cultured in the medium for 24 h, and the supernatants were collected for ELISA assay of IL-17, IFN-γ, TNFα, and IL-6. Data are shown as mean ± SD of one representative of three experiments. *p < 0.05 Student’s t-test
Fig. 2
Fig. 2
SCFAs induce IL-10 production of Th1 cells through interaction with GPR43. 1 × 106 WT CBir1 (WT) and Gpr43−/– CBir1 Tg (Gpr43 KO) Th1 cells (n = 3/group) were cultured with irradiated APC and CBir1 peptide in the presence or absence of acetate (C2, 10 mM), propionate (C3, 0.5 mM), and butyrate (C4, 0.5 mM) for 5 days. a, b The expression of IL-10 and IFN-γ was examined by flow cytometry analysis. c, d 1 × 106 CBir1 Th1 cells were stimulated with C4 and HDAC inhibitor TSA (10 nM), respectively, for 5 days. The expression of IL-10 and IFN-γ was examined by flow cytometry analysis. Results are shown as mean ± SD of triplicates from one representative of three experiments performed. *p < 0.05 one-way ANOVA test
Fig. 3
Fig. 3
Th1 cells express IL-10 in inflamed mucosal lesions and SCFAs induce T-cells IL-10 production in vivo. a 1 × 106 naïve CBir1 Tg T-cells were injected i.v. into Rag−/– mice (n = 5). T-cell expression of IL-10, IFN-γ, IL-17, and Foxp3 in lamina propria was examined six weeks after cell transfer when mice developed colitis by flow cytometry. One representative of four experiments performed. be 1 × 106 naïve CBir1 Tg T-cells (b, c) or differentiated CBir1 Tg Th1 cells (d, e) were injected i.v. into Rag−/– mice. Groups of 4–5 mice were fed with or without butyrate (C4, 200 mM) in drinking water from the day of cell transfer for 10 days. T-cell expression of IL-10 and IFN-γ in lamina propria was examined by flow cytometry analysis. Both FACS profile (bd) and bar charts (ce) are shown. Results are shown as mean ± SD of 4–5 mice from one representative of two experiments performed. *p < 0.05 Student’s t-test
Fig. 4
Fig. 4
Low IL-10 production in Gpr43−/− Th1 cells contributes to their high pathogenicity in induction of colitis. WT CBir1 (WT) and Gpr43−/– CBir1 Tg (Gpr43KO) Th1 cells (1 × 106/mouse) were injected i.v. into groups of RAG−/– mice (n = 4–5/group). One group of mice transferred with CBir1 Th1 cells were administrated with anti-IL10R antibody (clone 1B1.3 A, 25 mg/kg) i.p. weekly. The other two groups of mice were given control IgG. Six weeks post-T-cell transfer, the severity of intestinal inflammation was assessed. a, b Colonic histopathology (a) and histological scores (b) are shown. Scale bar, 100 μm. **p < 0.01 Mann–Whitney U-test. c LP CD4+ T-cell cytokine production was determined by flow cytometry. d Bar charts of the percentage of cytokine-expressing CD4+ T-cells. e Colonic tissue cytokine production after 24 h of culture was measured by ELISA. Data are shown as mean ± SD of twelve mice samples pooled from three experiments. *p < 0.05, **p < 0.01 one-way ANOVA test
Fig. 5
Fig. 5
Blimp-1 mediates butyrate induction of IL-10 production in Th1 cells. a WT CBir1 (WT) and Gpr43−/– CBir1 Tg (Gpr43KO) Th1 cells (n = 3/group) were cultured with APC and CBir1 peptide in the presence or absence of C4 for 5 days. The expression of Blimp-1 was examined by qRT-PCR. b WT CBir1 Th1 cells were transfected with Prdm1 siRNA or control siRNA. After 24 h of transfection, the cells were treated with or without C4, and IL-10 expression was determined by qPCR. cf WT and Prdm1−/− Th1 cells were cultured with APC and anti-CD3 mAb in the presence or absence of C4. Expression of IL-10, IFN-γ, and Foxp3 was determined by flow cytometry. qRT-PCR results are shown as mean ± SD of triplicates, and FACS profiles are a representative of triplicates from one of three experiments performed. *p < 0.05, **p < 0.01, ***p < 0.001 one-way ANOVA test
Fig. 6
Fig. 6
Butyrate inhibits pathogenicity of WT Th1 cells but not Prdm1−/− Th1 cells in induction of colitis. WT and Prdm1−/− Th1 cells were cultured with APC and anti-CD3 mAb in the presence or absence of C4 for 5 days, and then injected i.v. into groups of Rag−/– mice (n = 4). Six weeks post-T-cell transfer, the severity of intestinal inflammation was assessed. a, b Colonic histopathology (a) and histological scores (b) are shown. Scale bar, 100 μm. **p < 0.01 Mann–Whitney U-test. c LP CD4+ T-cell cytokine production was determined by flow cytometry. d Bar charts of the percentage of cytokine-expressing CD4+ T-cells. e Colonic tissue cytokine production after 24 h of cultures was determined by ELISA. Data are one representative of three independent experiments. *p < 0.05 one-way ANOVA test
Fig. 7
Fig. 7
STAT3 and mTOR mediate Butyrate-induction of Th1 cell expression of Blimp-1 and IL-10. a, b Th1 cells were cultured with anti-CD3 and anti-CD28 mAbs in the presence or absence of C4. The cell lysates were prepared, and Western blot was used to determine p-mTOR (S2448, 15 min), p-SATA3 (Y705, 15 min), and p-ERK1/2 (137F5, 15 min), with β-actin as reference. cf Th1 cells were transfected with lentiCRISPR plasmids to knock out Stat3, mTor, and Mek1. After 24 h, the expression of relative genes (c) was examined by qRT-PCR. The cells were cultured with anti-CD3 and anti-CD28 mAbs in the presence or absence of C4 (n = 3/group). The expression of Prdm1 (d) and IL-10 (e) was examined at day 2 by qRT-PCR. f T-cell cytokine production was determined at day 5 by FACS. Both representative FACS profile and barchart of IL-10+ and IFNγ+ T-cells were shown. The results are shown as mean ± SD of three samples and are representative from one of three experiments performed. *p < 0.05, **p < 0.01 one-way ANOVA test
Fig. 8
Fig. 8
Butyrate promotes IL-10 production by T-cells from patients with IBD. CD4+ T-cells from peripheral blood mononuclear cells from IBD patients of CD (n = 6), UC (n = 6), and healthy individuals (HC, n = 6) were cultured with anti-CD3 mAb and anti-CD28 mAb in the presence of C4 for 5 days. a CD4+ T-cell cytokine production and Foxp3 expression were determined by flow cytometry. b Bar charts of the percentage of cytokine-expressing CD4+ T-cells. c IL-10 in supernatants of cell culture and d CD4+ T-cell expression of Prdm1 were examined by ELISA and qRT-PCR, respectively. The results are shown as mean ± SD of triplicates and are representative from one of three experiments performed. *p < 0.05, **p < 0.01 Student’s t-test
Fig. 9
Fig. 9
Oral feeding butyrate protects colitis development induced by DSS. B6 mice were administered 1.7% DSS in drinking water for 7 days, followed by 3 days of water. One group (n = 4–5) of mice were fed with butyrate (C4, 200 mM) in drinking water from day 0 when DSS was given. a Representative images of histopathology in cecum. Scale bar, 100 μm. b Histopathological scoring. **p < 0.01 Mann–Whitney U-test. c LP CD4+ T-cell IL-10 and IFNγ production was determined by flow cytometry. d Bar charts of the percentage of IL-10-expressing CD4+ T-cells. n = 4–5 per group per experiment. Data are one representative of 2 independent experiments; *p < 0.05 Student’s t-test

References

    1. Maloy KJ, Powrie F. Intestinal homeostasis and its breakdown in inflammatory bowel disease. Nature. 2011;474:298–306. doi: 10.1038/nature10208. - DOI - PubMed
    1. Haghikia A, et al. Dietary fatty acids directly impact central nervous system autoimmunity via the small intestine. Immunity. 2016;44:951–953. doi: 10.1016/j.immuni.2016.04.006. - DOI - PubMed
    1. Macia L, et al. Microbial influences on epithelial integrity and immune function as a basis for inflammatory diseases. Immunol. Rev. 2012;245:164–176. doi: 10.1111/j.1600-065X.2011.01080.x. - DOI - PubMed
    1. Cummings JH, Pomare EW, Branch WJ, Naylor CP, Macfarlane GT. Short chain fatty acids in human large intestine, portal, hepatic and venous blood. Gut. 1987;28:1221–1227. doi: 10.1136/gut.28.10.1221. - DOI - PMC - PubMed
    1. Sun M, Wu W, Liu Z, Cong Y. Microbiota metabolite short chain fatty acids, GPCR, and inflammatory bowel diseases. J. Gastroenterol. 2017;52:1–8. doi: 10.1007/s00535-016-1242-9. - DOI - PMC - PubMed

Publication types

MeSH terms