

Diffusion-weighted MRI Findings Predict Pathologic Response in Neoadjuvant Treatment of Breast Cancer: The ACRIN 6698 Multicenter Trial
- PMID: 30179110
- PMCID: PMC6283325
- DOI: 10.1148/radiol.2018180273
Diffusion-weighted MRI Findings Predict Pathologic Response in Neoadjuvant Treatment of Breast Cancer: The ACRIN 6698 Multicenter Trial
Abstract
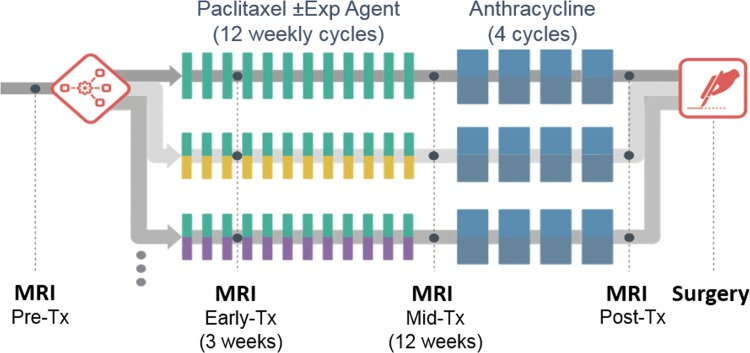
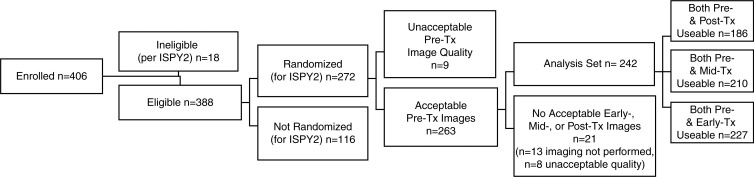
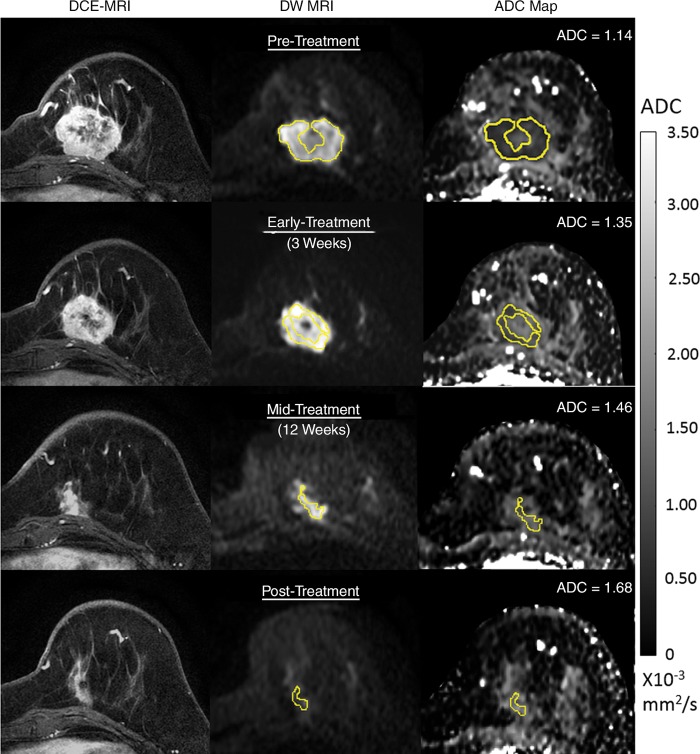
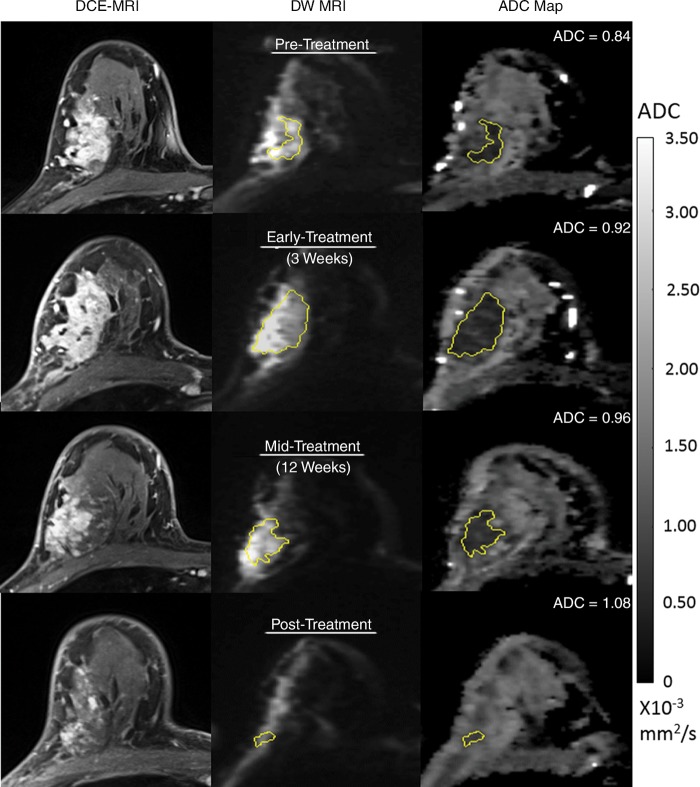
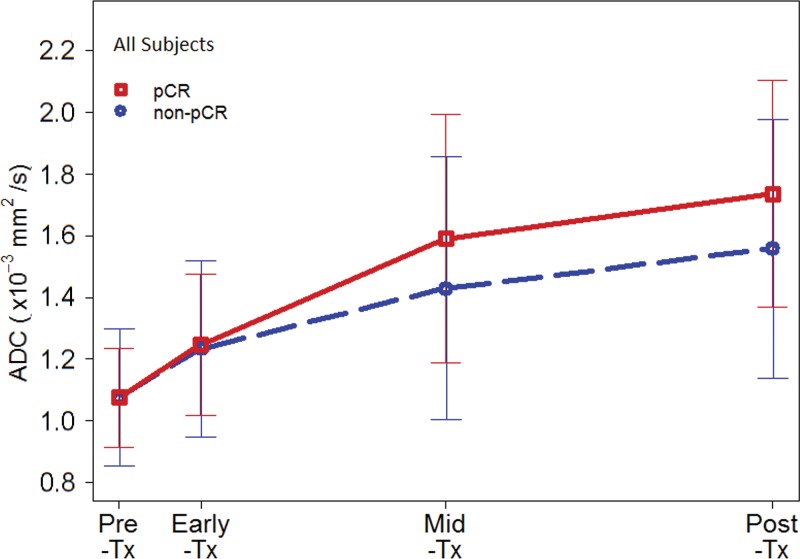
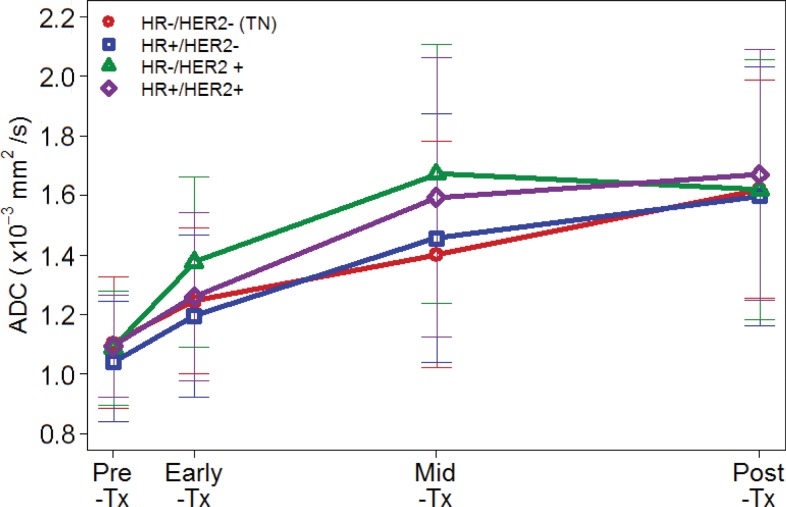
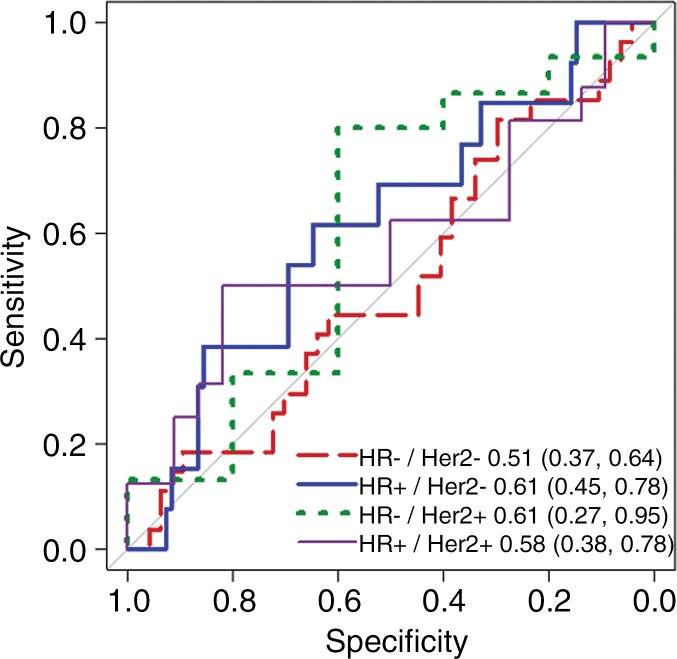
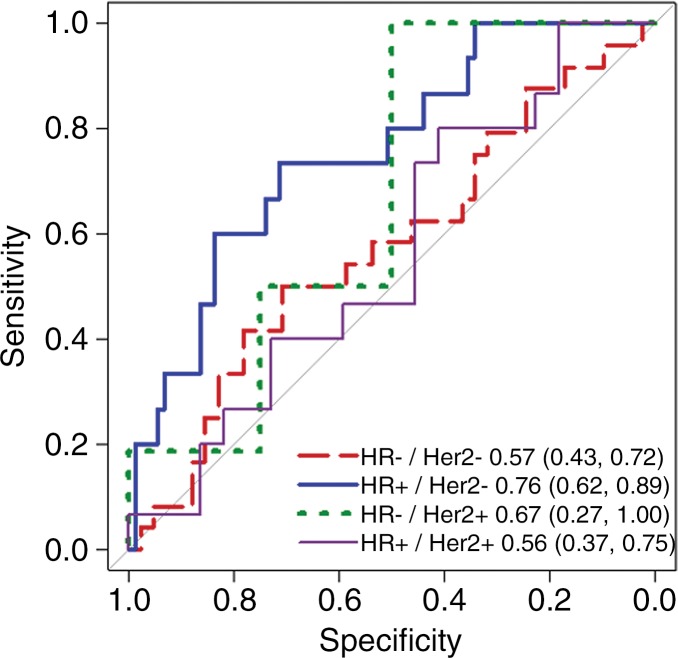
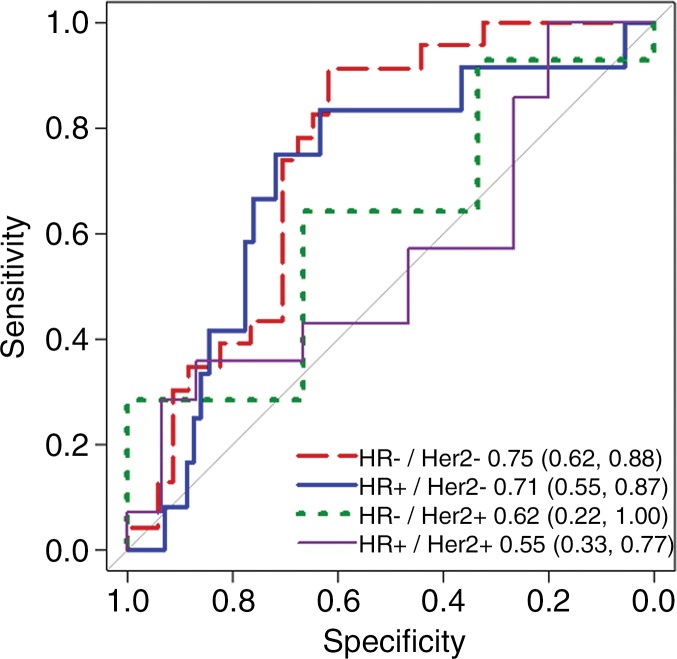
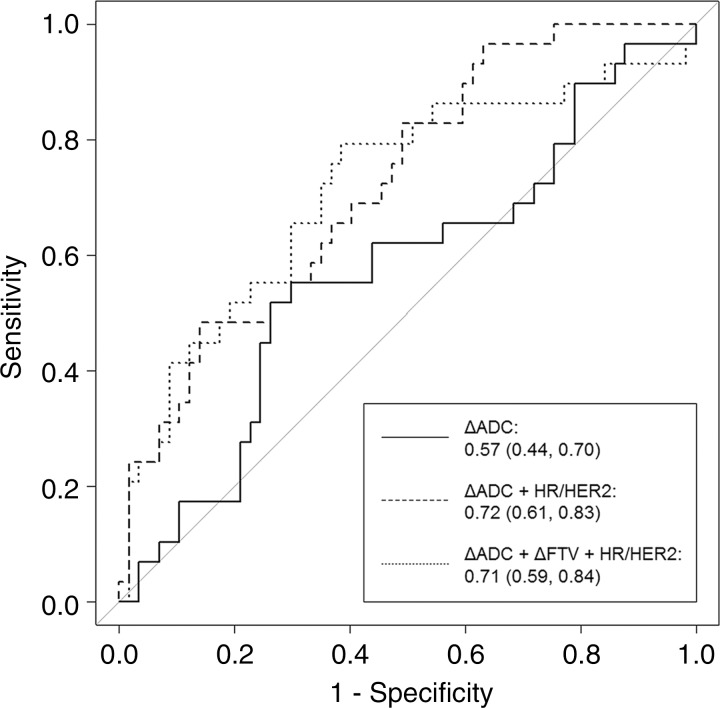
Purpose To determine if the change in tumor apparent diffusion coefficient (ADC) at diffusion-weighted (DW) MRI is predictive of pathologic complete response (pCR) to neoadjuvant chemotherapy for breast cancer. Materials and Methods In this prospective multicenter study, 272 consecutive women with breast cancer were enrolled at 10 institutions (from August 2012 to January 2015) and were randomized to treatment with 12 weekly doses of paclitaxel (with or without an experimental agent), followed by 12 weeks of treatment with four cycles of anthracycline. Each woman underwent breast DW MRI before treatment, at early treatment (3 weeks), at midtreatment (12 weeks), and after treatment. Percentage change in tumor ADC from that before treatment (ΔADC) was measured at each time point. Performance for predicting pCR was assessed by using the area under the receiver operating characteristic curve (AUC) for the overall cohort and according to tumor hormone receptor (HR)/human epidermal growth factor receptor 2 (HER2) disease subtype. Results The final analysis included 242 patients with evaluable serial imaging data, with a mean age of 48 years ± 10 (standard deviation); 99 patients had HR-positive (hereafter, HR+)/HER2-negative (hereafter, HER2-) disease, 77 patients had HR-/HER2- disease, 42 patients had HR+/HER2+ disease, and 24 patients had HR-/HER2+ disease. Eighty (33%) of 242 patients experienced pCR. Overall, ΔADC was moderately predictive of pCR at midtreatment/12 weeks (AUC = 0.60; 95% confidence interval [CI]: 0.52, 0.68; P = .017) and after treatment (AUC = 0.61; 95% CI: 0.52, 0.69; P = .013). Across the four disease subtypes, midtreatment ΔADC was predictive only for HR+/HER2- tumors (AUC = 0.76; 95% CI: 0.62, 0.89; P < .001). In a test subset, a model combining tumor subtype and midtreatment ΔADC improved predictive performance (AUC = 0.72; 95% CI: 0.61, 0.83) over ΔADC alone (AUC = 0.57; 95% CI: 0.44, 0.70; P = .032.). Conclusion After 12 weeks of therapy, change in breast tumor apparent diffusion coefficient at MRI predicts complete pathologic response to neoadjuvant chemotherapy. © RSNA, 2018 Online supplemental material is available for this article.
Figures
Comment in
-
Diffusion-weighted MRI in Multicenter Trials of Breast Cancer: A Useful Measure of Tumor Response?Radiology. 2018 Dec;289(3):628-629. doi: 10.1148/radiol.2018181717. Epub 2018 Sep 4. Radiology. 2018. PMID: 30179102 No abstract available.
-
Diffusion-weighted MRI in Multicenter Trials of Breast Cancer.Radiology. 2019 May;291(2):546. doi: 10.1148/radiol.2019190446. Epub 2019 Apr 2. Radiology. 2019. PMID: 30938630 No abstract available.
Similar articles
-
Time-Dependent Diffusion MRI Helps Predict Molecular Subtypes and Treatment Response to Neoadjuvant Chemotherapy in Breast Cancer.Radiology. 2024 Oct;313(1):e240288. doi: 10.1148/radiol.240288. Radiology. 2024. PMID: 39436292
-
Additive value of diffusion-weighted MRI in the I-SPY 2 TRIAL.J Magn Reson Imaging. 2019 Dec;50(6):1742-1753. doi: 10.1002/jmri.26770. Epub 2019 Apr 26. J Magn Reson Imaging. 2019. PMID: 31026118 Free PMC article. Clinical Trial.
-
Texture Analysis with 3.0-T MRI for Association of Response to Neoadjuvant Chemotherapy in Breast Cancer.Radiology. 2020 Jan;294(1):31-41. doi: 10.1148/radiol.2019182718. Epub 2019 Nov 26. Radiology. 2020. PMID: 31769740
-
Comparing Multi-b-Value Diffusion MRI Models for Predicting Pathologic Complete Response to Neoadjuvant Chemotherapy in Breast Cancer.Radiology. 2025 Jul;316(1):e242969. doi: 10.1148/radiol.242969. Radiology. 2025. PMID: 40693938
-
Potential of MRI in Assessing Treatment Response After Neoadjuvant Radiation Therapy Treatment in Breast Cancer Patients: A Scoping Review.Clin Breast Cancer. 2025 Jan;25(1):e1-e9.e2. doi: 10.1016/j.clbc.2024.05.010. Epub 2024 May 31. Clin Breast Cancer. 2025. PMID: 38906720
Cited by
-
Standardised lesion segmentation for imaging biomarker quantitation: a consensus recommendation from ESR and EORTC.Insights Imaging. 2022 Oct 4;13(1):159. doi: 10.1186/s13244-022-01287-4. Insights Imaging. 2022. PMID: 36194301 Free PMC article.
-
Diffusion-weighted imaging of the breast-a consensus and mission statement from the EUSOBI International Breast Diffusion-Weighted Imaging working group.Eur Radiol. 2020 Mar;30(3):1436-1450. doi: 10.1007/s00330-019-06510-3. Epub 2019 Nov 30. Eur Radiol. 2020. PMID: 31786616 Free PMC article.
-
Assessment of diffusion-weighted MRI in predicting response to neoadjuvant chemotherapy in breast cancer patients.Sci Rep. 2023 Jan 12;13(1):614. doi: 10.1038/s41598-023-27787-x. Sci Rep. 2023. PMID: 36635514 Free PMC article.
-
Machine learning with textural analysis of longitudinal multiparametric MRI and molecular subtypes accurately predicts pathologic complete response in patients with invasive breast cancer.PLoS One. 2023 Jan 17;18(1):e0280320. doi: 10.1371/journal.pone.0280320. eCollection 2023. PLoS One. 2023. PMID: 36649274 Free PMC article.
-
Can apparent diffusion coefficient (ADC) distinguish breast cancer from benign breast findings? A meta-analysis based on 13 847 lesions.BMC Cancer. 2019 Oct 15;19(1):955. doi: 10.1186/s12885-019-6201-4. BMC Cancer. 2019. PMID: 31615463 Free PMC article.
References
-
- Chenevert TL, Stegman LD, Taylor JM, et al. Diffusion magnetic resonance imaging: an early surrogate marker of therapeutic efficacy in brain tumors. J Natl Cancer Inst 2000;92(24):2029–2036. - PubMed
-
- Sharma U, Danishad KK, Seenu V, Jagannathan NR. Longitudinal study of the assessment by MRI and diffusion-weighted imaging of tumor response in patients with locally advanced breast cancer undergoing neoadjuvant chemotherapy. NMR Biomed 2009;22(1):104–113. - PubMed
-
- Li XR, Cheng LQ, Liu M, et al. DW-MRI ADC values can predict treatment response in patients with locally advanced breast cancer undergoing neoadjuvant chemotherapy. Med Oncol 2012;29(2):425–431. - PubMed
Publication types
MeSH terms
Grants and funding
LinkOut - more resources
Full Text Sources
Other Literature Sources
Medical
Research Materials
Miscellaneous
