. 2018 Oct 1;128(10):4454-4471.
doi: 10.1172/JCI96138. Epub 2018 Sep 4.

REVERBa couples the circadian clock to hepatic glucocorticoid action

Affiliations

REVERBa couples the circadian clock to hepatic glucocorticoid action

Giorgio Caratti et al. J Clin Invest. .

Abstract

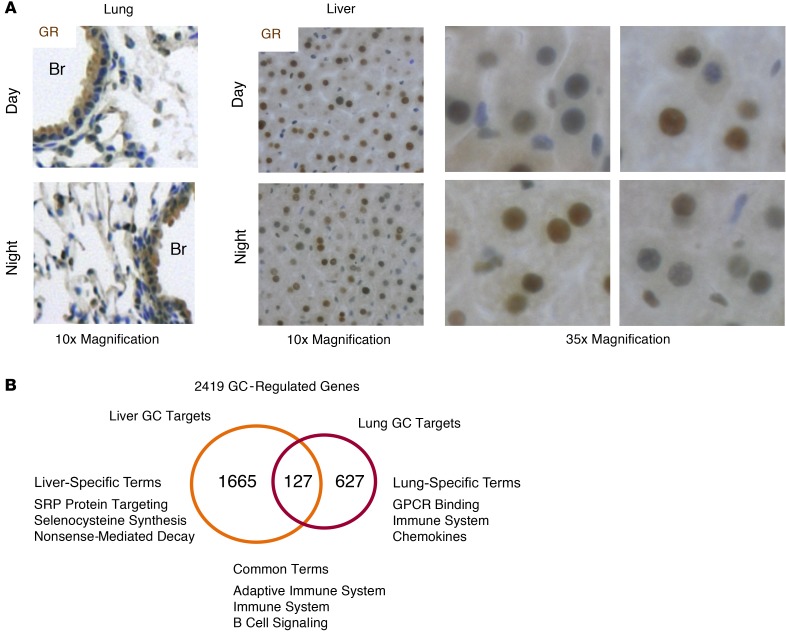
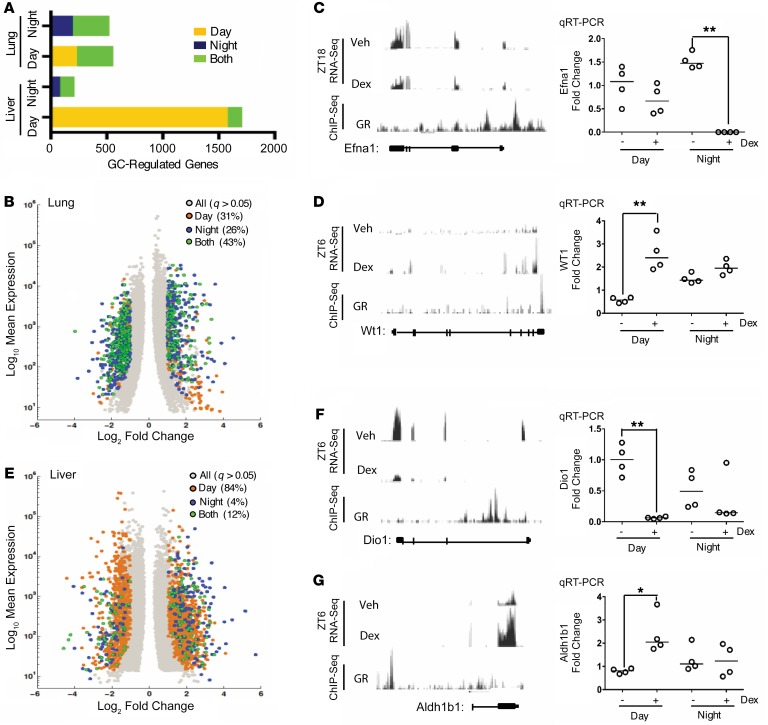
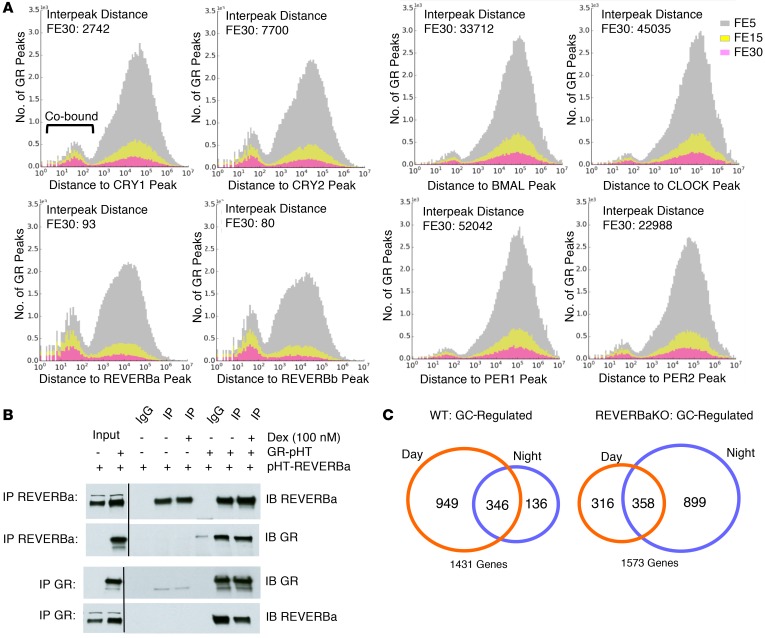
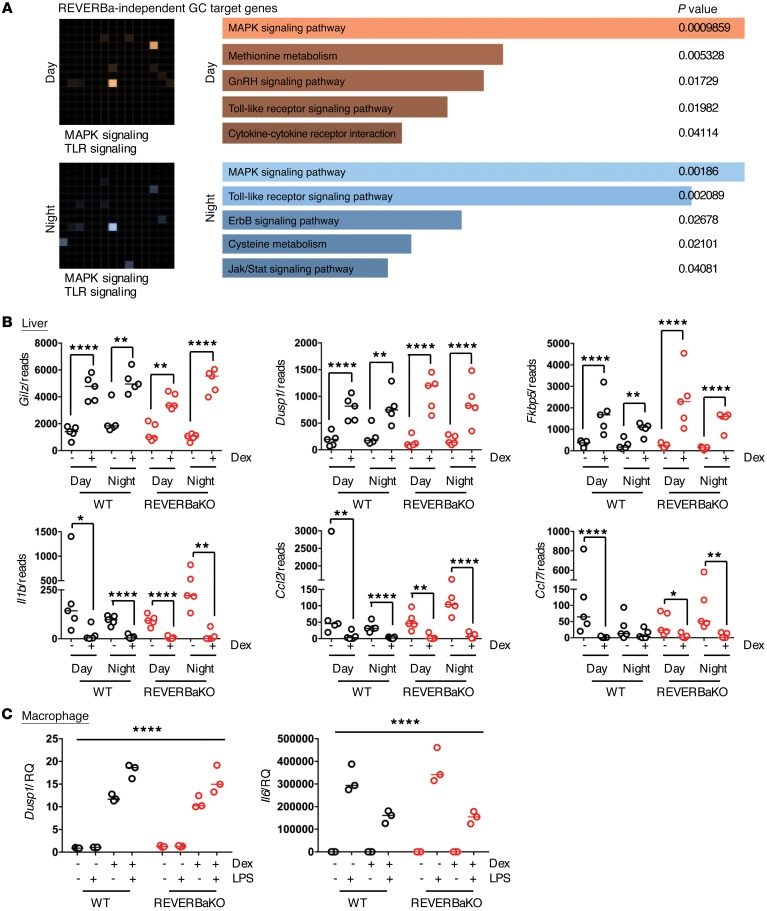
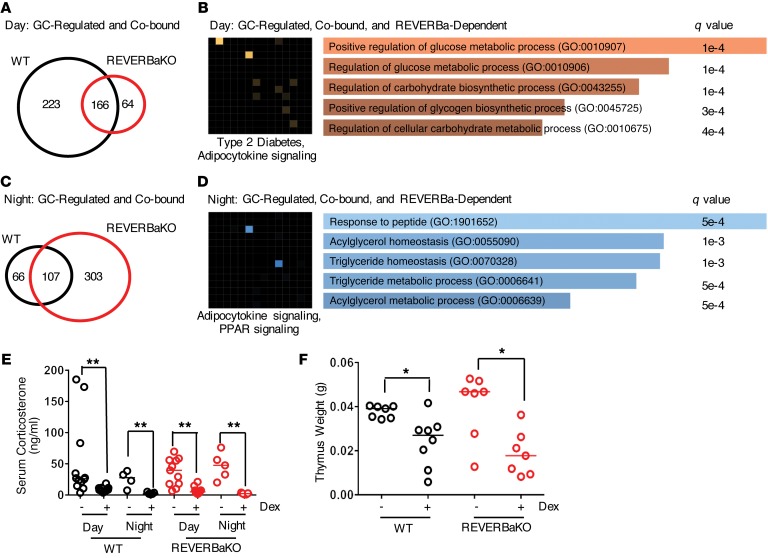
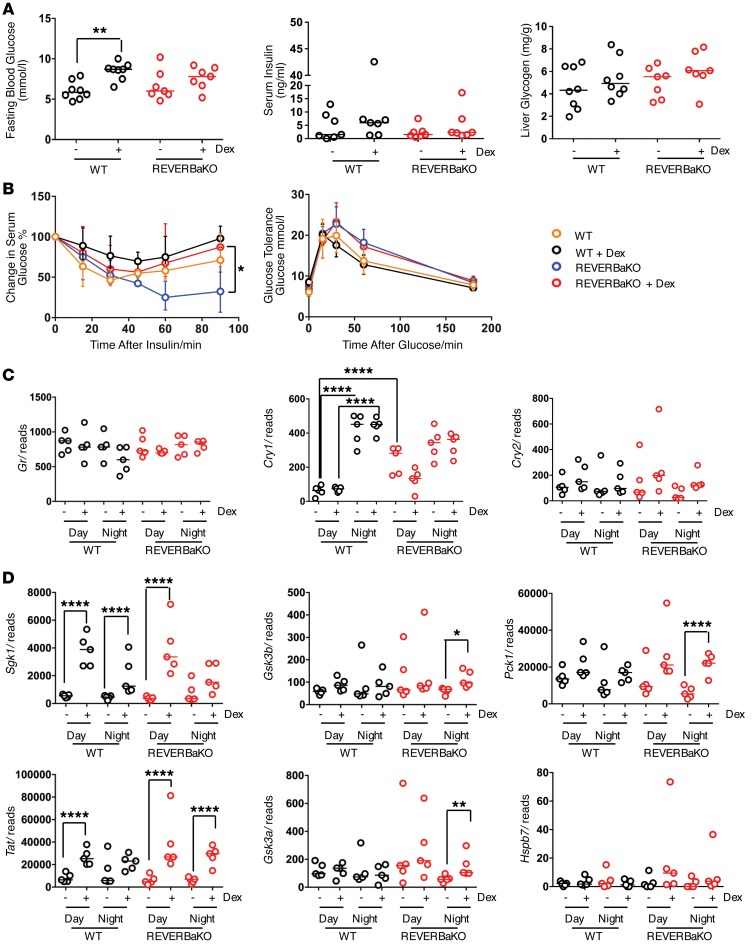
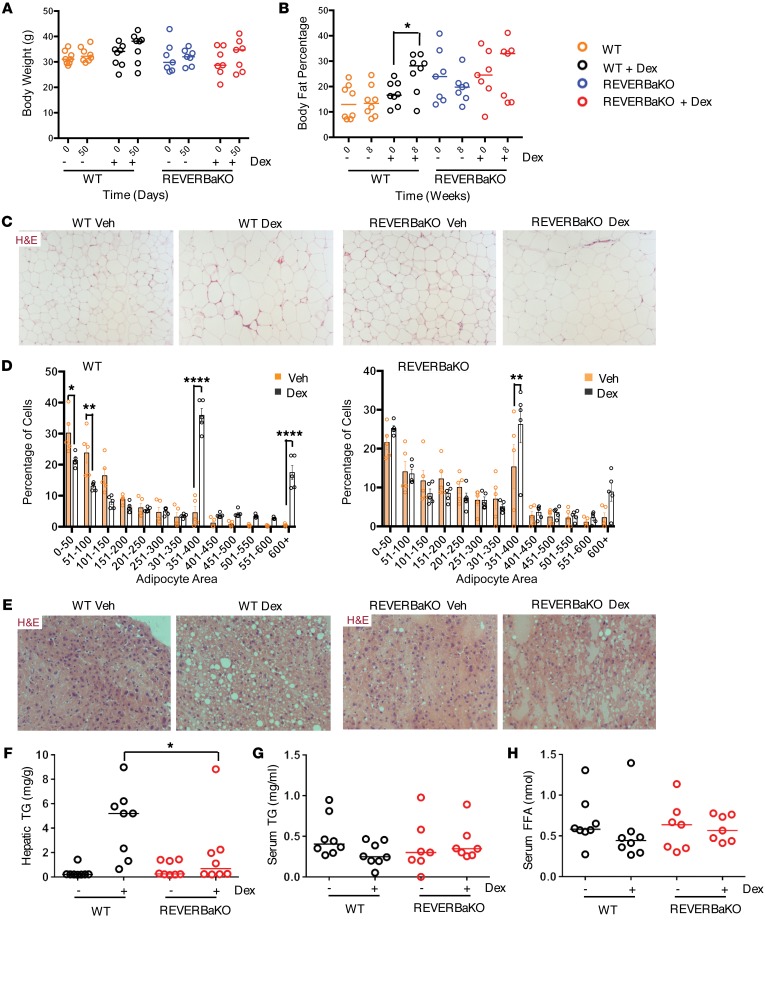
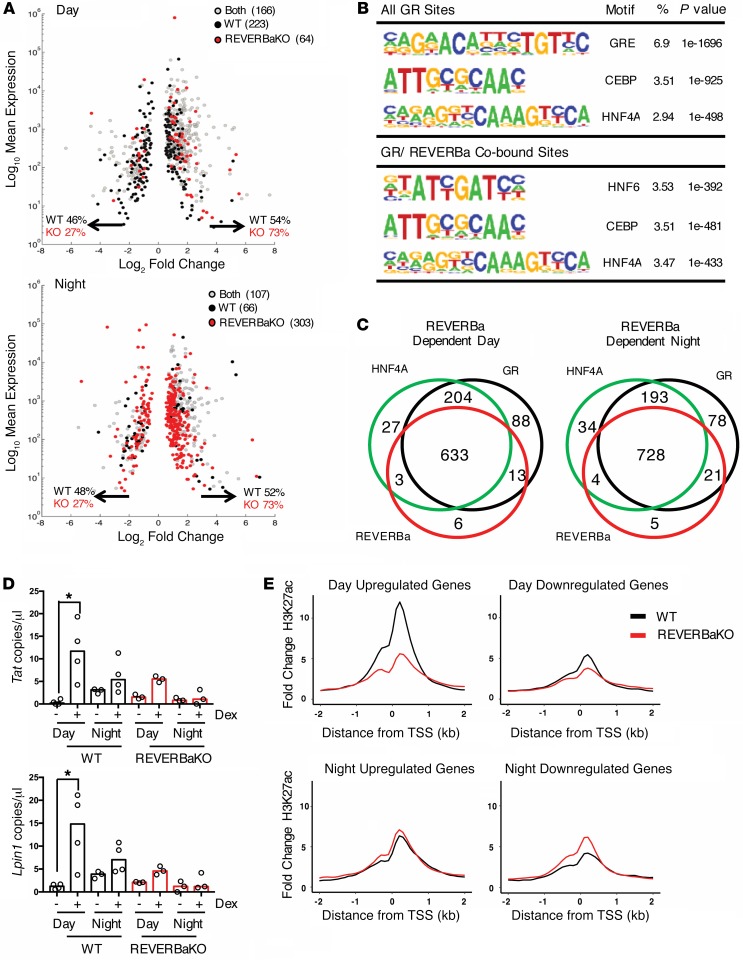
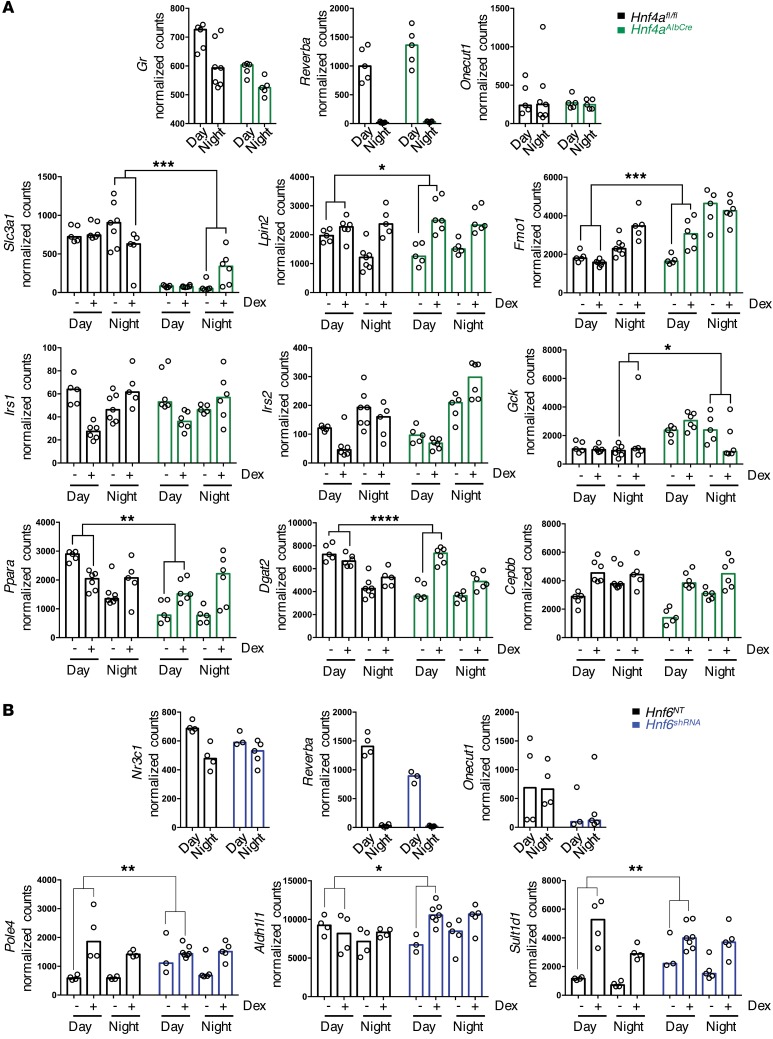
The glucocorticoid receptor (GR) is a major drug target in inflammatory disease. However, chronic glucocorticoid (GC) treatment leads to disordered energy metabolism, including increased weight gain, adiposity, and hepatosteatosis - all programs modulated by the circadian clock. We demonstrated that while antiinflammatory GC actions were maintained irrespective of dosing time, the liver was significantly more GC sensitive during the day. Temporal segregation of GC action was underpinned by a physical interaction of GR with the circadian transcription factor REVERBa and co-binding with liver-specific hepatocyte nuclear transcription factors (HNFs) on chromatin. REVERBa promoted efficient GR recruitment to chromatin during the day, acting in part by maintaining histone acetylation, with REVERBa-dependent GC responses providing segregation of carbohydrate and lipid metabolism. Importantly, deletion of Reverba inverted circadian liver GC sensitivity and protected mice from hepatosteatosis induced by chronic GC administration. Our results reveal a mechanism by which the circadian clock acts through REVERBa in liver on elements bound by HNF4A/HNF6 to direct GR action on energy metabolism.

Keywords: Endocrinology; Metabolism; Transcription.


Conflict of interest statement

Conflict of interest: The authors have declared that no conflict of interest exists.

Figures

Figure 1
Figure 1. GCs induce tissue-specific transcriptomes.
(A) GR immunohistochemistry in lung and liver at ZT8 (Day) and ZT20 (Night). GR expression is shown in brown; nuclei are blue. Br, bronchioles. C57BL/6 mice were given vehicle or 1 mg/kg i.p. dex at ZT6 (1 pm, day) or ZT18 (1 am, night) and culled 2 hours later, and lung and liver were analyzed by RNA-Seq. (B) Venn diagram depicting all GC-regulated genes identified byDESeq2 (n = 2 per group, >2-fold change to vehicle control, <0.05 FDR). Lung- and liver-specific targets are indicated, with gene ontology terms for each group listed below. SRP, signal recognition particle.
Figure 2
Figure 2. GC sensitivity in liver is regulated by time of day.
(A) Histogram depicting number and time-of-day regulation of GC targets for each tissue. (B) Base mean expression versus log2 fold change plots for GC-regulated genes in lung show direction of regulation. (C and D) Two time-specific exemplars were validated by qRT-PCR (Veh and dex), and GR DNA binding (GR) was assessed via analysis of GR ChIP-Seq data. (E) Base mean expression versus log2 fold change plots for GC-regulated genes in liver show direction of regulation. (F and G) Two time-specific exemplars were validated by qRT-PCR, and GR DNA binding was assessed using GR ChIP-Seq data. For qRT-PCR data, individual data points are shown with median (n = 4 per group). Statistical analysis by Kruskal-Wallis test with a Dunn’s multiple comparisons correction, where *P < 0.05, **P < 0.01. Volcano plots depict all GC-regulated genes identified byDESeq2 (n = 2 per group, >2-fold change to vehicle control, <0.05 FDR).
Figure 3
Figure 3. REVERBa regulates GR function.
(A) Co-binding histograms depict the distance between GR binding events and the nearest clock transcription factor ChIP-Seq summit, using 3 stringencies (FE scores). Median interpeak distances for the highest stringency (FE30) is shown. (B) Coimmunoprecipitation of epitope-tagged REVERBa and GR. C57BL/6 (WT) and REVERBaKO mice were given 1 mg/kg i.p. dex at ZT6 (day) or ZT18 (night) and culled 2 hours later, and livers were analyzed by RNA-Seq. (C) Venn diagram depicts all GC-regulated genes identified byDESeq2 (n = 5 per group, >2-fold change to vehicle control, <0.1 FDR). pHT, polyhistidine tag.
Figure 4
Figure 4. REVERBa does not regulate antiinflammatory GC effects.
(A) Gene ontology (Enrichr) grids for REVERBa-independent GC targets with the 2 highest-ranking terms listed underneath. (B) Graphs show RNA-Seq reads for antiinflammatory GC target genes from liver RNA-Seq. Individual samples (n = 5) are plotted with the median for each group. Bone marrow–derived macrophages were isolated from REVERBaKO and WT littermate control mice, treated with vehicle or 100 nM dex for 1 hour, then with 100 ng/ml LPS for 4 hours. (C) GC regulation was determined by qRT-PCR for Dusp1 and Il6; no genotypic differences were observed; data shown as median. Two-way ANOVA (macrophages, n = 3) effect of treatment, P < 0.001; Fisher’s exact test adapted for negative binomial distribution (RNA-Seq), *q < 0.05, **q < 0.01, ****q < 0.0001. RQ, relative quantity.
Figure 5
Figure 5. REVERBa selectively regulates GC action depending on time of day.
(A) Daytime-regulated GC targets were further stratified for regions of GR-REVERBa co-binding from Figure 3. (B) Gene ontology (Enrichr) of GC-regulated, co-bound, REVERBa-dependent genes in the day. (C) Nighttime-regulated GC targets were further stratified for regions of GR-REVERBa co-binding from Figure 3. (D) Gene ontology (Enrichr) of GC-regulated, co-bound, REVERBa-dependent genes at night. (E) Dex suppression test via measurement of serum corticosterone at both ZT6 and ZT18 in WT and REVERBaKO mice with a single dose of dex 1 mg/kg. C57BL/6 (WT) and REVERBaKO mice were given 1 mg/kg i.p. dex or vehicle at ZT6 every 48 hours for 8 weeks. (F) C57BL/6 (WT) and REVERBaKO mice were given 1 mg/kg i.p. dex or vehicle at ZT6 every 48 hours for 8 weeks. Thymus weight was measured. Corticosterone measurement, n = 5–12; thymus weight, n = 7–8, *P < 0.05, **P < 0.01, Mann-Whitney U test; shown as median.
Figure 6
Figure 6. The effect of REVERBa on GC action is independent of cryptochromes.
(A) C57BL/6 (WT) and REVERBaKO mice were given 1 mg/kg i.p. dex or vehicle at ZT6 every 48 hours for 8 weeks. Mice were assessed for effects on carbohydrate metabolism by fasting glucose (left), serum insulin (center), and liver glycogen content (right). (B) Mice were fasted for 4 hours and assessed for insulin tolerance (left) or fasted overnight for glucose tolerance (right) (n = 7–8). (C) Graphs show RNA-Seq reads for Gr (left), Cry1 (center), and Cry2 (right) target genes. (D) Graphs show RNA-Seq reads for known CRY1-regulated genes. Individual samples from RNA-Seq (n = 5) are all plotted with the median for each group. Individual values and median are shown for serum glucose, serum insulin, and liver glycogen. Mean values are shown for GTT and ITT. *q < 0.05, **q < 0.01, ****q < 0.0001, Fischer’s exact test adapted for negative binomial distribution (RNA-Seq). *P < 0.05, **P < 0.01, 2-way ANOVA (fasting glucose, GTT, serum insulin, liver glycogen, and ITT).
Figure 7
Figure 7. REVERBa regulates lipid metabolism.
C57BL/6 (WT) and REVERBaKO mice were given 1 mg/kg i.p. dex or vehicle at ZT6 every 48 hours for 8 weeks. Mice were assessed for effects on lipid metabolism. Body weight (A) and body fat percentage by EchoMRI (B) were measured at the start and end of the study (n = 7–8). Visceral fat adipocyte size was assessed by H&E (C) and quantified (D) (x axis values, U/μm2; n = 5, average of 3 fields); original magnification, ×10. (E) H&E of liver, collected at cull; original magnification, ×10. Liver triglycerides (F), serum triglycerides (TG) (G), and free fatty acids (FFA) (H) were also analyzed (n = 8 liver, n = 7–8 serum). Graphs show data for individual animals with median; adipocyte area shows individual values and mean. Statistical analysis via 2-way ANOVA repeated measures (body weight and fat mass), 2-way ANOVA and 3-way ANOVA (adipocyte size), or Kruskal-Wallis test with a Dunn’s multiple comparison correction (hepatic triglycerides, serum triglycerides, and serum free fatty acids), *P < 0.05, **P < 0.01, ****P < 0.0001.
Figure 8
Figure 8. Rhythmicity of GC sensitivity in liver is determined by REVERBa and HNF transcription factors.
(A) Base mean expression versus log2 fold change plots for GC-regulated genes in day and night show direction of gene regulation. (B) Summary of top-ranked motifs (by coverage [%], defined as fraction of observed/expected proportions taken from HOMER output) under all GR peaks or GR/REVERBa co-bound peaks (interpeak distance, <120 bp). (C) Overlay of GC-regulated genes with GR/REVERBa/HNF ChIP-Seq in the day and night. (D) ChIP-PCR for GR-REVERBa target genes in liver associated with carbohydrate (Tat) and lipid ontology (Lpin1) (n = 3–4); graphs show individual values and median. (E) C57BL/6 (WT) and REVERBaKO mice (male and female) were given 1 mg/kg i.p. dex or vehicle at ZT6 or ZT18 for 1 hour; livers were removed and fixed, and chromatin was immunoprecipitated for H3K27Ac (n = 2). Fold change in H3K27Ac coverage from prior to the transcription start site of genes upregulated or downregulated specifically during the day (top), and genes upregulated or downregulated specifically during the night (bottom) in WT and REVERBaKO mice identified from RNA-Seq in Figure 3. Statistical analysis via Mann-Whitney U test (ChIP-PCR), *P < 0.05.
Figure 9
Figure 9. Hnf4a and Hnf6 selectively regulate rhythmic GC action.
(A) Hnf4aAlbCre and Hnf4afl/fl controls were treated with 1 mg/kg dex at ZT6 or ZT18 and culled 2 hours later. Livers were harvested, and RNA was analyzed via NanoString (n = 5–7 per group). (B) C57BL/6J mice were injected with shRNA against Hnf6. Mice were treated with 1 mg/kg dex at ZT6 or ZT18 and culled 2 hours later. Livers were harvested, and RNA was analyzed via NanoString (n = 3–7 per group). Genotype × treatment × time interactions were analyzed by limma; *q < 0.05, **q < 0.01, ***q < 0.001, ****q < 0.0001. Data shown for individual mice and median.

References

    1. Schäcke H, Döcke WD, Asadullah K. Mechanisms involved in the side effects of glucocorticoids. Pharmacol Ther. 2002;96(1):23–43. doi: 10.1016/S0163-7258(02)00297-8. - DOI - PubMed
    1. Li X, Wong J, Tsai SY, Tsai MJ, O’Malley BW. Progesterone and glucocorticoid receptors recruit distinct coactivator complexes and promote distinct patterns of local chromatin modification. Mol Cell Biol. 2003;23(11):3763–3773. doi: 10.1128/MCB.23.11.3763-3773.2003. - DOI - PMC - PubMed
    1. Sheppard KA, et al. Nuclear integration of glucocorticoid receptor and nuclear factor-kappaB signaling by CREB-binding protein and steroid receptor coactivator-1. J Biol Chem. 1998;273(45):29291–29294. doi: 10.1074/jbc.273.45.29291. - DOI - PubMed
    1. Scheinman RI, Gualberto A, Jewell CM, Cidlowski JA, Baldwin AS. Characterization of mechanisms involved in transrepression of NF-kappa B by activated glucocorticoid receptors. Mol Cell Biol. 1995;15(2):943–953. doi: 10.1128/MCB.15.2.943. - DOI - PMC - PubMed
    1. Tao Y, Williams-Skipp C, Scheinman RI. Mapping of glucocorticoid receptor DNA binding domain surfaces contributing to transrepression of NF-kappa B and induction of apoptosis. J Biol Chem. 2001;276(4):2329–2332. doi: 10.1074/jbc.C000526200. - DOI - PubMed

Publication types

MeSH terms