. 2018 Sep 4:5:180154.
doi: 10.1038/sdata.2018.154.

Single cell genomes of Prochlorococcus, Synechococcus, and sympatric microbes from diverse marine environments

Affiliations

Single cell genomes of Prochlorococcus, Synechococcus, and sympatric microbes from diverse marine environments

Paul M Berube et al. Sci Data. .

Abstract

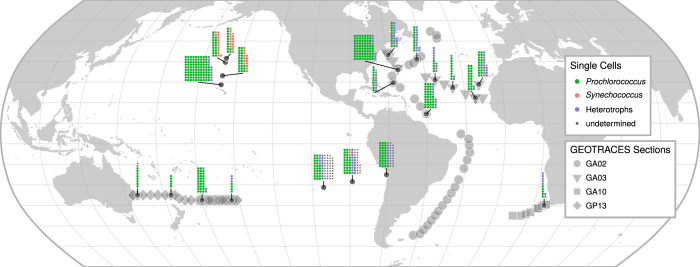
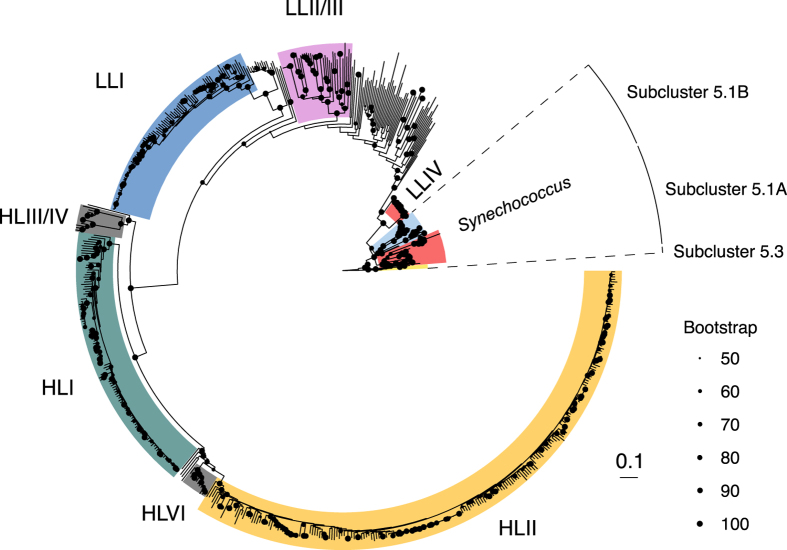
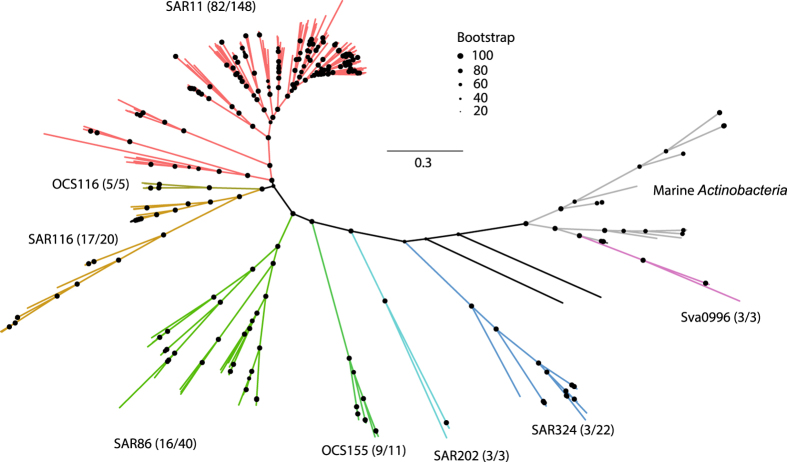
Prochlorococcus and Synechococcus are the dominant primary producers in marine ecosystems and perform a significant fraction of ocean carbon fixation. These cyanobacteria interact with a diverse microbial community that coexists with them. Comparative genomics of cultivated isolates has helped address questions regarding patterns of evolution and diversity among microbes, but the fraction that can be cultivated is miniscule compared to the diversity in the wild. To further probe the diversity of these groups and extend the utility of reference sequence databases, we report a data set of single cell genomes for 489 Prochlorococcus, 50 Synechococcus, 9 extracellular virus particles, and 190 additional microorganisms from a diverse range of bacterial, archaeal, and viral groups. Many of these uncultivated single cell genomes are derived from samples obtained on GEOTRACES cruises and at well-studied oceanographic stations, each with extensive suites of physical, chemical, and biological measurements. The genomic data reported here greatly increases the number of available Prochlorococcus genomes and will facilitate studies on evolutionary biology, microbial ecology, and biological oceanography.


Conflict of interest statement

The authors declare no competing interests.

Figures

Figure 1
Figure 1. Map of sampling locations.
Single cell genomes at each site are represented by miniaturized stacked dot-plots (each dot represents one single cell genome), with organism group indicated by color, and cells categorized as “undetermined” if robust placement within known phylogenetic groups failed due to low assembly completeness/quality or missing close references. Larger points correspond to stations on associated GEOTRACES cruises.
Figure 2
Figure 2. Maximum Likelihood phylogeny of cyanobacterial genomes.
The phylogeny includes 66 Prochlorococcus isolate genomes, 27 Synechococcus isolate references, and 588 single cell genomes (533 of which are part of this project). Bootstrap values are represented by size-scaled dots at nodes. Bootstrap values less than 50 are omitted. Scale bar represents 0.1 nucleotide substitutions per sequence position. Phylogenetic clade membership is indicated by colored blocks and text labels. The three Synechococcus subclusters displayed are highlighted by dashed lines and a segmented outer ring. The tree is rooted at Synechococcus sp. WH5701 (subcluster 5.2). The underlying data set used for phylogenetic inference was a concatenated alignment of 2–37 PhyloSift marker gene families (see methods for details).
Figure 3
Figure 3. Maximum Likelihood phylogeny of heterotrophic bacterial single cell genomes and additional reference genomes.
Bootstrap values are represented by size-scaled dots at nodes. Scale bar represents 0.3 nucleotide substitutions per sequence position. The eight taxonomic lineages of the single cells are colored and labeled. Additional marine Actinobacteria lineages are presented in grey to provide added context for the Sva0996 lineage. Numbers in parenthesis indicate the number of single cell genomes from each lineage relative to the total number of genomes in that lineage used to construct the tree. The underlying data set used for phylogenetic inference was a concatenated alignment of 2-37 PhyloSift marker gene families (see methods for details).

References

Data Citations

    1. Berube P. M., et al. . 2018. Figshare. https://doi.org/10.6084/m9.figshare.c.4037048 - DOI
    1. 2017. GenBank. MG666579-MG668595
    1. 2018. GenBank. MH074888-MH077527
    1. 2018. NCBI Sequence Read Archive. SRP141175
    1. 2018. GenBank. QBVH00000000-QCVZ00000000

References

    1. Flombaum P. et al. Present and future global distributions of the marine Cyanobacteria Prochlorococcus and Synechococcus. Proc Natl Acad Sci USA 110, 9824–9829 (2013). - PMC - PubMed
    1. Karl D. M. A Sea of Change: Biogeochemical Variability in the North Pacific Subtropical Gyre. Ecosystems 2, 181–214 (1999).
    1. Partensky F., Hess W. R. & Vaulot D. Prochlorococcus, a marine photosynthetic prokaryote of global significance. Microbiol Mol Biol Rev 63, 106–127 (1999). - PMC - PubMed
    1. Partensky F. & Garczarek L. Prochlorococcus: advantages and limits of minimalism. Ann Rev Mar Sci 2, 305–331 (2010). - PubMed
    1. Mackey K. R. et al. Effect of temperature on photosynthesis and growth in marine Synechococcus spp. Plant Physiol 163, 815–829 (2013). - PMC - PubMed

Publication types

LinkOut - more resources