

Polygenic risk score for schizophrenia and structural brain connectivity in older age: A longitudinal connectome and tractography study
- PMID: 30179718
- PMCID: PMC6215331
- DOI: 10.1016/j.neuroimage.2018.08.075
Polygenic risk score for schizophrenia and structural brain connectivity in older age: A longitudinal connectome and tractography study
Abstract
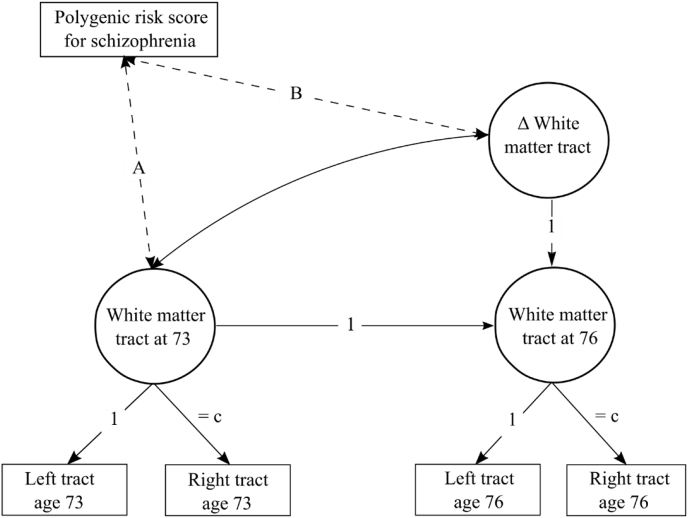
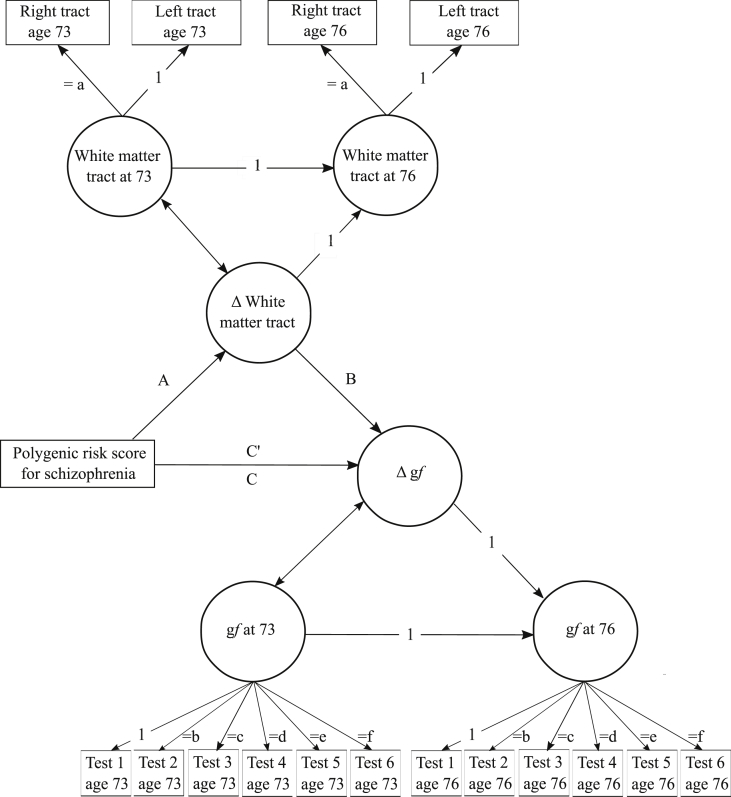
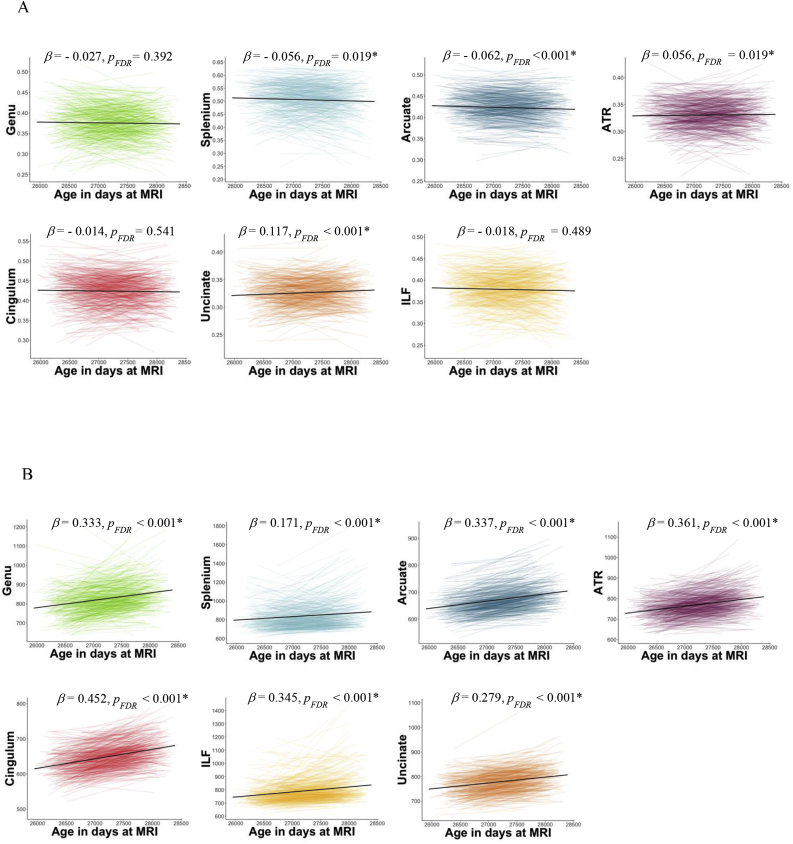
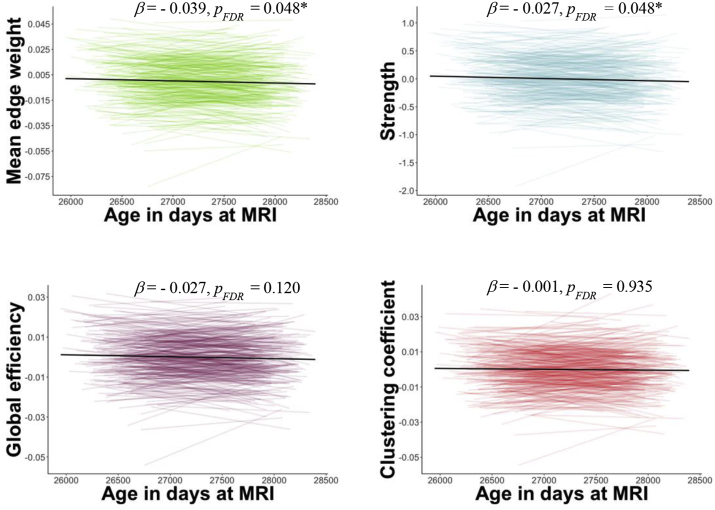
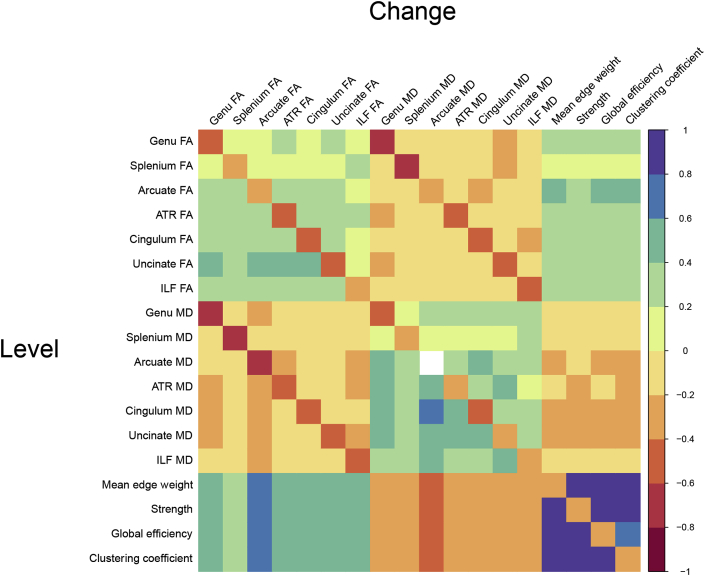
Higher polygenic risk score for schizophrenia (szPGRS) has been associated with lower cognitive function and might be a predictor of decline in brain structure in apparently healthy populations. Age-related declines in structural brain connectivity-measured using white matter diffusion MRI -are evident from cross-sectional data. Yet, it remains unclear how graph theoretical metrics of the structural connectome change over time, and whether szPGRS is associated with differences in ageing-related changes in human brain connectivity. Here, we studied a large, relatively healthy, same-year-of-birth, older age cohort over a period of 3 years (age ∼ 73 years, N = 731; age ∼76 years, N = 488). From their brain scans we derived tract-averaged fractional anisotropy (FA) and mean diffusivity (MD), and network topology properties. We investigated the cross-sectional and longitudinal associations between these structural brain variables and szPGRS. Higher szPGRS showed significant associations with longitudinal increases in MD in the splenium (β = 0.132, pFDR = 0.040), arcuate (β = 0.291, pFDR = 0.040), anterior thalamic radiations (β = 0.215, pFDR = 0.040) and cingulum (β = 0.165, pFDR = 0.040). Significant declines over time were observed in graph theory metrics for FA-weighted networks, such as mean edge weight (β = -0.039, pFDR = 0.048) and strength (β = -0.027, pFDR = 0.048). No significant associations were found between szPGRS and graph theory metrics. These results are consistent with the hypothesis that szPGRS confers risk for ageing-related degradation of some aspects of structural connectivity.
Keywords: Ageing; Genetics; Longitudinal; Schizophrenia; Structural connectivity.
Copyright © 2018 The Authors. Published by Elsevier Inc. All rights reserved.
Figures
Similar articles
-
White Matter Disruptions in Schizophrenia Are Spatially Widespread and Topologically Converge on Brain Network Hubs.Schizophr Bull. 2017 Mar 1;43(2):425-435. doi: 10.1093/schbul/sbw100. Schizophr Bull. 2017. PMID: 27535082 Free PMC article.
-
Differential Association of Schizotypy Dimensions With Brain Structural Connectivity and Moderation by Schizophrenia Polygenic Risk.Schizophr Bull. 2025 Mar 4;51(Suppl 2):S149-S159. doi: 10.1093/schbul/sbae160. Schizophr Bull. 2025. PMID: 40037820 Free PMC article.
-
White matter connectivity disruptions in early and chronic schizophrenia.Psychol Med. 2017 Dec;47(16):2797-2810. doi: 10.1017/S0033291717001313. Epub 2017 May 22. Psychol Med. 2017. PMID: 28528586
-
Linking Polygenic Risk of Schizophrenia to Variation in Magnetic Resonance Imaging Brain Measures: A Comprehensive Systematic Review.Schizophr Bull. 2024 Jan 1;50(1):32-46. doi: 10.1093/schbul/sbad087. Schizophr Bull. 2024. PMID: 37354489 Free PMC article.
-
White Matter-Based Structural Brain Network of Major Depression.Adv Exp Med Biol. 2021;1305:35-55. doi: 10.1007/978-981-33-6044-0_3. Adv Exp Med Biol. 2021. PMID: 33834393 Review.
Cited by
-
Genetic Influence Underlying Brain Connectivity Phenotype: A Study on Two Age-Specific Cohorts.Front Genet. 2022 Feb 7;12:782953. doi: 10.3389/fgene.2021.782953. eCollection 2021. Front Genet. 2022. PMID: 35237294 Free PMC article.
-
Longitudinal Structural MRI Findings in Individuals at Genetic and Clinical High Risk for Psychosis: A Systematic Review.Front Psychiatry. 2021 Feb 2;12:620401. doi: 10.3389/fpsyt.2021.620401. eCollection 2021. Front Psychiatry. 2021. PMID: 33603688 Free PMC article.
-
Psychotic-like experiences, polygenic risk scores for schizophrenia, and structural properties of the salience, default mode, and central-executive networks in healthy participants from UK Biobank.Transl Psychiatry. 2020 Apr 27;10(1):122. doi: 10.1038/s41398-020-0794-x. Transl Psychiatry. 2020. PMID: 32341335 Free PMC article.
-
A Possible White Matter Compensating Mechanism in the Brain of Relatives of People Affected by Psychosis Inferred from Repeated Long-Term DTI Scans.Schizophr Bull Open. 2022 Sep 8;3(1):sgac055. doi: 10.1093/schizbullopen/sgac055. eCollection 2022 Jan. Schizophr Bull Open. 2022. PMID: 39144792 Free PMC article.
-
Identification of voxel-based texture abnormalities as new biomarkers for schizophrenia and major depressive patients using layer-wise relevance propagation on deep learning decisions.Psychiatry Res Neuroimaging. 2021 Jul 30;313:111303. doi: 10.1016/j.pscychresns.2021.111303. Epub 2021 May 16. Psychiatry Res Neuroimaging. 2021. PMID: 34034096 Free PMC article.
References
-
- Aboitiz F., Scheibel A.B., Zaidel E. Morphometry of the Sylvian fissure and the corpus callosum, with emphasis on sex differences. Brain J. Neurol. 1992;115(Pt 5):1521–1541. - PubMed
-
- Alexander-Bloch A.F., Gogtay N., Meunier D., Birn R., Clasen L., Lalonde F., Lenroot R., Giedd J., Bullmore E.T. Disrupted modularity and local connectivity of brain functional networks in childhood-onset schizophrenia. Front. Syst. Neurosci. 2010;4:147. doi: 10.3389/fnsys.2010.00147. - DOI - PMC - PubMed
Publication types
MeSH terms
Grants and funding
LinkOut - more resources
Full Text Sources
Other Literature Sources
Medical
