

BrownieAligner: accurate alignment of Illumina sequencing data to de Bruijn graphs
- PMID: 30180801
- PMCID: PMC6122196
- DOI: 10.1186/s12859-018-2319-7
BrownieAligner: accurate alignment of Illumina sequencing data to de Bruijn graphs
Abstract
Background: Aligning short reads to a reference genome is an important task in many genome analysis pipelines. This task is computationally more complex when the reference genome is provided in the form of a de Bruijn graph instead of a linear sequence string.
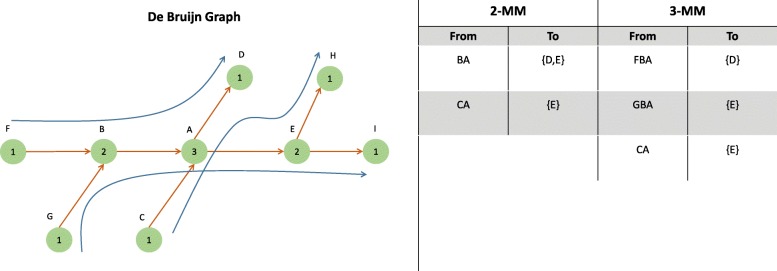
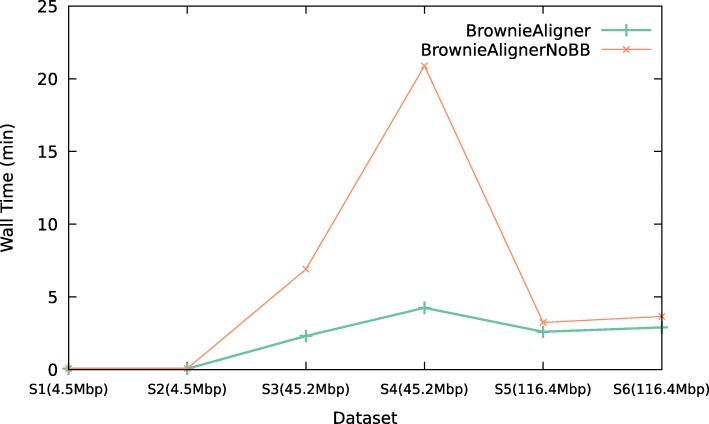
Results: We present a branch and bound alignment algorithm that uses the seed-and-extend paradigm to accurately align short Illumina reads to a graph. Given a seed, the algorithm greedily explores all branches of the tree until the optimal alignment path is found. To reduce the search space we compute upper bounds to the alignment score for each branch and discard the branch if it cannot improve the best solution found so far. Additionally, by using a two-pass alignment strategy and a higher-order Markov model, paths in the de Bruijn graph that do not represent a subsequence in the original reference genome are discarded from the search procedure.
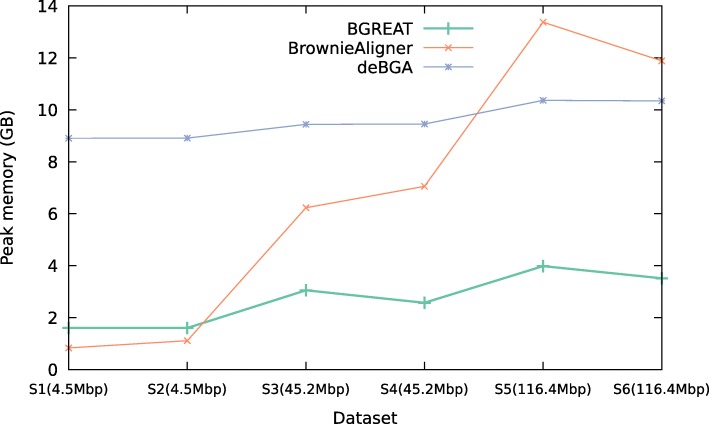
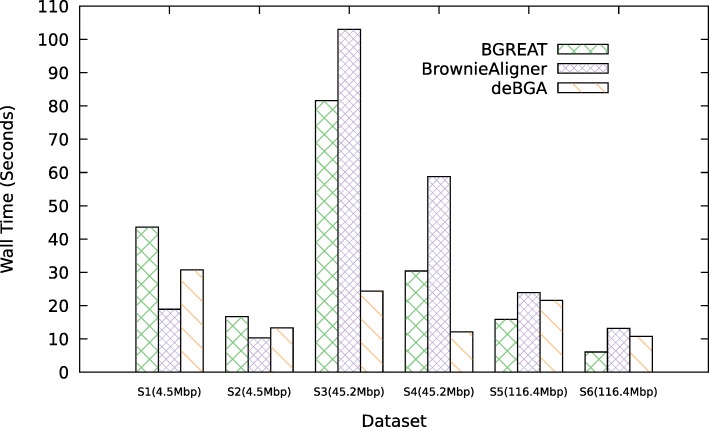
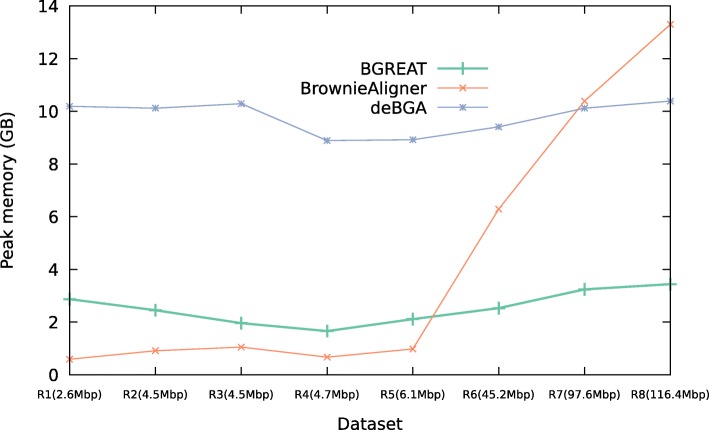
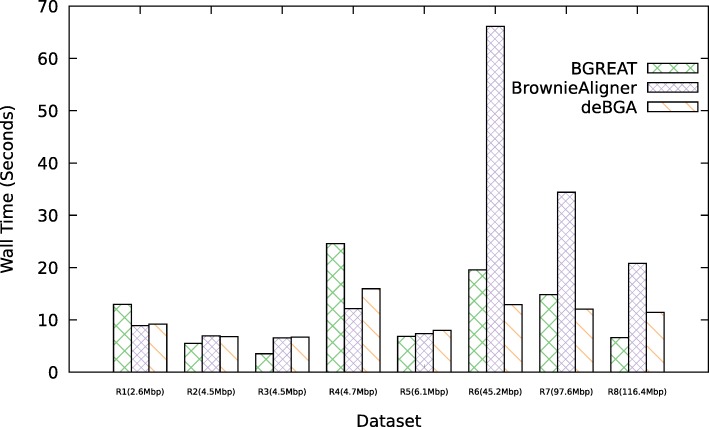
Conclusions: BrownieAligner is applied to both synthetic and real datasets. It generally outperforms other state-of-the-art tools in terms of accuracy, while having similar runtime and memory requirements. Our results show that using the higher-order Markov model in BrownieAligner improves the accuracy, while the branch and bound algorithm reduces runtime. BrownieAligner is written in standard C++11 and released under GPL license. BrownieAligner relies on multithreading to take advantage of multi-core/multi-CPU systems. The source code is available at: https://github.com/biointec/browniealigner.
Keywords: Graph alignment; Illumina; Markov Model; Next-generation sequencing; de Bruijn Graph.
Conflict of interest statement
Ethics approval and consent to participate
Not applicable.
Consent for publication
Not applicable.
Competing interests
The authors declare that they have no competing interests.
Publisher’s Note
Springer Nature remains neutral with regard to jurisdictional claims in published maps and institutional affiliations.
Figures
Similar articles
-
Illumina error correction near highly repetitive DNA regions improves de novo genome assembly.BMC Bioinformatics. 2019 Jun 3;20(1):298. doi: 10.1186/s12859-019-2906-2. BMC Bioinformatics. 2019. PMID: 31159722 Free PMC article.
-
deBGA: read alignment with de Bruijn graph-based seed and extension.Bioinformatics. 2016 Nov 1;32(21):3224-3232. doi: 10.1093/bioinformatics/btw371. Epub 2016 Jul 4. Bioinformatics. 2016. PMID: 27378303
-
Efficient parallel and out of core algorithms for constructing large bi-directed de Bruijn graphs.BMC Bioinformatics. 2010 Nov 15;11:560. doi: 10.1186/1471-2105-11-560. BMC Bioinformatics. 2010. PMID: 21078174 Free PMC article.
-
The present and future of de novo whole-genome assembly.Brief Bioinform. 2018 Jan 1;19(1):23-40. doi: 10.1093/bib/bbw096. Brief Bioinform. 2018. PMID: 27742661 Review.
-
Applications of de Bruijn graphs in microbiome research.Imeta. 2022 Mar 1;1(1):e4. doi: 10.1002/imt2.4. eCollection 2022 Mar. Imeta. 2022. PMID: 38867733 Free PMC article. Review.
Cited by
-
From the reference human genome to human pangenome: Premise, promise and challenge.Front Genet. 2022 Nov 10;13:1042550. doi: 10.3389/fgene.2022.1042550. eCollection 2022. Front Genet. 2022. PMID: 36437921 Free PMC article.
-
Plant graph-based pangenomics: techniques, applications, and challenges.aBIOTECH. 2025 Mar 28;6(2):361-376. doi: 10.1007/s42994-025-00206-7. eCollection 2025 Jun. aBIOTECH. 2025. PMID: 40641648 Free PMC article. Review.
-
Pan-genome de Bruijn graph using the bidirectional FM-index.BMC Bioinformatics. 2023 Oct 26;24(1):400. doi: 10.1186/s12859-023-05531-6. BMC Bioinformatics. 2023. PMID: 37884897 Free PMC article.
-
Label-guided seed-chain-extend alignment on annotated De Bruijn graphs.Bioinformatics. 2024 Jun 28;40(Suppl 1):i337-i346. doi: 10.1093/bioinformatics/btae226. Bioinformatics. 2024. PMID: 38940164 Free PMC article.
-
The Human Pangenome Project: a global resource to map genomic diversity.Nature. 2022 Apr;604(7906):437-446. doi: 10.1038/s41586-022-04601-8. Epub 2022 Apr 20. Nature. 2022. PMID: 35444317 Free PMC article. Review.
References
-
- Grabherr MG, Haas BJ, Yassour M, Levin JZ, Thompson DA, Amit I, Adiconis X, Fan L, Raychowdhury R, Zeng Q, Chen Z, Mauceli E, Hacohen N, Gnirke A, Rhind N, di Palma F, Birren BW, Nusbaum C, Lindblad-Toh K, Friedman N, Regev A. Full-length transcriptome assembly from RNA-Seq data without a reference genome. Nat Biotechnol. 2011;29(7):644–52. doi: 10.1038/nbt.1883. - DOI - PMC - PubMed
MeSH terms
Grants and funding
LinkOut - more resources
Full Text Sources
Other Literature Sources
