. 2018 Nov 29;132(22):2375-2388.
doi: 10.1182/blood-2017-09-804401. Epub 2018 Sep 4.

Altered patterns of global protein synthesis and translational fidelity in RPS15-mutated chronic lymphocytic leukemia

Affiliations

Altered patterns of global protein synthesis and translational fidelity in RPS15-mutated chronic lymphocytic leukemia

Gabriel Bretones et al. Blood. .

Abstract

Genomic studies have recently identified RPS15 as a new driver gene in aggressive and chemorefractory cases of chronic lymphocytic leukemia (CLL). RPS15 encodes a ribosomal protein whose conserved C-terminal domain extends into the decoding center of the ribosome. We demonstrate that mutations in highly conserved residues of this domain affect protein stability, by increasing its ubiquitin-mediated degradation, and cell-proliferation rates. On the other hand, we show that mutated RPS15 can be loaded into the ribosomes, directly impacting on global protein synthesis and/or translational fidelity in a mutation-specific manner. Quantitative mass spectrometry analyses suggest that RPS15 variants may induce additional alterations in the translational machinery, as well as a metabolic shift at the proteome level in HEK293T and MEC-1 cells. These results indicate that CLL-related RPS15 mutations might act following patterns known for other ribosomal diseases, likely switching from a hypo- to a hyperproliferative phenotype driven by mutated ribosomes. In this scenario, loss of translational fidelity causing altered cell proteostasis can be proposed as a new molecular mechanism involved in CLL pathobiology.


Conflict of interest statement

Conflict-of-interest disclosure: The authors declare no competing financial interests.

Figures

None
Graphical abstract
Figure 1.
Figure 1.
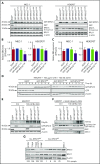
Recurrent RPS15 mutations alter protein stability. (A) MEC-1 and HEK293T cell lines stably expressing the indicated GFP-fusion constructs were subjected to western blot analysis with anti-GFP (for GFP and GFP-RPS15 detection), RPS15, RPL11, and β-actin. Note that RPL11 detection was carried out with the same samples run in parallel on an identical blot. (B) Relative DNA levels of transduced GFP-RPS15 (wild-type and mutants) lentiviral vectors in MEC-1 and HEK293T cells determined by qPCR analysis. ACTB was used as normalization control of endogenous genomic DNA. Data are shown as the mean of 3 independent experiments + standard error of the mean (SEM). (C) Real-time qPCR against GFP-fused RPS15 constructs in the same cell lines as in (B). β-Actin mRNA levels were used as normalization controls. Data are shown as the mean of ≥3 independent determinations + SEM. (D) HEK293T cells stably expressing the GFP-RPS15 forms were treated for the indicated times with 100 mg/mL cycloheximide (CHX) and 100 nM actinomycin D (ACTD). GFP, GFP-RPS15, and β-actin (as a loading control) were detected by immunoblotting. A representative western blot of 2 independent experiments is shown. (E) HEK293T cells stably expressing the GFP-RPS15 forms were treated or not with 100 nM bortezomib (Bz) for 24 hours and subjected to western blot analysis with antibodies against polyubiquitin (PolyUb), RPS15, GFP, and β-actin as a loading control. A representative western blot of 3 independent experiments is shown. (F) Wild-type and mutant GFP-RPS15 forms were transiently coexpressed with 4xHA-tagged ubiquitin in HEK293T cells for 24 hours and incubated in the absence or presence of 100 nM Bz for an additional 12 hours. GFP-tagged RPS15 forms were immunoprecipitated with anti-GFP antibody. Then, hemagglutinin (HA; to detect polyubiquitination), GFP, GFP-RPS15, and RPL11 (as positive control of coimmunoprecipitation) were detected by immunoblotting. (G) Western blot analysis with anti-RPS15, RPL11, and β-actin of a cohort of 4 CLL-RPS15WT and 4 CLL-RPS15MUT patient samples, using MEC-1 cells as control.
Figure 2.
Figure 2.
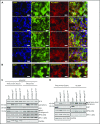
RPS15 mutant proteins are incorporated into ribosomes. (A) Distribution of RPS15 proteins (wild-type and P131S and S138F mutants) fused to GFP in HEK293T cells. rRNA was stained with the RNA-binding dye pyronin Y (PY). Colocalization is shown in merge panels. Scale bars, 20 µm. (B) Immunofluorescence analysis of endogenous RPS15 in GFP-expressing HEK293T cells. Scale bars, 20 µm. (C) Isolation of ribosomes from HEK293T cells stably expressing the GFP-RPS15 constructs and subsequent western blot analysis using antibodies against EF2, GFP, RPS15, RPS6, RPL11, and GAPDH. Note that RPL11, EF2, and GFP detection was carried out with the same samples run in parallel on an identical blot. A representative western blot of 2 independent experiments is shown. (D) Total protein lysates from HEK293T cells stably expressing GFP or the GFP-RPS15 constructs were immunoprecipitated with anti-GFP antibody, and GFP, RPS6 (as a representative ribosomal protein of the 40S subunit), and RPL11 (as a representative ribosomal protein of the 60S subunit) were detected by immunoblotting. Note that RPL11 and RPS6 detection was carried out with the same samples run in parallel on an identical blot. A representative western blot of 2 independent experiments is shown.
Figure 3.
Figure 3.
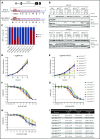
Some RPS15 mutants replace the endogenous protein and show altered proliferation and drug tolerance. (A) Schematic representation of RPS15 locus targeted by the designed single guide RNA (sgRNA), encompassing the second intron and the third exon of RPS15 gene and the corresponding locus in the pCDH-EGFP-RPS15 vector. The common sequence is highlighted in blue. (B) HEK293T cells stably expressing the different RPS15 constructs were infected with the lentiCRISPRv2 vector containing an sgRNA against endogenous RPS15 or no target (empty vector, Ø). Selected subclones were subjected to western blot analysis with antibodies against GFP (for GFP and GFP-RPS15 detection) and RPS15 and β-actin as a loading control. (C) Bar graph showing the percentage of clones with successful ablation of endogenous RPS15 in all of the different mutants, as well as in the wild-type and EGFP constructs. (D) Relative proliferation values of GFP-RPS15–expressing (wild-type and mutants) HEK293T cells transduced with the lentiCRISPRv2-empty (Ø) vector. (E) Relative proliferation values of GFP-RPS15–expressing (wild-type and mutants) HEK293T cells transduced with the lentiCRISPRv2-sgRNA against the endogenous RPS15 locus. Error bars indicate SEM. (F-H) Representative viability curves of selected clones of HEK293T cells transduced with the lentiCRISPRv2-sgRNA against endogenous RPS15 locus and treated with the indicated concentrations of ibrutinib (F), sorafenib (G), and fludarabine (H) for 72 h. (I) Summary table including the 50% inhibitory concentration (IC50 ± SEM) of the different RPS15 constructs using the aforementioned drugs. *P < .033, **P < .002, ***P < .001, two-way ANOVA.
Figure 4.
Figure 4.
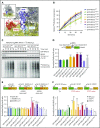
RPS15 mutant proteins alter ribosomal activity at different levels. (A) Global view of RPS15 structure in the context of the ribosome, showing the first amino acids of its C-terminal region extending into the ribosomal decoding center. The figure was generated with UCSF Chimera 1.11.2 (https://www.cgl.ucsf.edu/chimera) by using the structure of the human wild-type ribosome (PDB 5AJ0). The RPS15 protein is shown in a ribbon representation, whereas RNAs are shown as balls and sticks. The rRNAs of the large ribosomal subunit (28S, 5.8S, and 5S) are represented in gray, the rRNA of the small ribosomal subunit (18S) is in yellow, the tRNA is in blue, the mRNA is in cyan, and RPS15 protein (amino acids 12-131) is in red. (B) 35S-Met/Cys incorporation at the different times in protein precipitates from GFP-RPS15–expressing (wild-type or mutants) HEK293T cells. Signal intensities of autoradiography analyses were quantified, and mean values from ≥3 independent experiments are represented. Error bars indicate SEM. *P < .033, **P < .002, ***P < .001, two-way ANOVA. (C) Comparative 35S-Met/Cys incorporation between GFP-RPS15WT, GFP-RPS15P131S, and GFP-RPS15S138F cell lines. A representative autoradiography image and the associated RPS15 and β-actin immunoblots of 3 independent experiments are shown. (D-F) Dual-luciferase assays were performed to quantify cap-independent initiation (D), amino acid misincorporation (E), and stop codon read-through (F) during ribosomal translation in GFP-RPS15–expressing (wild-type or mutants) HEK293T cells. Firefly/renilla or renilla/firefly ratios were set to 1.0 in the case of GFP-RPS15WT–expressing cells (dark blue bars). Each bar represents the mean of 3 independent determinations + SEM. In (D-F), *P < .033, **P < .002, ***P < .001, one- or two-way ANOVA.
Figure 5.
Figure 5.
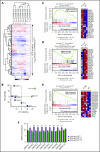
RPS15 mutant proteins alter global cell proteome in HEK293T cells. (A) Heat map depicting unsupervised hierarchical clustering of the 8 proteomes analyzed using the total set of proteins identified. Protein abundance is shown as the log2 ratio between each sample with respect to the average of reference samples (GFP-RPS15WT–expressing HEK293T cells). (B) Principal component analysis of the relative protein abundances of all 8 proteomes analyzed. Principal component analyses show a similar clustering between biological replicates. (C-D) Comparison of proteomic profiles from GFP-RPS15P131S–expressing vs GFP-RPS15WT–expressing HEK293T cells performed using GSEA. (C) Enrichment score plot corresponding to DNA strand elongation in the Reactome database (left panel). Heat map showing the top 18 genes of the positively correlated enriched gene set (right panel). (D) Enrichment plot corresponding to activation of the mRNA upon binding of the CAP-binding complex and eukaryotic initiation factors (eIFs) in the Reactome database (left panel). Heat map showing the 19 top genes of the negatively correlated enriched gene set (right panel). (E) Comparison of proteomic profiles from GFP-RPS15S138F–expressing vs GFP-RPS15WT–expressing HEK293T cells performed using GSEA. The enrichment plot shown corresponds to destabilization of mRNA by KSRP in the Reactome database (left panel). Heat map showing the top 16 genes of the positively correlated enriched gene set (right panel). (F) Relative abundance of different components of the exosome complex. Each bar represents the mean of 2 (GFP-RPS15WT and GFP-RPS15P131S) or 4 (GFP-RPS15S138F) independent relative proteomic determinations + SEM. *P < .033, ***P < .001, multiple t test.

Comment in

Similar articles

Cited by

References

    1. Fabbri G, Dalla-Favera R. The molecular pathogenesis of chronic lymphocytic leukaemia. Nat Rev Cancer. 2016;16(3):145-162. - PubMed
    1. Hamblin TJ, Davis Z, Gardiner A, Oscier DG, Stevenson FK. Unmutated Ig V(H) genes are associated with a more aggressive form of chronic lymphocytic leukemia. Blood. 1999;94(6):1848-1854. - PubMed
    1. Damle RN, Wasil T, Fais F, et al. . Ig V gene mutation status and CD38 expression as novel prognostic indicators in chronic lymphocytic leukemia. Blood. 1999;94(6):1840-1847. - PubMed
    1. Sutton LA, Rosenquist R. The complex interplay between cell-intrinsic and cell-extrinsic factors driving the evolution of chronic lymphocytic leukemia. Semin Cancer Biol. 2015;34:22-35. - PubMed
    1. Guièze R, Wu CJ. Genomic and epigenomic heterogeneity in chronic lymphocytic leukemia. Blood. 2015;126(4):445-453. - PMC - PubMed

Publication types