

Peroxisome proliferator-activated receptor γ (PPARγ) induces the gene expression of integrin αVβ5 to promote macrophage M2 polarization
- PMID: 30181212
- PMCID: PMC6204912
- DOI: 10.1074/jbc.RA118.003161
Peroxisome proliferator-activated receptor γ (PPARγ) induces the gene expression of integrin αVβ5 to promote macrophage M2 polarization
Abstract
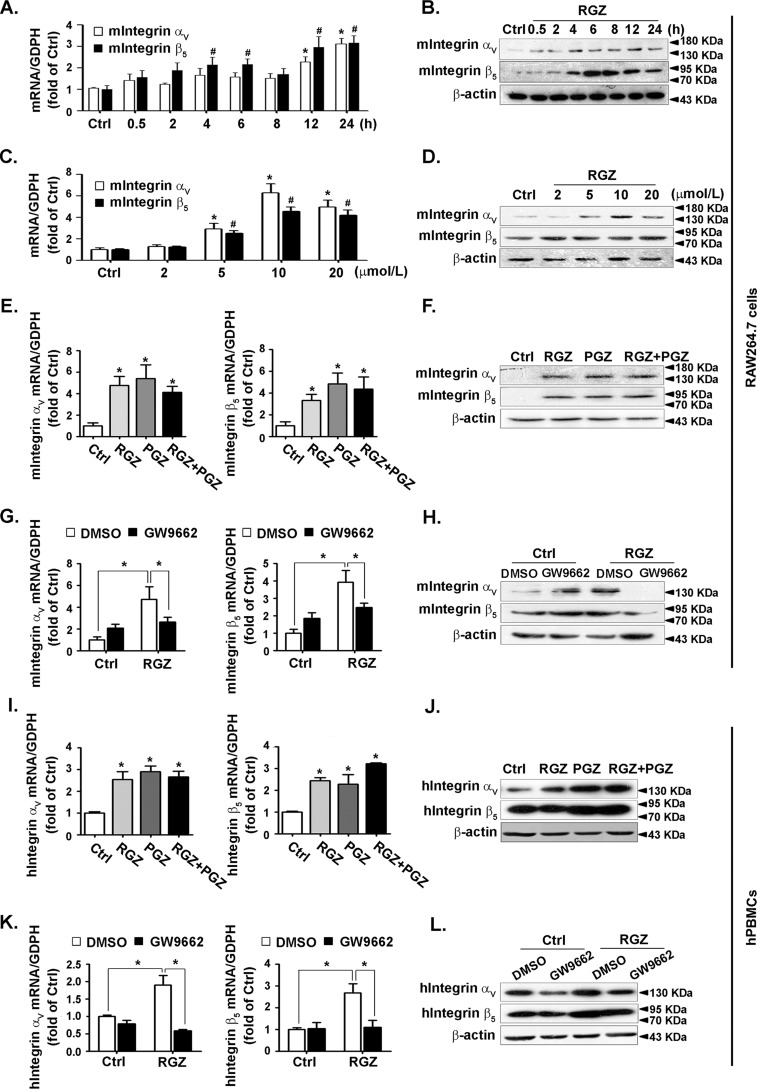
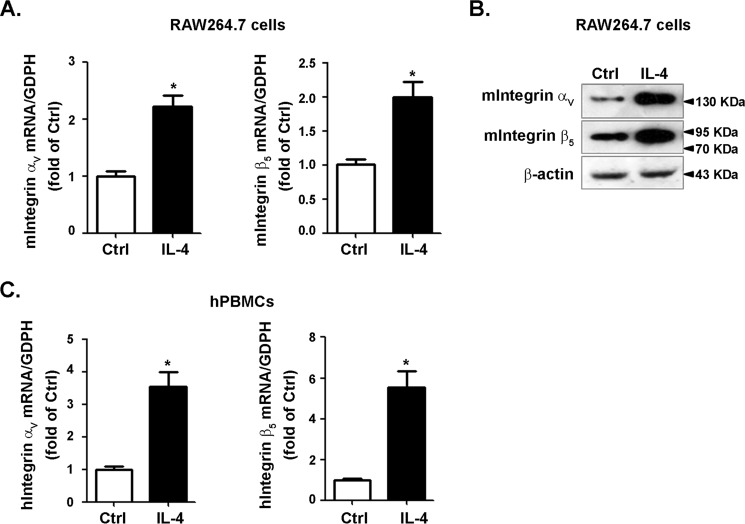
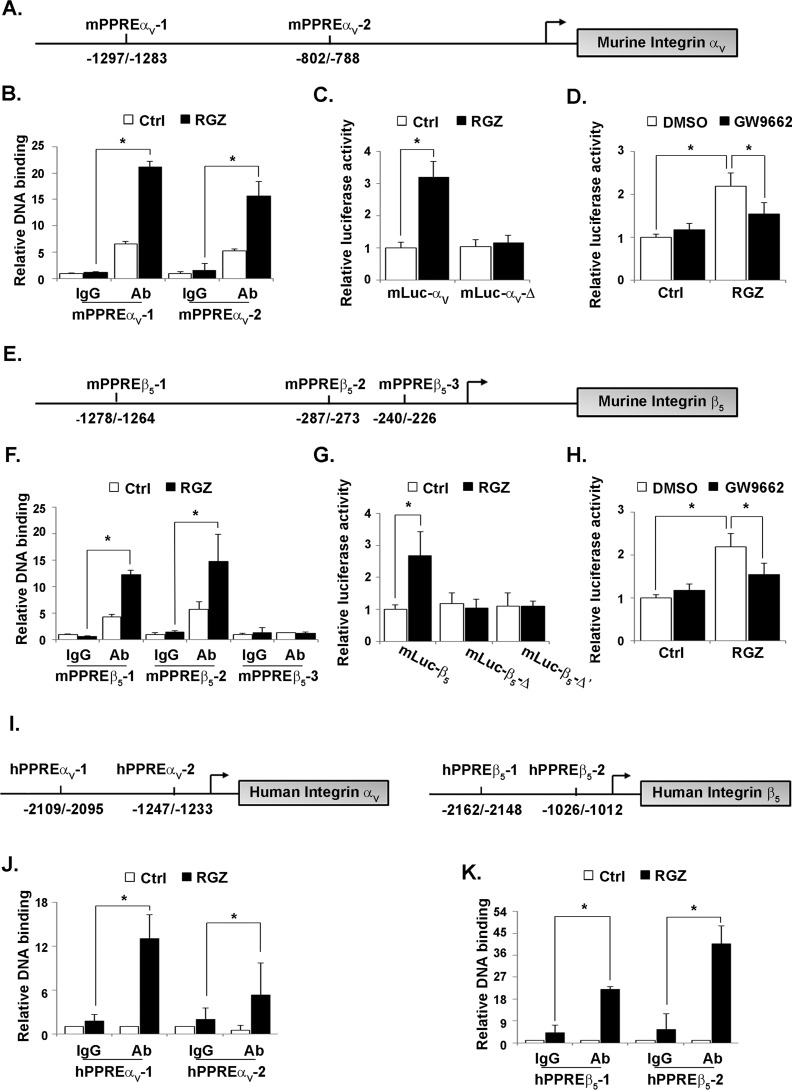
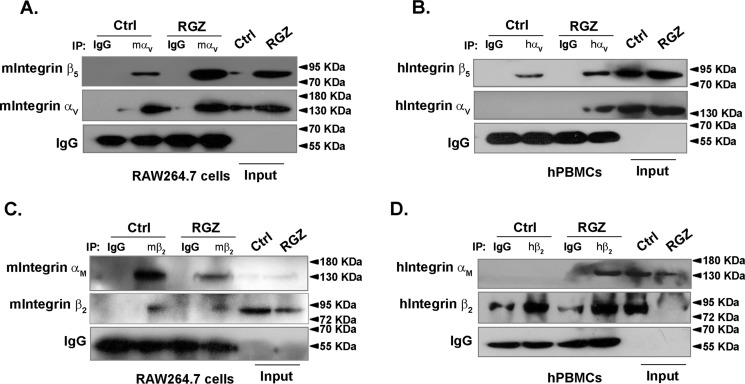
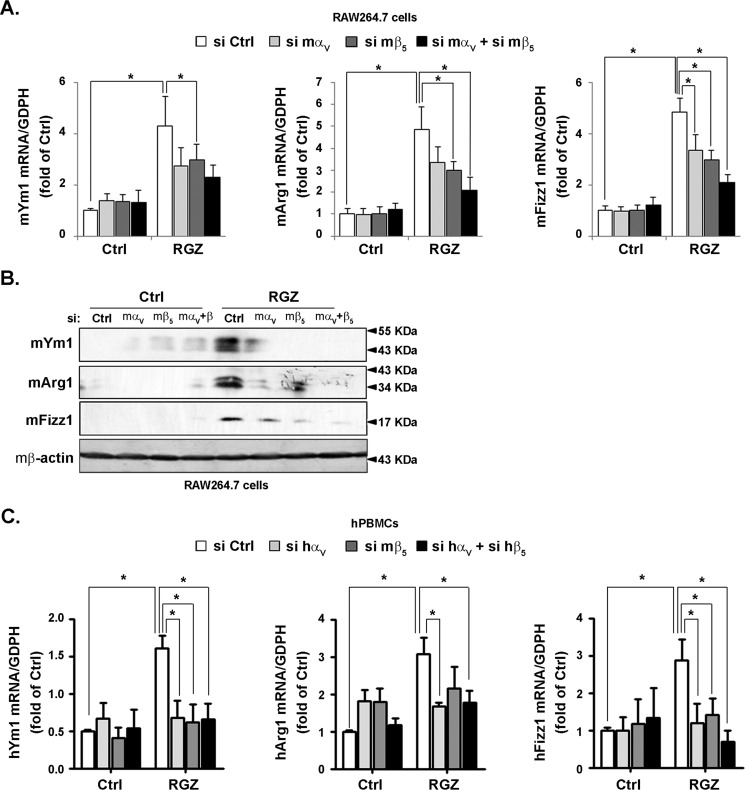
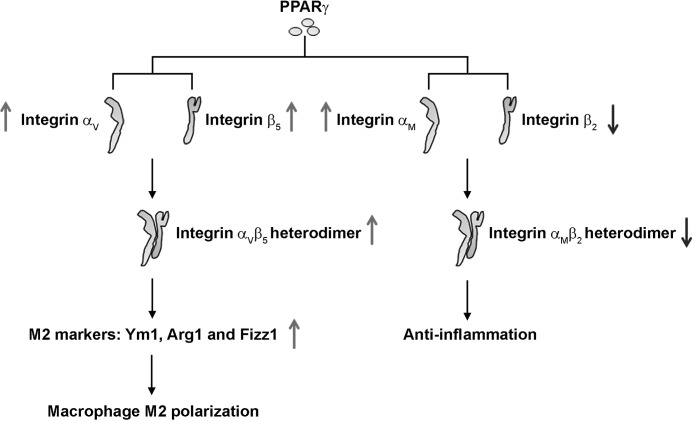
Peroxisome proliferator-activated receptor γ (PPARγ) is a member of the nuclear receptor superfamily and polarizes the macrophages into an anti-inflammatory M2 state. Integrins are transmembrane receptors that drive various cellular functions, including monocyte adhesion and foam cell formation. In this study, we first reported that the expression of integrins αV and β5 was up-regulated by PPARγ activation in RAW264.7 cells and human peripheral blood monocytes. Luciferase reporter and ChIP assay revealed that PPARγ directly bound to the potential PPAR-responsive elements sites in the 5'-flanking regions of both murine and human integrin αV and β5 genes, respectively. In addition, we showed that PPARγ augmented the ligation of integrins αV and β5 Knockdown of integrin αVβ5 by siRNA strategy or treatment with cilengitide, a potent inhibitor of integrin αVβ5, attenuated PPARγ-induced expression of Ym1 (chitinase-like protein 3), Arg1 (Arginase1), Fizz1 (resistin-like molecule RELMα), and other M2 marker genes, suggesting that the heterodimers of integrin αVβ5 were involved in PPARγ-induced M2 polarization. In conclusion, these results provided novel evidence that PPARγ-mediated gene expression and the ensuing ligation of integrins αV and β5 are implicated in macrophage M2 polarization.
Keywords: gene regulation; inflammation; integrin; integrin alpha V; integrin beta 5; macrophage polarization; peroxisome proliferator-activated receptor (PPAR); protein-protein interaction.
© 2018 Yao et al.
Conflict of interest statement
The authors declare that they have no conflicts of interest with the contents of this article
Figures

Similar articles
-
Convallatoxin Promotes M2 Macrophage Polarization to Attenuate Atherosclerosis Through PPARγ-Integrin αvβ5 Signaling Pathway.Drug Des Devel Ther. 2021 Feb 23;15:803-812. doi: 10.2147/DDDT.S288728. eCollection 2021. Drug Des Devel Ther. 2021. PMID: 33654384 Free PMC article.
-
Procyanidin B2 Activates PPARγ to Induce M2 Polarization in Mouse Macrophages.Front Immunol. 2019 Aug 7;10:1895. doi: 10.3389/fimmu.2019.01895. eCollection 2019. Front Immunol. 2019. PMID: 31440258 Free PMC article.
-
M2 polarization of tumor-associated macrophages is dependent on integrin β3 via peroxisome proliferator-activated receptor-γ up-regulation in breast cancer.Immunology. 2020 Aug;160(4):345-356. doi: 10.1111/imm.13196. Epub 2020 Apr 29. Immunology. 2020. PMID: 32311768 Free PMC article.
-
Docosahexaenoic acid induces M2 macrophage polarization through peroxisome proliferator-activated receptor γ activation.Life Sci. 2015 Jan 1;120:39-47. doi: 10.1016/j.lfs.2014.10.014. Epub 2014 Oct 31. Life Sci. 2015. PMID: 25445227
-
Irisin drives macrophage anti-inflammatory differentiation via JAK2-STAT6-dependent activation of PPARγ and Nrf2 signaling.Free Radic Biol Med. 2023 May 20;201:98-110. doi: 10.1016/j.freeradbiomed.2023.03.014. Epub 2023 Mar 20. Free Radic Biol Med. 2023. PMID: 36940733
Cited by
-
Physiological Convergence and Antagonism Between GR and PPARγ in Inflammation and Metabolism.Adv Exp Med Biol. 2022;1390:123-141. doi: 10.1007/978-3-031-11836-4_7. Adv Exp Med Biol. 2022. PMID: 36107316 Review.
-
An instantly fixable and self-adaptive scaffold for skull regeneration by autologous stem cell recruitment and angiogenesis.Nat Commun. 2022 May 6;13(1):2499. doi: 10.1038/s41467-022-30243-5. Nat Commun. 2022. PMID: 35523800 Free PMC article.
-
Role of Liver-Mediated Tolerance in Nanoparticle-Based Tumor Therapy.Cells. 2020 Aug 28;9(9):1985. doi: 10.3390/cells9091985. Cells. 2020. PMID: 32872352 Free PMC article. Review.
-
Nur77 and PPARγ regulate transcription and polarization in distinct subsets of M2-like reparative macrophages during regenerative inflammation.Front Immunol. 2023 Mar 3;14:1139204. doi: 10.3389/fimmu.2023.1139204. eCollection 2023. Front Immunol. 2023. PMID: 36936920 Free PMC article.
-
Convallatoxin Promotes M2 Macrophage Polarization to Attenuate Atherosclerosis Through PPARγ-Integrin αvβ5 Signaling Pathway.Drug Des Devel Ther. 2021 Feb 23;15:803-812. doi: 10.2147/DDDT.S288728. eCollection 2021. Drug Des Devel Ther. 2021. PMID: 33654384 Free PMC article.
References
-
- Guo X., Li T., Xu Y., Xu X., Zhu Z., Zhang Y., Xu J., Xu K., Cheng H., Zhang X., and Ke Y. (2017) Increased levels of Gab1 and Gab2 adaptor proteins skew interleukin-4 (IL-4) signaling toward M2 macrophage-driven pulmonary fibrosis in mice. J. Biol. Chem. 292, 14003–14015 10.1074/jbc.M117.802066 - DOI - PMC - PubMed
Publication types
MeSH terms
Substances
LinkOut - more resources
Full Text Sources
Other Literature Sources
Molecular Biology Databases
Research Materials
Miscellaneous
