. 2018 Nov;8(11):1422-1437.
doi: 10.1158/2159-8290.CD-18-0385. Epub 2018 Sep 4.

Crebbp Loss Drives Small Cell Lung Cancer and Increases Sensitivity to HDAC Inhibition

Affiliations

Crebbp Loss Drives Small Cell Lung Cancer and Increases Sensitivity to HDAC Inhibition

Deshui Jia et al. Cancer Discov. 2018 Nov.

Abstract

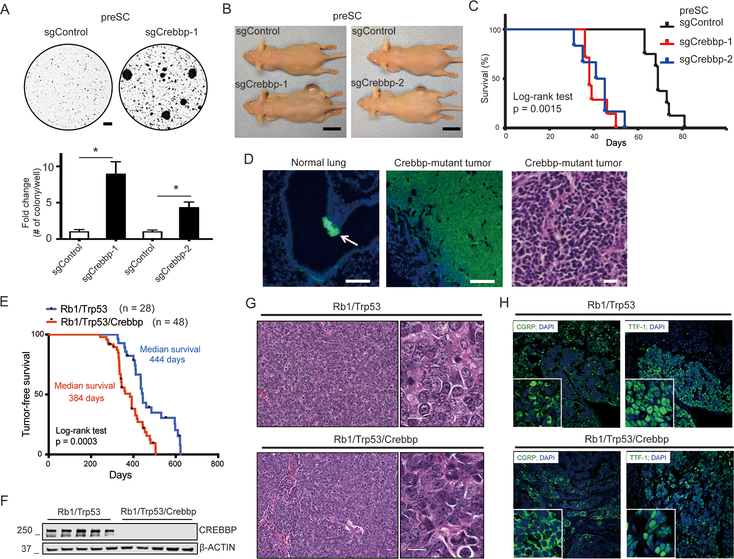
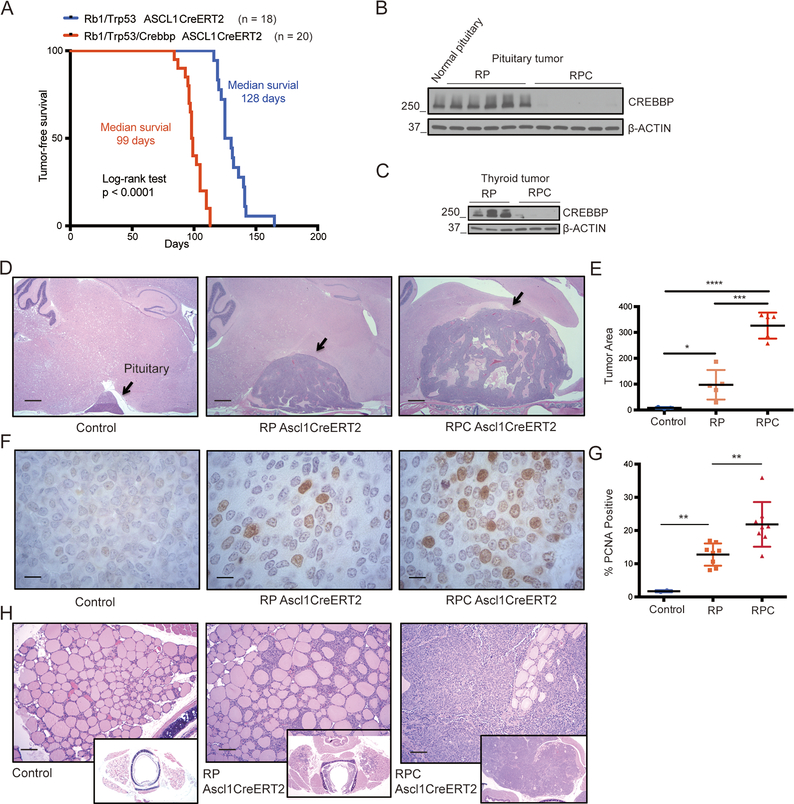
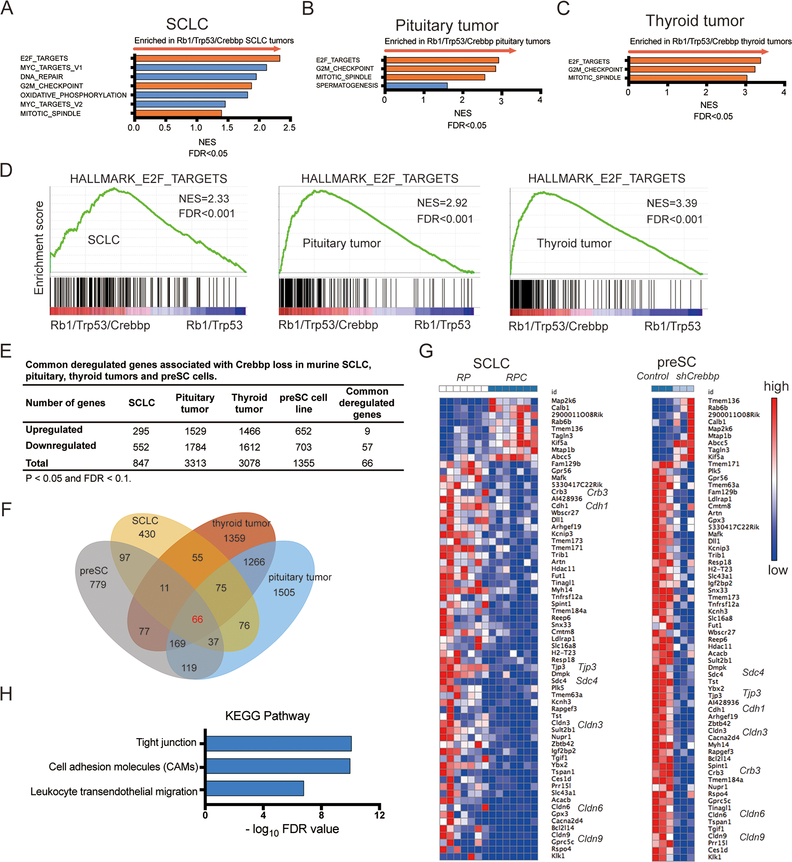
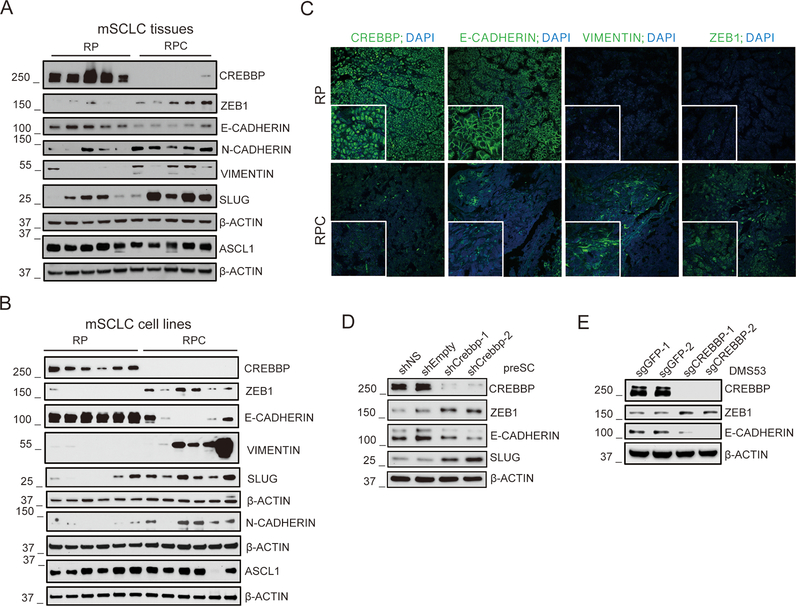
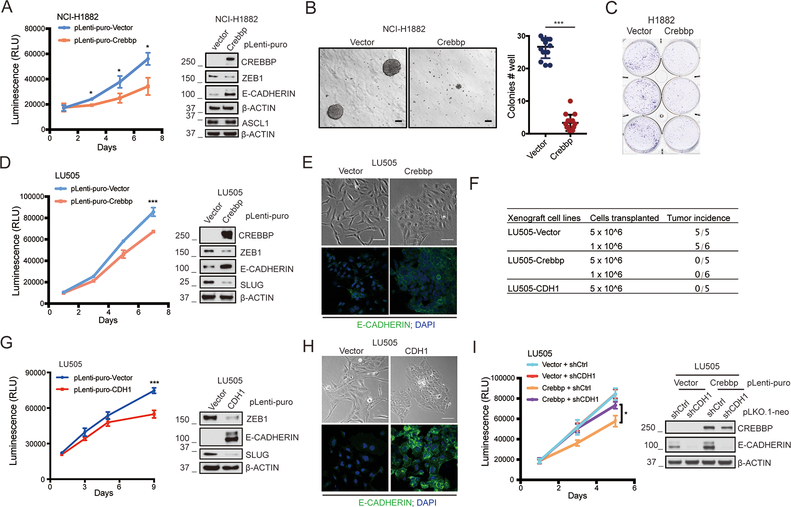
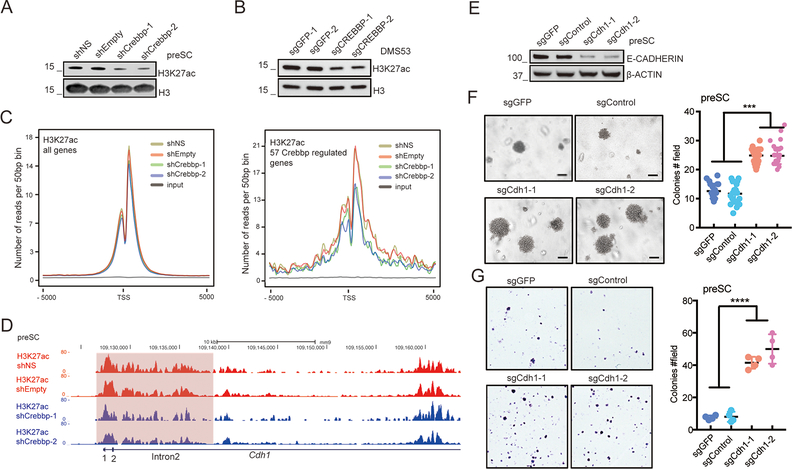
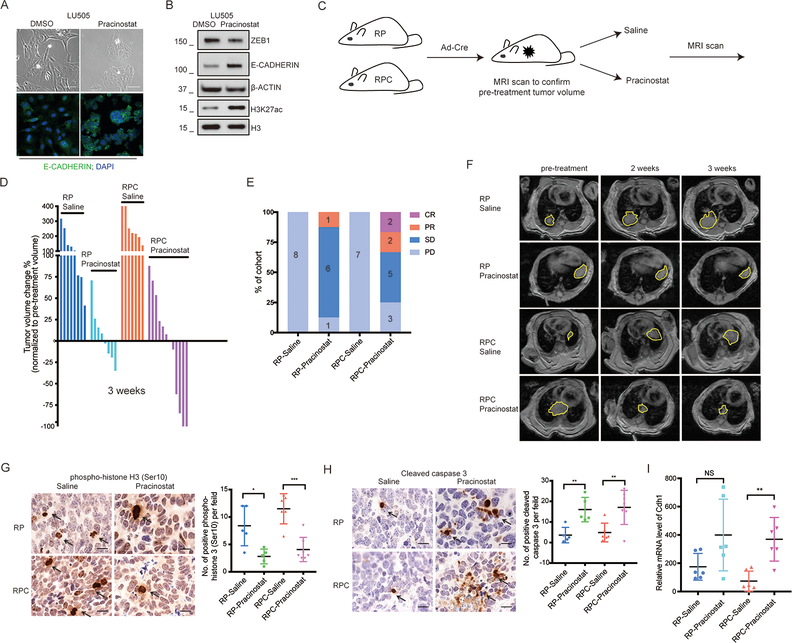
CREBBP, encoding an acetyltransferase, is among the most frequently mutated genes in small cell lung cancer (SCLC), a deadly neuroendocrine tumor type. We report acceleration of SCLC upon Crebbp inactivation in an autochthonous mouse model. Extending these observations beyond the lung, broad Crebbp deletion in mouse neuroendocrine cells cooperated with Rb1/Trp53 loss to promote neuroendocrine thyroid and pituitary carcinomas. Gene expression analyses showed that Crebbp loss results in reduced expression of tight junction and cell adhesion genes, including Cdh1, across neuroendocrine tumor types, whereas suppression of Cdh1 promoted transformation in SCLC. CDH1 and other adhesion genes exhibited reduced histone acetylation with Crebbp inactivation. Treatment with the histone deacetylase (HDAC) inhibitor Pracinostat increased histone acetylation and restored CDH1 expression. In addition, a subset of Rb1/Trp53/Crebbp-deficient SCLC exhibited exceptional responses to Pracinostat in vivo Thus, CREBBP acts as a potent tumor suppressor in SCLC, and inactivation of CREBBP enhances responses to a targeted therapy.Significance: Our findings demonstrate that CREBBP loss in SCLC reduces histone acetylation and transcription of cellular adhesion genes, while driving tumorigenesis. These effects can be partially restored by HDAC inhibition, which exhibited enhanced effectiveness in Crebbp-deleted tumors. These data provide a rationale for selectively treating CREBBP-mutant SCLC with HDAC inhibitors. Cancer Discov; 8(11); 1422-37. ©2018 AACR. This article is highlighted in the In This Issue feature, p. 1333.


Conflict of interest statement

The authors report no conflicts of interest.

Figures

Figure 1
Figure 1. Inactivation of Crebbp accelerates SCLC in mouse models
A, Representative images of control and Crebbp-targeted preSC cells in soft agar 3 weeks after seeding of 1×10⁴ cells. Two independent sgRNAs were employed (sgCrebbp-1, sgCrebbp-2). Bottom: quantification of colonies > 0.1 mm in diameter (n=4). Scale bar = 0.5 mm. B, Images of preSC-derived allografts, 40 days after subcutaneous injection of cells. Scale bar = 1cm. C, Kaplan-Meier overall survival curves of mice injected with control-preSC cells (Control, n= 6) and mice injected with Crebbp-knockout preSC cells (n= 5 each). Statistical significance was calculated using log-rank (Mantel-Cox) test. D, Images of UCHL1-stained sections of Crebbp-mutant tumor and normal lung. Arrow points to neuroepithelial body in the airway. Scale bar = 100μm. Representative section of Crebbp-mutant tumors stained with hematoxylin and eosin (H+E). Scale bar = 20μm. E, Kaplan-Meier tumor-free survival curves of Rb1/Trp53 mutant (blue, n=28) and Rb1/Trp53/Crebbp mutant (red, n=48) mice from autochthonous model infected with Ad-CGRP-Cre (Day 0). Statistical significance was calculated using log-rank (Mantel-Cox) test. F, Representative immunoblotting results of CREBBP protein levels in 5 lung tumor tissues from each cohort (Rb1/Trp53 vs. Rb1/Trp53/Crebbp). Beta-ACTIN was used as a loading control. G, Representative H&E stained section of SCLC in each cohort (Rb1/Trp53 vs. Rb1/Trp53/Crebbp). Scale bar, 20μm. H, Representative immunofluorescence for SCLC markers TTF-1 and CGRP in each cohort (Rb1/Trp53 vs. Rb1/Trp53/Crebbp). DAPI was used as a nuclear stain. Original magnification, 40X.
Figure 2
Figure 2. Crebbp inactivation accelerates pituitary and thyroid neuroendocrine tumors.
A, Kaplan-Meier tumor-free survival curves of double knockout mice (Rb1lox/lox;Trp53lox/lox;ASCL1CreERT2, green, n=18) and triple knockout mice (Rb1lox/lox;Trp53lox/lox;Crebbplox/lox;ASCL1CreERT2 red, n=20). Log-rank (Mantel-Cox) test was used to determine the significance of tumor-free survival between the cohorts. B, Representative immunoblotting results of CREBBP protein levels in pituitary tumors from 5 mice in each cohort. Normal mouse pituitary was used as a control. RPC represents Rb1/Trp53/Crebbp; RP represents Rb1/Trp53. C, Representative immunoblotting showing CREBBP protein levels in thyroid tumors from 3 mice in each cohort. D-E, Mice with the indicated genotypes were euthanized 3 months after tamoxifen (TAM) injection. (D) Representative H&E stained sections showing normal pituitary gland and pituitary tumors, scale bar = 500μm. (E) Average area of pituitary and pituitary carcinomas in each cohort quantified with n= 5 mice in each cohort. Statistical significance was determined by two-tailed unpaired Student’s t- test; *, p<0.05; ***, p<0.001; ****, p<0.0001. F-G, Representative IHC of PCNA in normal pituitary and in pituitary tumors from each cohort. Scale bar = 20μm. (G) Quantification of positive PCNA staining in normal pituitary tissues and pituitary tumors in each cohort. **, p<0.01. H, Representative H&E stained sections of normal thyroid and thyroid tumors from mice in each cohort, 3 months after TAM injection. Scale bar = 500μm. Also see related Figure S4 for images of tumor histology at time of animal morbidity.
Figure 3
Figure 3. Gene expression analyses of CREBBP-perturbed neuroendocrine tumors.
A-C, Gene set enrichment analysis (GSEA) identifies biological processes and pathways enriched in Crebbp-deleted tumors across 3 murine neuroendocrine tumor types (A) SCLC (n=7 Rb1/Trp53/Crebbp vs. 7 Rb1/Trp53), (B) pituitary carcinomas (n=8 Rb1/Trp53/Crebbp vs. 9 Rb1/Trp53), and (C) thyroid c-cell tumors (n= 5 Rb1/Trp53/Crebbp vs. 7 Rb1/Trp53). Red bars show 3 gene sets shared among the three murine neuroendocrine tumor types with FDR<0.05. D, GSEA plots showing the top gene set enriched in the Crebbp-deficient neuroendocrine tumors, “E2F_Targets.” E, Summary of commonly dysregulated genes upon Crebbp deletion in three neuroendocrine tumor types (SCLC, pituitary and thyroid tumors) and Crebbp knockdown preSC cells. p< 0.05 and FDR< 0.1. F, Venn diagram showing 66 genes commonly deregulated in 3 Crebbp-deficient neuroendocrine tumor types compared to Crebbp-wild type controls as well as in preSC cells with lentiviral Crebbp shRNA expression (3 different shRNA sequences included in analysis). G, Heat map of the 66 commonly dysregulated genes with Crebbp suppression in SCLC primary tumors and preSC cells. Red denotes high expression, blue denotes low expression. RPC represents Rb1/Trp53/Crebbp; RP represents Rb1/Trp53. H, KEGG pathway enrichment analysis of 66 differentially expressed genes identified significantly enriched biological pathways such as tight junctions and cell adhesion molecules. Top enriched pathways shown.
Figure 4
Figure 4. Loss of CREBBP induces a partial EMT in SCLC.
A, Immunoblotting of CREBBP, EMT markers (ZEB1, E-CADHERIN, N-CADHERIN, VIMENTIN and SLUG) and neuroendocrine marker ASCL1 in 5 Crebbp wide-type and 5 Crebbp-deficient mouse SCLC tumor tissues. Beta-ACTIN was used as a loading control. B, Immunoblotting of CREBBP, EMT markers (ZEB1, E-CADHERIN, N-CADHERIN, VIMENTIN and SLUG) and neuroendocrine marker ASCL1 in 6 Crebbp wide-type and 6 Crebbp-deleted murine SCLC cell lines. C, Representative images of immunofluorescence staining of CREBBP and EMT markers (E-CADHERIN, VIMENTIN and ZEB1) in Crebbp wide-type and Crebbp-deleted mouse SCLC tumors. Nuclear DNA stained using DAPI. Original magnification, 40×. D, Immunoblotting of CREBBP, ZEB1, E-CADHERIN and SLUG protein levels in murine preSC cells with or without Crebbp knockdown using shRNAs. Beta-ACTIN was used as loading control. E, Immunoblotting of CREBBP, ZEB1 and E-CADHERIN protein levels in human SCLC cell line DMS53 with or without CREBBP knockout using sgRNAs. Beta-ACTIN was used as loading control.
Figure 5
Figure 5. CREBBP re-expression in CREBBP-deleted human SCLC cells inhibits transformation
A, CellTiter-Glo viability assay of ectopic expression of CREBBP in human CREBBP-deficient NCI-H1882 cells (n= 3 independent experiments). *, p<0.05. Immunoblotting of CREBBP, ZEB1, ASCL1 and E-CADHERIN were performed in these cells. B, Anchorage-independent assay to test impact of CREBBP overexpression on growth of NCI-H1882 cells in soft agar. Cells were seeded at 1.0×10⁵ cells/well (6 well plate). n = 3 independent experiments. ***, p<0.001. C, Colony formation assay to test impact of CREBBP overexpression on ability of NCI-H1882 cells to grow when plated at low density (n= 3 independent experiments). 3 representative technical replicates per condition were shown. D, CellTiter-Glo viability assay of CREBBP overexpression in human CREBBP-deficient LU505 cells (derived from a PDX tumor). n= 3 independent experiments. ***, p<0.001. Immunoblotting of CREBBP, ZEB1, E-CADHERIN and SLUG were performed in these cells. E, Representative phase contrast microscopic photos of LU505 cells with or without CREBBP overexpression (Upper). Scale bar = 100μm. Representative immunofluorescence images of E-CADHERIN staining in LU505 cells with or without CREBBP overexpression (Lower). DAPI was used as a nuclear stain. Original magnification, 40×. F, Summary of differences in tumor-initiating ability of LU505-vector, LU505-CREBBP and LU505-CDH1 cells upon transplantation of 5 × 10⁶ cells or 1 × 10⁶ cells into immunocompromised NSG mice. G, CellTiter-Glo viability assay of CDH1 overexpression in LU505 cells (n= 3 independent experiments). ***, p<0.001. Immunoblotting of ZEB1, E-CADHERIN and SLUG were performed in these cells. H, Representative phase contrast microscopic photos of LU505 cells with or without CDH1 overexpression (Upper). Scale bar = 100μm. Representative immunofluorescence images of E-CADHERIN staining in LU505 cells with or without CDH1 overexpression. DAPI was used to stain nuclear. Original magnification, 40×. I, CellTiter-Glo viability assay of shRNA-mediated CDH1 knockdown on the proliferation suppression induced by CREBBP overexpression in LU505 cells (n= 3 independent experiments). *, p<0.05. Re-expression of CREBBP and knockdown of CDH1 in this cell line were validated by immunoblotting.
Figure 6
Figure 6
Epigenetic control of cell adhesion molecule expression by CREBBP contributes to transformation of SCLC. A, Knockdown of Crebbp decreases global H3K27ac levels in preSC cells. Histone H3 was used as loading control. B, Knockout of CREBBP decreases global H3K27ac level in human SCLC cell line DMS53. Histone H3 was used as loading control. C, Metaplots of the H3K27ac distribution across all transcripts and across the core 57 genes consistently downregulated upon Crebbp suppression in preSC cells and in the 3 neuroendocrine tumor types. Data from two controls (non-silencing shRNA and empty vector) and two Crebbp shRNAs (shCrebbp-1 and shCrebbp-2) along with input are shown. TSS, transcriptional start site. −5000 and 5000 represent base pairs upstream and downstream of the TSS. D, ChIP-seq read density plots shows decreased H3K27ac levels in introns 1 and 2 of Cdh1 in two Crebbp knockdown preSC cells (shCrebbp-1 and shCrebbp-2; blue) compared to two control preSC cells (shNS and shEmpty; red). E, Immunoblotting of E-CADHERIN protein in 2 control preSC cells and 2 sgRNA-mediated Cdh1 knockout preSC cells. Beta-ACTIN was used as loading control. F, Anchorage-independent assay of sgRNA-mediated Cdh1 knockout on the growth ability of preSC cells in soft agar. Representative images of colonies in soft agar are shown. Cells were seeded at 2.5×10⁵ cells/well (6 well plate). The number of colonies from 15 fields was counted. ***, p<0.001. n= 3 independent experiments. Scale bar = 100μm. G, Colony formation assay of Cdh1 knockout on the growth ability of preSC cells. Cells were seeded at 6×10³ cells/well (6 well plate). Representative images are shown. The number of colonies from 4 fields representing the entire well was counted. ****, p<0.0001. n= 3 biological replicates.
Figure 7
Figure 7. Enhanced efficacy of HDAC inhibition with Crebbp mutation in SCLC
A, Representative phase contrast microscopic photos (top) and E-CADHERIN immunofluorescence (bottom) in LU505 cells treated with DMSO or Pracinostat (125nM) for 21 days (Upper). Scale bar = 100μm. DAPI was used to stain nucleus. Original magnification, 40×. B, LU505 SCLC cells treated with DMSO or Pracinostat for 21 days were probed for ZEB1, E-CADHERIN and SLUG (whole cell lysates) and H3K27ac and H3 (acid extraction of histones). C, Schematic of treatment trial with saline (control) and Pracinostat in RP (Rb1/Trp53 mutant) and RPC (Rb1/Trp53/Crebbp mutant) SCLC autochthonous models with lung tumor burden detected by MRI. Pracinostat dosed at 100mg/kg orally, 5 times per week. D, Tumor volume changes (%) based on MRI scan quantification in RP and RPC mice treated with saline and Pracinostat for 3 weeks, normalized to pre-treatment tumor volume. E, Treatment response divided into PD (progressive disease, >30% tumor volume increase), SD (stable disease, < 30% change in tumor volume in either direction), PR (partial regression >30% regression) and CR (>90% regression) in RP and RPC mice treated with saline and Pracinostat. Data are presented as percentage of mice in each treatment group. F, Representative MRI images of the thorax regions of mice treated with saline or Pracinostat at pre-treatment compared to 2- and 3-weeks of treatment in each group. G-H, Representative IHC staining of phospho-histone H3 (Ser10) and cleaved caspase 3 in primary SCLC tumors of mice treated with saline vs. Pracinostat at 3 weeks (end of treatment). Scale bar = 20μm. Data are presented as number of positive phospho-histone H3 (Ser10) cells per field. The p value between different groups was calculated using unpaired student’s t-test. RP-saline, n= 5 mice, RP-Pracinostat, n = 5 mice, RPC-saline, n = 7 mice and RPC-Pracinostat, n = 6 mice. *, p<0.05. **, p<0.01. ***, p<0.001. I, Quantitative reverse-transcription PCR analysis of Cdh1 mRNA levels in primary SCLC tissues derived from RP and RPC mice treated with saline or Pracinostat at 3 weeks. n = 6 mice in each treatment group. NS, not significant. **, p<0.01, unpaired student’s t-test.

Similar articles

Cited by

References

    1. George J, Lim JS, Jang SJ, Cun Y, Ozretic L, Kong G, et al. Comprehensive genomic profiles of small cell lung cancer. Nature 2015;524(7563):47–53 doi 10.1038/nature14664. - DOI - PMC - PubMed
    1. Rudin CM, Durinck S, Stawiski EW, Poirier JT, Modrusan Z, Shames DS, et al. Comprehensive genomic analysis identifies SOX2 as a frequently amplified gene in small-cell lung cancer. Nature genetics 2012. doi 10.1038/ng.2405. - DOI - PMC - PubMed
    1. Augert A, Zhang Q, Bates B, Cui M, Wang X, Wildey G, et al. Small Cell Lung Cancer Exhibits Frequent Inactivating Mutations in the Histone Methyltransferase KMT2D/MLL2: CALGB 151111 (Alliance). Journal of thoracic oncology : official publication of the International Association for the Study of Lung Cancer 2017;12(4):704–13 doi 10.1016/j.jtho.2016.12.011. - DOI - PMC - PubMed
    1. Gazdar AF, Bunn PA, Minna JD. Small-cell lung cancer: what we know, what we need to know and the path forward. Nature reviews Cancer 2017;17(12):725–37 doi 10.1038/nrc.2017.87. - DOI - PubMed
    1. Zehir A, Benayed R, Shah RH, Syed A, Middha S, Kim HR, et al. Mutational landscape of metastatic cancer revealed from prospective clinical sequencing of 10,000 patients. Nat Med 2017;23(6):703–13 doi 10.1038/nm.4333. - DOI - PMC - PubMed

Publication types

MeSH terms