. 2018 Sep 18;115(38):9551-9556.
doi: 10.1073/pnas.1811250115. Epub 2018 Sep 4.

Ultrahigh-throughput functional profiling of microbiota communities

Affiliations

Ultrahigh-throughput functional profiling of microbiota communities

Stanislav S Terekhov et al. Proc Natl Acad Sci U S A. .

Abstract

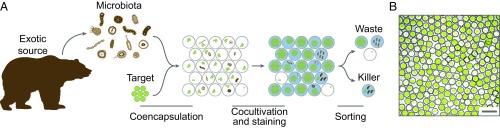
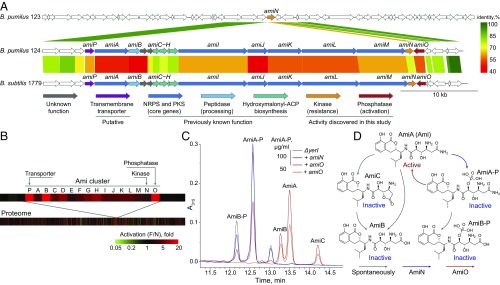
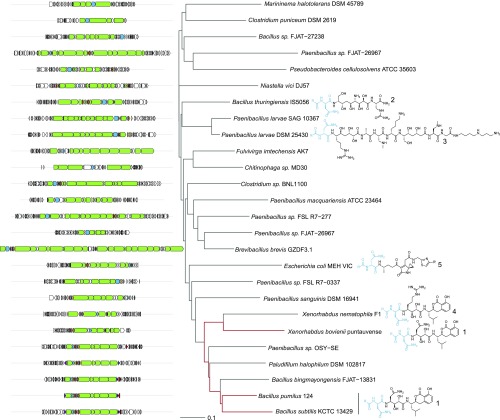
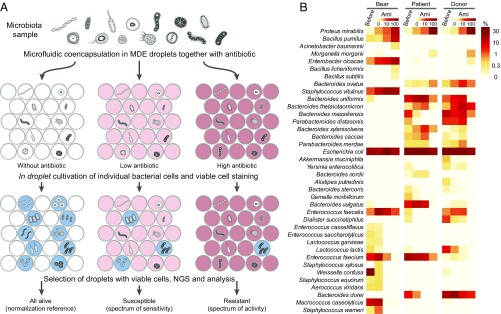
Microbiome spectra serve as critical clues to elucidate the evolutionary biology pathways, potential pathologies, and even behavioral patterns of the host organisms. Furthermore, exotic sources of microbiota represent an unexplored niche to discover microbial secondary metabolites. However, establishing the bacterial functionality is complicated by an intricate web of interactions inside the microbiome. Here we apply an ultrahigh-throughput (uHT) microfluidic droplet platform for activity profiling of the entire oral microbial community of the Siberian bear to isolate Bacillus strains demonstrating antimicrobial activity against Staphylococcus aureus Genome mining allowed us to identify antibiotic amicoumacin A (Ami) as responsible for inhibiting the growth of S. aureus Proteomics and metabolomics revealed a unique mechanism of Bacillus self-resistance to Ami, based on a subtle equilibrium of its deactivation and activation by kinase AmiN and phosphatase AmiO, respectively. We developed uHT quantitative single-cell analysis to estimate antibiotic efficacy toward different microbiomes and used it to determine the activity spectra of Ami toward human and Siberian bear microbiota. Thus, uHT microfluidic droplet platform activity profiling is a powerful tool for discovering antibiotics and quantifying external influences on a microbiome.

Keywords: antibiotic resistance; deep functional profiling; microbiome; microfluidics; single-cell cultivation.


Conflict of interest statement

The authors declare no conflict of interest.

Figures

Fig. 1.
Fig. 1.
(A) Principal scheme of bacteria isolation demonstrating antimicrobial activity against the target S. aureus from oral microbiota of the Siberian bear using the uHT microfluidic droplet platform. The isolated microbiota was coencapsulated with the target pathogen producing a GFP reporter. After in droplet cocultivation, the bacteria were stained and sorted for isolating the droplets with a high initial target load, low GFP level, and high metabolic activity. (B) MDE droplets with coencapsulated target S. aureus cells and microbiota species after in droplet cocultivation. (Scale bar: 50 μm.)
Fig. 2.
Fig. 2.
A multiomics approach applied to discover the regulation of Ami production. (A) NGS and genome mining were used to identify Ami biosynthetic gene clusters. Comparison of Ami biosynthesis gene clusters from producing the B. pumilus 124 strain (NCBI QENN00000000), nonproducing B. pumilus 123 strain (NCBI QENO00000000), and the previously reported B. subtilis 1779 strain (18). Scale bar indicates protein identities. (B) Proteomics was used to determine the borders of the Ami cluster. Differential profile of protein level in activated (F) and inactivated (N) conditions on a proteome level and Ami biosynthetic cluster. Scale bar indicates a fold difference between F and N. (C) Metabolomics was used to confirm the biological functions of AmiN and AmiO. Ami activation via dephosphorylation was observed after amiN knockout and amiO heterologous expression in B. subtilis. (D) General scheme illustrating Ami interconversion by AmiN and AmiO and its spontaneous inactivation by deamidation. AmiA (Ami) denotes amicoumacin A; AmiB and AmiC, amicoumacin B and C; and AmiA-P and AmiB-P, phosphorylated AmiA and AmiB, respectively.
Fig. 3.
Fig. 3.
Representative Ami homologous gene clusters that were identified through genome mining. The core biosynthetic genes are green, the activating peptidases, blue. A neighbor joining tree of different clusters was built based on a reciprocal blast score. The known products of biosynthetic clusters are represented as prodrugs that are further proteolytically processed up to their active form by N-acyl-d-Asn (blue; R, fatty acid residue) cleavage. Preantibiotic forms of 1, amicoumacin A; 2, zwittermicin A; 3, paenilamicin B1; 4, xenocoumacin 1; and 5, proposed colibactin.
Fig. 4.
Fig. 4.
(A) The principal scheme of the activity/sensitivity spectrum assessment using highly heterogeneous bacteria population (microbiota) and MDE screening platform. This figure is instructional and virtually identical to figure 3 of ref. . (B) Heat map indicating the portion of bacteria and influence of Ami on different microbiota samples: oral microbiota of Siberian bear (bear), human fecal microbiota from a patient with colitis (patient), and a healthy human donor (donor). The data were obtained before (before) and after applying MDE screening platform, i.e., single-cell cultivation in droplets with various Ami concentrations (0, 10, and 100 µg/mL), selection of metabolically active population of cells encapsulated in droplets with subsequent metagenomic sequencing and bioinformatic analysis.
Fig. 5.
Fig. 5.
(A) Heat map indicating a shift of microbiota composition after the single-cell cultivation in MDE compartments in the presence of 10 and 100 µg/mL Ami, relative to the respective cultivation without an antibiotic. Indication is represented as follows: bear oral microbiota (B), human fecal microbiota from a patient with colitis (P), a healthy human donor (D). (B) Comparison between MIC predicted using single-cell cultivation in MDE in the presence of Ami (Left, scale with bars) and MIC of clinical isolates measured in vitro (Right, scatterplot). Scale bars (Left) indicate the values of scores obtained from the shift of microbiota composition after single-cell cultivation in MDE compartments in the presence of Ami. The scores enabled us to range bacteria according to their resistance to Ami and subdivide them into groups according to the values of their predicted MIC (<10, 10–100, >100 µg/mL). Each point of the scatterplot (Right) represents MIC measured in vitro for a particular bacterial strain, the horizontal lane represents the range, and the vertical lane indicates the mean.

Similar articles

Cited by

References

    1. Berer K, et al. Commensal microbiota and myelin autoantigen cooperate to trigger autoimmune demyelination. Nature. 2011;479:538–541. - PubMed
    1. Kamada N, Seo S-U, Chen GY, Núñez G. Role of the gut microbiota in immunity and inflammatory disease. Nat Rev Immunol. 2013;13:321–335. - PubMed
    1. Halfvarson J, et al. Dynamics of the human gut microbiome in inflammatory bowel disease. Nat Microbiol. 2017;2:17004. - PMC - PubMed
    1. Weyrich LS, et al. Neanderthal behaviour, diet, and disease inferred from ancient DNA in dental calculus. Nature. 2017;544:357–361. - PubMed
    1. Miller AW, Dale C, Dearing MD. The induction of oxalate metabolism in vivo is more effective with functional microbial communities than with functional microbial species. mSystems. 2017;2:e00088-17. - PMC - PubMed

Publication types

MeSH terms