. 2018 Sep 4;8(1):13213.
doi: 10.1038/s41598-018-31641-w.

Cochaperones enable Hsp70 to use ATP energy to stabilize native proteins out of the folding equilibrium

Affiliations

Cochaperones enable Hsp70 to use ATP energy to stabilize native proteins out of the folding equilibrium

Huafeng Xu. Sci Rep. .

Abstract

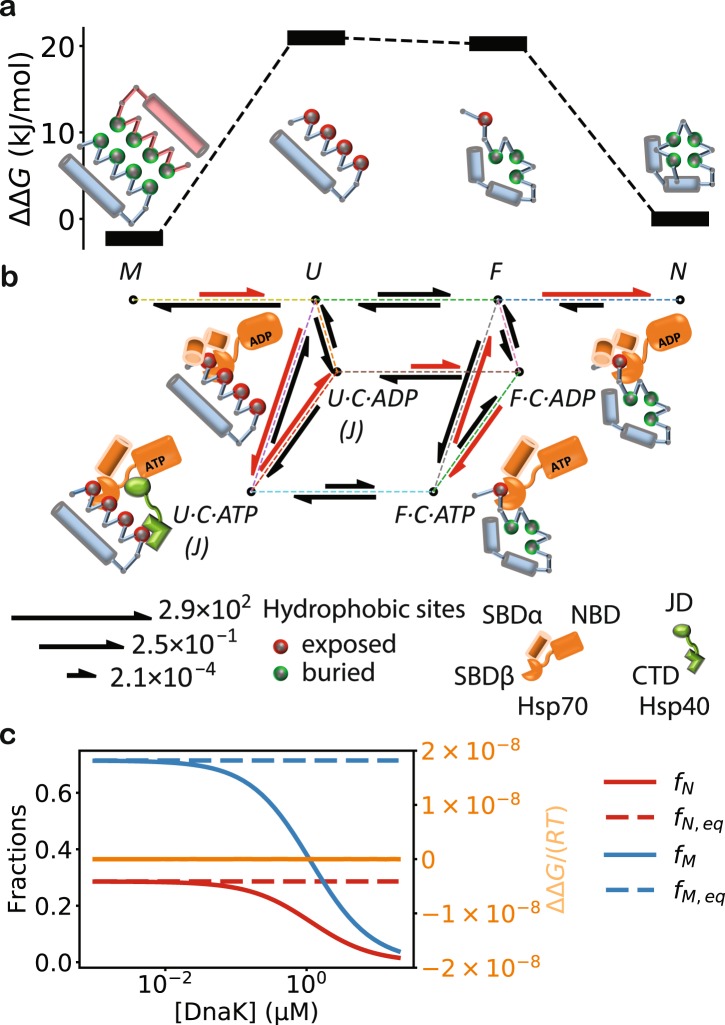
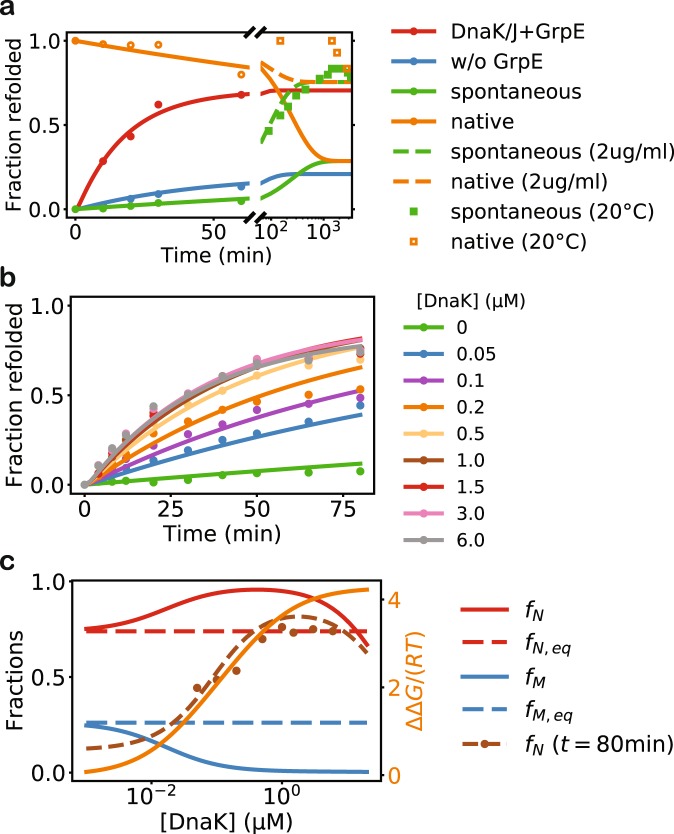
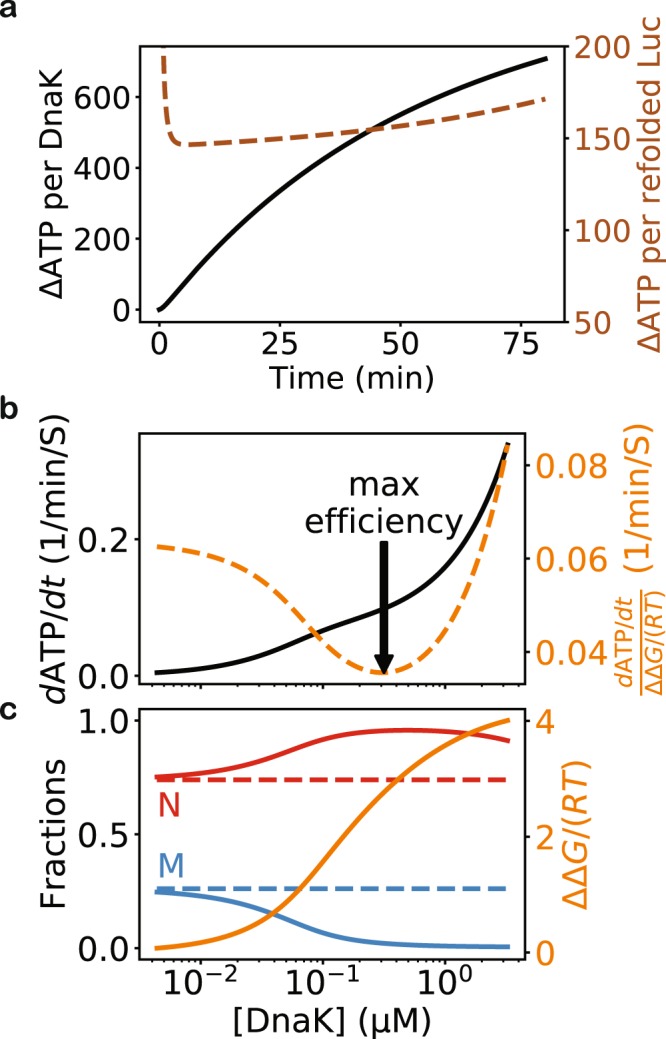
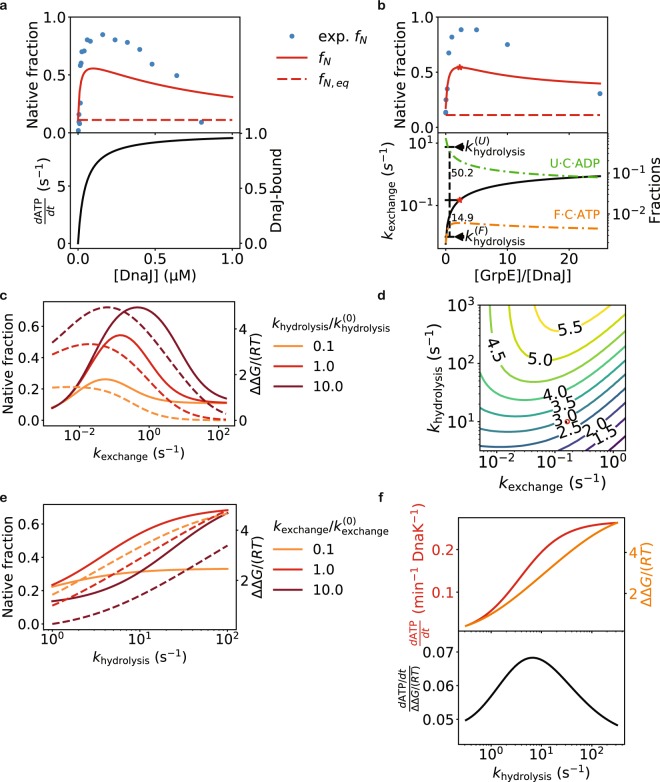
The heat shock protein 70 (Hsp70) chaperones, vital to the proper folding of proteins inside cells, consume ATP and require cochaperones in assisting protein folding. It is unclear whether Hsp70 can utilize the free energy from ATP hydrolysis to fold a protein into a native state that is thermodynamically unstable in the chaperone-free equilibrium. Here I present a model of Hsp70-mediated protein folding, which predicts that Hsp70, as a result of differential stimulation of ATP hydrolysis by its Hsp40 cochaperone, dissociates faster from a substrate in fold-competent conformations than from one in misfolding-prone conformations, thus elevating the native concentration above and suppressing the misfolded concentration below their respective equilibrium values. Previous models would not make or imply these predictions, which are experimentally testable. My model quantitatively reproduces experimental refolding kinetics, predicts how modulations of the Hsp70/Hsp40 chaperone system affect protein folding, and suggests new approaches to regulating cellular protein quality.


Conflict of interest statement

The author declares no competing interests.

Figures

Figure 1
Figure 1
My model of Hsp70/Hsp40/NEF-mediated protein folding. (a) Conformational states in protein folding, and their relative free energies in the absence of chaperones. I assume that there are four conformational states: Misfolded, Unfolded and misfolding-prone, Fold-competent, and Native. The pink and blue chains in the M state may correspond to different molecules (reversibly aggregated) or to different domains in the same molecule. The high free energy barriers associated with the intermediate states U and F slow down the refolding of misfolded proteins. The exemplary free energies are derived from the kinetic parameters fit to the refolding experiments of luciferase at 25 °C (Table 2). (b) The transitions between the microscopic states in the chaperone-mediated folding pathway. S·C·X represents the complex between the substrate in the conformational state S (=U, F) and the Hsp70 chaperone (denoted as C) bound to nucleotide X (=ATP, ADP). The transitions between S and S·C·X correspond to the chaperone binding to and unbinding from the substrate. The transition of S·C·ATP to S·C·ADP corresponds to ATP hydrolysis, and its reverse, nucleotide exchange. Hsp70 binding stabilizes the substrate in the intermediate states, thus catalyzing the folding reaction. Hsp40 (J) can form a ternary complex with the substrate and Hsp70—thus stimulating ATP hydrolysis—if the substrate is in the U state, but not if the substrate is in the F state. Differential ATP hydrolysis by Hsp70 bound to the substrate in the U and F states drives the refolding through the pathway highlighted in red. The lengths of the reaction arrows are linear with respect to the logarithms of the exemplary rate constants (in 1/s) for the DnaK/DnaJ/GrpE-mediated refolding of luciferase at 25 °C (Tables 1 and 2). (c) Without cochaperones, Hsp70 cannot alter the balance between folding and misfolding. DnaK binding to the intermediate states decreases both the native (red) and misfolded (blue) populations, but the ratio between the two remains unchanged from its equilibrium value: ΔΔG = 0 (orange, right y-axis). Here, I have taken ka,CATP(U)/ka,CATP(F)=ka,CADP(U)/ka,CADP(F)=100 to show that differential binding of Hsp70 to the substrate in different conformational states does not alter the folding/misfolding balance.
Figure 2
Figure 2
My model is in good agreement with previous experimental studies of DnaK/DnaJ/GrpE-mediated refolding. (a) The refolding of denatured luciferase under various conditions. The predictions of my model are shown in lines, whereas the experimental data are shown as filled circles. The dashed lines show the spontaneous refolding and denaturation at the much lower substrate concentration of 0.032 μM (2 μg/ml), as in the corresponding experiments (empty circles and squares). The experiments of spontaneous refolding and denaturation were performed at 20 °C, lower than the temperature of 25 °C at which most of the kinetic parameters were obtained. In modeling the refolding, I assume that initially all the protein is in the misfolded state, i.e., fM (t = 0) = 1; in modeling the denaturation, I assume that initially all the protein is in the native state, i.e., fN (t = 0) = 1. (b) The refolding of a luciferase mutant, LucDHis6, in the presence of DnaK at various concentrations. (c) The native fraction (fN = [N]/[S], red) and the misfolded fraction (fM = [M]/[S], blue) of LucDHis6 at the steady state of DnaK-mediated refolding at various DnaK concentrations. The corresponding fractions in the chaperone-free folding equilibrium, fN,eq and fM,eq, are shown as dashed lines. The unitless excess free energy ΔΔG/(RT) is shown in orange (right y-axis). The fractions after 80 min of refolding, starting from misfolded LucDHis6, are shown in brown. My model is in good agreement with the experimental data (filled circles), and it suggests that the refolding is still incomplete even after 80 min. The fitting parameters in my model are given in Table 2, and the conditions of the experiments considered in this paper are summarized in Table 3.
Figure 3
Figure 3
The mechanism by which the Hsp70 chaperone system accelerates refolding and maintains the folding out of equilibrium. (a) The model prediction of the concentrations of different molecular species in DnaK/DnaJ/GrpE-mediated refolding of denatured luciferase. The substrate is primarily held by ADP-bound chaperone in the U state before slowly moving into the native state. (b) The reactive flux at the steady state of LucDHis6 maintained by the DnaK/DnaJ/GrpE chaperone system. The thickness of each line is linear with respect to the logarithm of the absolute value of the reactive flux, and the thicker end of the thin, center line indicates the destination of the flux. The size of the circle at each node is linear with respect to the logarithm of the steady state fraction of the corresponding molecular species. The ATP-driven reaction cycle is highlighted in red.
Figure 4
Figure 4
Free energy consumption in DnaK/DnaJ/GrpE-mediated folding of LucDHis6. (a) ATP consumption in the course of refolding of denatured LucDHis6. The instantaneous rate of ATP consumption is given by dATP/dt=S{U,F}kh(S)([J])[SCATP], and the number of hydrolyzed ATP per molecule of refolded substrate can be estimated by dividing the cumulative consumption, ΔATP=0τdATP, by the number of refolded substrate molecules after time τ. Here, the DnaK concentration is 0.5 μM, and the other kinetic parameters are given in Tables 1 and 2. The black curve shows the number of ATP molecules hydrolyzed per DnaK molecule after the given time. The brown curve shows the number of ATP molecules consumed per one molecule of refolded LucDHis6 (right y-axis) up to the given time, which increases to infinity at the steady state because no additional LucDHis6 is refolded, yet ATP hydrolysis continues. (b,c) ATP hydrolysis at the steady state. The ATP consumption rate per substrate, at various DnaK concentrations, is shown as the black curve in panel b, and the corresponding native (red) and misfolded (blue) fractions at the steady state are shown as solid lines in panel c. The native fraction is above and the misfolded fraction is below their respective equilibrium values (dashed flat lines). The excess free energy ΔΔG/(RT) is shown in orange (right y-axis) in panel c. I can measure the chaperones’ free energy efficiency in maintaining the non-equilibrium by the ratio of the ATP consumption rate to the excess free energy at the steady state (orange, right y-axis, in panel b). The arrow indicates the DnaK concentration at which the chaperones utilize the least amount of ATP per unit of excess free energy.
Figure 5
Figure 5
The capacity of the DnaK/DnaJ/GrpE chaperones to prevent reversible aggregation and to elevate native protein concentrations. (a) The chaperones can prevent aggregation at increasing substrate concentrations. The rate of aggregation is taken to be proportional to the substrate concentration (see Methods). Top: the native and the misfolded steady state concentrations at increasing total LucDHis6 concentrations, with the DnaK concentration fixed at 1.2 μM. Bottom: the DnaK concentration required to maintain the misfolded protein concentration at or below [M]max = 0.01 µM, as well as the steady state concentration of the native substrate at that DnaK concentration. (b) The chaperones can prevent aggregation at decreasing substrate stability. I vary the protein stability by changing the rate constant of conversion, kNF, from the N state to the F state; the corresponding change in the folding free energy ΔΔGfolding is indicated on the top axis. The native and the misfolded concentrations, as well as the DnaK concentration required to prevent aggregation, are shown as in panel a. (c,d) Hsp70 is more efficient at folding substrates with slower conversion between the U and the F states. Here, I take the kinetic parameters of luciferase folding at 25 °C, and simultaneously scale the forward and reverse rates of the reaction UF by the same factor, thus changing the kinetics without affecting the folding equilibrium. The times, t1/2, for the refolding of the misfolded substrate to reach half of the native fraction at equilibrium (spontaneous refolding) or the steady state (mediated by DnaK/DnaJ/GrpE), as well as the excess free energy (orange, right y-axis), are plotted against the hypothetic rates of conversion in c. The native fractions (red, left y-axis) and the excess free energy (orange, right y-axis) at the steady state are plotted against t1/2 of spontaneous refolding in d; the equilibrium native fraction is shown as the red dotted line. (e) The time courses of Hsp70-mediated refolding of the misfolded substrate at different hypothetical rates of conversion between U and F (keeping kUF/kFU constant). Higher steady state native fractions are obtained at the price of longer refolding times.
Figure 6
Figure 6
The rates of Hsp40-catalyzed ATP hydrolysis and NEF-catalyzed nucleotide exchange affect the efficiency of Hsp70-mediated folding. (a) Refolding of luciferase at various DnaJ concentrations. Top: the steady state native fractions predicted by my model, compared to the experimental data of refolding after 30 min at 30 °C. Bottom: the ATP hydrolysis rate (left y-axis) and the fraction of substrate bound to DnaJ (right y-axis). (b) Refolding of luciferase at various GrpE concentrations. Top: the steady state native fractions predicted by my model, compared to the experimental data of refolding after 2 hours at 30 °C. Bottom: the rate of nucleotide exchange at different GrpE concentrations (black line, left y-axis), and the populations of F · C · ATP and U · C · ADP (right y-axis). The optimal GrpE concentration is indicated by the red stars, and the in-plot numbers show the corresponding ratios of the nucleotide exchange rate to the ATP hydrolysis rates in the U and F states. In a and b, the rates of GrpE-catalyzed nucleotide exchange and DnaJ-catalyzed ATP hydrolysis are adjusted for the temperature of 30 °C (see Methods and Table 1). (c) Folding efficiency at different hypothetical rates of nucleotide exchange, for different values of the ATP hydrolysis rate in the U state. Native fractions (solid lines, left y-axis) are diminished at both low and high nucleotide exchange rates. At high rates of nucleotide exchange, the excess free energies (dashed lines, right y-axis) approach zero, indicating that Hsp70 can no longer drive protein folding. (d) The excess free energy as a function of the nucleotide exchange and the DnaJ-catalyzed ATP-hydrolysis rates. The rates used to model DnaK/DnaJ/GrpE-mediated folding at 30 °C are indicated by the red circle. (e) Folding efficiency increases with the DnaJ-catalyzed ATP hydrolysis rate, yielding higher native fractions (solid lines, left y-axis) and larger excessive free energies (dashed lines, right y-axis). (f) Higher ATP hydrolysis rate yields larger excess free energy (orange, right y-axis, top), at the price of higher rate of ATP consumption (red, left y-axis, top). The ratio of the two (bottom) changes only slightly.

Similar articles

Cited by

References

    1. Bukau B, Weissman J, Horwich A. Molecular chaperones and protein quality control. Cell. 2006;125:443–451. doi: 10.1016/j.cell.2006.04.014. - DOI - PubMed
    1. Hartl FU, Bracher A, Hayer-Hartl M. Molecular chaperones in protein folding and proteostasis. Nature. 2011;475:324–332. doi: 10.1038/nature10317. - DOI - PubMed
    1. Balchin D, Hayer-Hartl M, Hartl FU. In vivo aspects of protein folding and quality control. Science. 2016;353:aac4354. doi: 10.1126/science.aac4354. - DOI - PubMed
    1. Herbst R, Schäfer U, Seckler R. Equilibrium intermediates in the reversible unfolding of firefly (Photinus pyralis) luciferase. J. Biol. Chem. 1997;272:7099–7105. doi: 10.1074/jbc.272.11.7099. - DOI - PubMed
    1. Szabo A, et al. The ATP hydrolysis-dependent reaction cycle of the Escherichia coli Hsp70 system DnaK, DnaJ, and GrpE. Proc. Natl. Acad. Sci. 1994;91:10345–10349. doi: 10.1073/pnas.91.22.10345. - DOI - PMC - PubMed

Substances

LinkOut - more resources