Review
. 2018 Oct 1;98(4):2571-2606.
doi: 10.1152/physrev.00057.2017.

From Molecules to Mechanisms: Functional Proteomics and Its Application to Renal Tubule Physiology

Affiliations
Review

From Molecules to Mechanisms: Functional Proteomics and Its Application to Renal Tubule Physiology

Markus M Rinschen et al. Physiol Rev. .

Abstract

Classical physiological studies using electrophysiological, biophysical, biochemical, and molecular techniques have created a detailed picture of molecular transport, bioenergetics, contractility and movement, and growth, as well as the regulation of these processes by external stimuli in cells and organisms. Newer systems biology approaches are beginning to provide deeper and broader understanding of these complex biological processes and their dynamic responses to a variety of environmental cues. In the past decade, advances in mass spectrometry-based proteomic technologies have provided invaluable tools to further elucidate these complex cellular processes, thereby confirming, complementing, and advancing common views of physiology. As one notable example, the application of proteomics to study the regulation of kidney function has yielded novel insights into the chemical and physical processes that tightly control body fluids, electrolytes, and metabolites to provide optimal microenvironments for various cellular and organ functions. Here, we systematically review, summarize, and discuss the most significant key findings from functional proteomic studies in renal epithelial physiology. We also identify further improvements in technological and bioinformatics methods that will be essential to advance precision medicine in nephrology.


Figures

FIGURE 1.
FIGURE 1.
An overview of mechanisms regulating protein functions. Four major aspects controlling protein functions are illustrated. First, the abundance of any particular protein is tightly regulated and determined by the integration of transcriptional regulation, protein translation, and protein degradation processes. Second, numerous posttranslational modifications (PTMs) of proteins play major roles in controlling protein functions and subsequently help determine cellular responses to the changing environment. Acetylation, phosphorylation, and ubiquitinylation are depicted as examples of well-known PTMs. Third, protein intermolecular interactions, including protein-protein, protein-DNA/RNA, and protein-small molecule interactions, which define targets of protein functions, serve as another major regulatory point. Finally, the (re)localization of proteins to specific subcellular regions, such as nucleus, mitochondria, or plasma membrane, governs their appropriate site of action. See text for details.
FIGURE 2.
FIGURE 2.
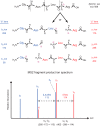
Simplified fragmentation scheme and sequence determination for an example peptide using tandem mass spectrometry. Following ionization and introduction into the vacuum environment of the mass spectrometer system, protonation of the amide nitrogens in the peptide bonds occurs randomly across the population of gas-phase peptide molecules. The schematic structure for a singly-charged example peptide, protonated at the peptide bond between residues 3 and 4, is depicted at the top of the figure. Regardless of which peptide bond is protonated, the entire population of peptide molecules would be detected in the MS1 as the (M+H)+ precursor ion, with mass (m/z) 459. Subsequent transfer of the peptide precursor ions into the collision chamber results in random fragmentation at the peptide bonds (dashed lines), yielding two predominant series of fragment product ions (“b” and “y” ions, as described in the text). For the specific (M+H)+ precursor ion shown as an example in the figure, fragmentation at the indicated peptide bond would produce y1 ions from molecules in which the positive charge remains with the amide nitrogen, or b3 ions from molecules in which the positive charge segregates with the carbonyl carbon (forming an acylium ion) (top). Due to the random peptide bond protonation and fragmentation, a statistical population of all possible y and b ion pairs (top) is generated in the collision chamber. Subsequent analysis of these fragment product ions in the MS2 results in the MS2 spectrum depicted in the lower panel. Subtraction of m/z values for any two consecutive ions in the same series (either “y” or “b”) provides the residue mass (and hence, the identity) of the extra amino acid present in the larger fragment ion. In the example shown, (y3 – y2) = (402 – 288) = 114, identifying asparagine as the NH2-terminal residue in y3; similarly, (b3 – b2) = (285 – 172) = 113, identifying either leucine or isoleucine as the COOH-terminal residue in b3, and so forth. Ultimately, this process (called de novo sequencing) allows deduction of the complete sequence of the original peptide precursor ion. Notes: the diagrams and explanation presented here have been simplified somewhat: 1) for instance, using modern ionization methods and instrumentation, typically the peptide precursor ions (and fragment product ions) are multiply protonated, at the amide nitrogens in the peptide bonds plus the NH2-terminal amine group and/or the R groups of lysine/arginine; 2) as another example, the acylium ion at the COOH-terminus of b ions may undergo a structural rearrangement(s) [e.g., to form a cyclic oxazolone (25, 61, 134)]. Despite this additional “complexity” of multiple charge states and multiple possible structures for b ions, the actual masses of the peptide precursor and product ions are perfectly conserved, and thus the simplified conceptual description presented here is still completely valid.
FIGURE 3.
FIGURE 3.
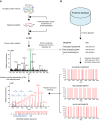
A typical workflow for high-throughput mass spectrometry (MS)-based proteomics. A, top: sample preparation for MS-based proteomics begins with a complex protein mixture of interest that is then subjected to proteolytic digestion. Optional steps, including prefractionation and/or enrichment of a specific subgroup of proteins/peptides, can be performed to increase sensitivity for specialized proteomics experiments. Bottom: the expected result from MS analysis is a large number of complex mass spectra that need to be further processed to identify peptide sequences. B, top: the most commonly used algorithm for peptide sequencing requires a proteome database specific for each experiment (e.g., ideally, the specific proteome for the cell/tissue types and species being investigated). Bottom: theoretical mass spectra generated from a list of possible peptide sequences are matched with the observed spectra, providing an automated interpretation of complex spectra obtained.
FIGURE 4.
FIGURE 4.
Data acquisition techniques for mass spectrometry (MS)-based proteomics. Several modes of data acquisition are illustrated. A: data-dependent acquisition (DDA) is the most common mode for a high-throughput proteomic experiment. This mode provides a high proteome coverage, generating sequences for several thousands of peptides and identification of their cognate proteins, but has limited sensitivity for very-low-abundance peptides. B: data-independent acquisition (DIA) is an emerging technique that strives to measure every peptide in the complex samples by coisolating and fragmenting several peptides together. The resulting spectra are more complicated than DDA spectra and require specialized software for interpretation. C: selected reaction monitoring (SRM) and parallel reaction monitoring (PRM) are collectively considered as techniques for targeted proteomic study. These high-sensitivity techniques can detect lower abundance peptides but require a list of predefined peptide sequences that will be selectively isolated by the first mass spectrometer (MS1) for subsequent fragmentation and analysis by MS2 [using either pre-selected “diagnostic” fragment product ions (SRM) or a full MS2 spectrum (PRM)].
FIGURE 5.
FIGURE 5.
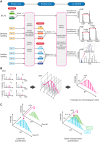
Quantification methods for mass spectrometry (MS)-based proteomics. A: label-based quantification methods incorporate various labeling molecules with different isotopic mass properties into each sample. These techniques can be performed at either the protein or peptide level. The mass difference of labeled peptides is distinguishable by mass spectrometry, enabling the mixing of multiple samples for the same liquid chromatography-tandem mass spectrometry (LC-MS/MS) run. B: diagrams illustrate the principle of an extracted ion chromatogram (XIC). This reconstructed curve integrates ion intensity information from multiple spectra across the dimension of time [i.e., “elution time” or “retention time” (RT)] for a specific peptide. The area under an XIC curve can be used as a measure of abundance for that specific ion (i.e., peptide). C: diagrams illustrate a comparison of label-free vs. stable isotope-based quantification for two different samples (e.g., replicates, or control and experimentally treated samples). While sample preparation is much simpler for label-free methods, stable isotope-based methods reduce the total number of LC-MS/MS analyses required, as well as eliminating (or reducing) chromatographic variation between runs.
FIGURE 6.
FIGURE 6.
Schematic diagram of the nephron and associated collecting ducts. For each renal tubule segment, the major physiological responses that have been studied using proteomic techniques are listed. BBMVs, brush-border membrane vesicles; PTH, parathyroid hormone.
FIGURE 7.
FIGURE 7.
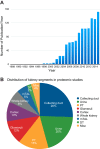
Analysis of kidney-related proteomic studies by category. A: the number of kidney-related proteomic studies appearing in each publication year. This analysis illustrates the rapid increase in proteomics research activity that coincided with completion of the human genome project. B: the distribution among kidney-related proteomic studies for the different anatomical components of the kidney (and urine). DT, distal tubules; mTAL, medullary thick ascending limb; PT, proximal tubules.
FIGURE 8.
FIGURE 8.
Signaling network regulating sodium-potassium-chloride cotransporter (NKCC2) and Na/H exchanger (NHE3) in thick ascending limb (TAL) cells. A proposed signaling network for various stimuli that upregulate NKCC2 and NHE3 activities in TAL cells is shown. Parathyroid hormone (PTH), glucagon, calcitonin, vasopressin, and β-adrenergic agonists mainly activate the adenylyl cyclase/cAMP pathway, which subsequently activates protein kinase A (PKA). Other downstream mediators of cAMP, which phosphorylate T96 of NKCC2 and S552 of NHE3, are still unidentified. The low-chloride hypoosmotic condition also activates NKCC2 through WNK/SPAK/OSR and AMPK pathways. S87 of NKCC2 is also found to be phosphorylated in the low-chloride condition; however, the kinase responsible for this phosphorylation is still unidentified.
FIGURE 9.
FIGURE 9.
Simplified signaling pathway for vasopressin-mediated sodium-chloride cotransporter (NCC) regulation in distal convoluted tubule (DCT) cells. Vasopressin stimulation of DCT cells activates the cAMP, Ca-calmodulin/CAMKK, and phosphatidylinositol 3-kinase (PI3K) second-messenger pathways, which subsequently activate PKA, SGK1, and Akt kinases. Final major effectors of NCC activity are WNK/SPAK/OSR (which phosphorylate NCC) and NEDD4L (which ubiquitinates NCC). Solid black lines represent pathways supported by experimental results for NCC phosphorylation in the presence of specific kinase inhibitors. Dashed lines represent effectors deduced from experiments with other stimuli such as aldosterone. Solid black and dashed gray lines designate stimulatory phosphorylation of NCC, whereas red dashed lines denote inhibitory regulation of NEDD4L, resulting in increased abundance and overall activity of NCC. V2R, vasopressin receptor 2.
FIGURE 10.
FIGURE 10.
Outline depicting proteomic studies designed to elucidate the mechanisms of vasopressin action on the collecting duct. Vasopressin effects on the collecting duct are traditionally divided into short-term effects and long-term effects. The numerous proteomic strategies that have been employed to decipher the detailed mechanism(s) of vasopressin are indicated in the green boxes. AQP2, aquaporin-2; MS, mass spectrometry; SILAC, stable isotope labeling by amino acid in cell culture.
FIGURE 11.
FIGURE 11.
A volcano plot as a visual tool for globally evaluating results from quantitative proteomic experiments. A special kind of scatterplot called “volcano plot” can help visualize the result of a high-throughput study. The x-axis represents the effect size in terms of logarithm (typically base 2) of experimental-to-control expression ratio. The y-axis represents the negative logarithm of P values, which indicate statistical significance. In this example plot, appropriate cutoff values for expression ratios (vertical blue dotted lines; e.g., >50% change) and false discovery rate (FDR) corrected P values (horizontal red dotted line) are shown and used to highlight possible significant and biologically relevant changes. For this example, three proteins (pink data points) are identified as being downregulated in response to the experimental treatment, suggesting a possible molecular mechanism and/or hypothesis for additional studies.
FIGURE 12.
FIGURE 12.
Steps toward new knowledge, knowledge gaps, and potential advances and solutions. The creation of a proteomic list can be improved regarding both qualitative (multidimensional analyses and single-cell/tubule/nephron studies) and quantitative (fractionation techniques and instrumentation) aspects. Bioinformatic interrogation of biological databases cannot be taken as a static process, since these databases are continuously evolving and not always accurate. Thus standardization and quality control of data curation in a dynamic manner are required (191). Functional enrichment analysis is a popular method to identify over- or underrepresented protein groups. This kind of analysis is prone to several sources of bias that can confound the data interpretation, especially in the selection of background comparison list and in the statistical interpretation of high-throughput data (163). Inferential interpretation leading to the formulation of hypotheses and new experiments is a highly complex process. Machine-learning techniques, such as deep learning, have gained much attention over the last few years. Even though these techniques cannot yield an explicit hypothesis or understanding of the underlying mechanisms, they help us draw biologically relevant conclusions from the omics data (23). Lastly, new experiments to validate the previous findings and test new hypotheses are essential, the task that always requires high effort. Automated systems and cloud-based biology are undertaken as a future direction (167a).

Similar articles

Cited by

References

    1. Abbatiello SE, Schilling B, Mani DR, Zimmerman LJ, Hall SC, MacLean B, Albertolle M, Allen S, Burgess M, Cusack MP, Gosh M, Hedrick V, Held JM, Inerowicz HD, Jackson A, Keshishian H, Kinsinger CR, Lyssand J, Makowski L, Mesri M, Rodriguez H, Rudnick P, Sadowski P, Sedransk N, Shaddox K, Skates SJ, Kuhn E, Smith D, Whiteaker JR, Whitwell C, Zhang S, Borchers CH, Fisher SJ, Gibson BW, Liebler DC, MacCoss MJ, Neubert TA, Paulovich AG, Regnier FE, Tempst P, Carr SA. Large-scale interlaboratory study to develop, analytically validate and apply highly multiplexed, quantitative peptide assays to measure cancer-relevant proteins in plasma. Mol Cell Proteomics 14: 2357–2374, 2015. doi:10.1074/mcp.M114.047050. - DOI - PMC - PubMed
    1. Aebersold R, Burlingame AL, Bradshaw RA. Western blots versus selected reaction monitoring assays: time to turn the tables? Mol Cell Proteomics 12: 2381–2382, 2013. doi:10.1074/mcp.E113.031658. - DOI - PMC - PubMed
    1. Aebersold R, Mann M. Mass-spectrometric exploration of proteome structure and function. Nature 537: 347–355, 2016. doi:10.1038/nature19949. - DOI - PubMed
    1. Aken BL, Achuthan P, Akanni W, Amode MR, Bernsdorff F, Bhai J, Billis K, Carvalho-Silva D, Cummins C, Clapham P, Gil L, Girón CG, Gordon L, Hourlier T, Hunt SE, Janacek SH, Juettemann T, Keenan S, Laird MR, Lavidas I, Maurel T, McLaren W, Moore B, Murphy DN, Nag R, Newman V, Nuhn M, Ong CK, Parker A, Patricio M, Riat HS, Sheppard D, Sparrow H, Taylor K, Thormann A, Vullo A, Walts B, Wilder SP, Zadissa A, Kostadima M, Martin FJ, Muffato M, Perry E, Ruffier M, Staines DM, Trevanion SJ, Cunningham F, Yates A, Zerbino DR, Flicek P; Ensembl 2017 . Nucleic Acids Res 45: D635–D642, 2017. doi:10.1093/nar/gkw1104. - DOI - PMC - PubMed
    1. Al-Awqati Q, Oliver JA. Stem cells in the kidney. Kidney Int 61: 387–395, 2002. doi:10.1046/j.1523-1755.2002.00164.x. - DOI - PubMed

Publication types

LinkOut - more resources