. 2018 Sep 1;35(9):1487-1495.
doi: 10.1364/JOSAA.35.001487.

Near-infrared polarimetric imaging and changes associated with normative aging

Near-infrared polarimetric imaging and changes associated with normative aging

Joel A Papay et al. J Opt Soc Am A Opt Image Sci Vis. .

Abstract

With aging, the human retina undergoes cell death and additional structural changes that can increase scattered light. We quantified the effect of normative aging on multiply scattered light returning from the human fundus. As expected, there was an increase of multiply scattered light associated with aging, and this is consistent with the histological changes that occur in the fundus of individuals before developing age-related macular degeneration. This increase in scattered light with aging cannot be attributed to retinal reflectivity, anterior segment scatter, or pupil diameter.


Figures

Fig. 1.
Fig. 1.
The image on the left was calculated using equation 1, from a 22 yr female. Brightness was adjusted to make features visible. The white squares indicate where the 5×5 pixel sample regions are located. The image on the right was calculated from equation 5 for the same subject. The macular bow-tie is present in this image, and was used to locate the fovea.
Fig. 2.
Fig. 2.
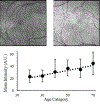
The images on the top were derived from equation 1. The image on the left is from a 22 yr female subject, and the image on the right is from a 75 yr female subject. The plot on the bottom are of the results from all 120 subjects for the images derived from equation 1. Shaded circles indicate the mean intensity for each age group, and the error bars show the range. A linear best fit, shown as the dotted line, follows y=0.4122x+12.639 and has an R-squared value of 0.4445. This implies that there is an increase in multiply scattered light as an effect of age.
Fig. 3.
Fig. 3.
The images on the top are derived from equation 2. The image on the left is from a 22 yr female subject, and the image on the right is from a 75 yr female subject. The plot on the bottom are of the results from all 120 subjects for the images derived from equation 2. Shaded circles indicate the mean intensity for each age group, and the error bars show the range. A linear best fit, shown as the dotted line, follows y=0.1811x+64.481, and has an R-squared value of 0.0538.
Fig. 4.
Fig. 4.
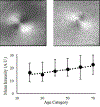
The images on the top are derived from equation 3. The image on the left is from a 22 yr female subject, and the image on the right is from a 75 yr female subject. The plot on the bottom are of the results from all 120 subjects for the images derived from equation 3. Shaded circles indicate the mean intensity for each age group, and the error bars show the range. A linear best fit, indicated by the dotted line, follows y=0.2968x+14.298, and has an R-squared value of 0.3861.
Fig. 5.
Fig. 5.
The images on top are derived from equation 4. The image on the left is from a 22 yr female subject, and the image on the right is from a 75 yr female subject. The plot on the bottom are of the results from all 120 subjects for the images derived from equation 4. Shaded circles indicate the mean intensity for each age group, and the error bars show the range. A linear best fit, indicated by the dotted line, follows y=0.1378x+12.005, and has an R-squared value of 0.2414.
Fig. 6.
Fig. 6.
The images on the top are derived from equation 5. The image on the top left is from a 22 yr female subject, and the image on the top right is from a 75 yr female subject. The plot on the bottom are of the results from all 120 subjects for the images derived from equation 5. Shaded circles indicate the mean intensity for each age group, and the error bars show the range. A linear best fit, indicated by the dotted line, follows y=−0.0504x+14.57, and has an R-squared value of 0.0158. This implies a slight decrease in total ocular birefringence that can be associated with aging.
Fig. 7.
Fig. 7.
The top image is a subsection of the first raw image collected on the parallel detector for this subject. Five locations were selected from the large blood vessel in its highly reflective center. The graph on the bottom is the averaged pixel intensity from the 20 images collected with the crossed detector, at the same five coordinates selected from the top image. A sine curve was fitted to the data for all subjects, as in equation 6. This subject’s curve has an R-squared value of 0.9961. The horizontal dashed line is the average amplitude of the sine wave, and the solid vertical lines are the maximum amplitude of the sine wave.
Fig. 8.
Fig. 8.
Degree of polarization, derived from the image as computed from equation 3. Shaded circles are the mean degree of polarization for each age group, and the error bars indicate the range. A linear best fit, indicated by the dotted line, follows y=−0.0012x+0.9439, and has an R-squared of 0.3861.
Fig. 9.
Fig. 9.
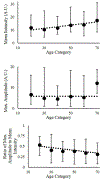
The graph on the top is the average intensity on the crossed detector, determined from fitting a sine curve in the form of y=a+b*sin(c*x+d) to the data. These data are the variable “a”, and can be visualized as the dashed horizontal line in Fig 7. A linear best fit follows y=0.1245x+7.56 and has an R-squared of 0.1525. The graph in the middle is the absolute value of the variable “b” from the fitted sine equation above. This is represented by the vertical lines in Fig 7. A linear best fit follows y=0.0009x+5.704, and has an R-squared of 0.00002. The graph on the bottom is the ratio of the maximum amplitude to the average signal. A linear best fit follows y=−0.0033x+0.5682, and has an R-squared of 0.1583.
Fig. 10.
Fig. 10.
The ratio of the first image type to the value of the average signal to the crossed detector, as determined by fitting a sine wave to the data. Shaded circles are the mean value for each age group, and error bars indicate the range. A linear best fit, indicated by the dotted line, follows y=0.0097x+2.1802, and has an R-squared of 0.0477.
Fig. 11.
Fig. 11.
Degree of polarization, computed from the fitted sine wave data. Shaded circles show the mean value for each age group, and the error bars indicate the range. A linear best fit, indicated by the dotted line, follows y=−0.002x+0.9601, and has an R-squared of 0.4849. A linear regression was significant (p=1.04*10^−18) and had a z-score of 0.8603.
Fig 12.
Fig 12.
Image generated by equation 1 on the left, and equation 12 on the right, for a 70 yr female with dry AMD. There is considerable variation in signal strength across the macular region, with a patchy pattern, considerably different from the systematic change in signal seen Figs. 2 and 4.
Fig 13.
Fig 13.
The top plot is the average variability of the intensity for each of the four sample locations, for five dry AMD subjects and five age-matched controls, for the images generated by equation 1. The two groups were statistically different (p<0.05). The bottom plot is the average variability of the intensity of the four sampled locations for images generated by equation 3, for the same 10 people. The two groups were statistically different as well (p<0.05).

Similar articles

Cited by

References

    1. Sarks JP, Sarks SH, and Killingsworth MC. “Evolution of geographic atrophy of the retinal pigment epithelium,” Eye 2(5), 552–577 (1988). - PubMed
    1. Elsner AE, Burns SA, Beausencourt E, and Weiter JJ. “Foveal cone photopigment distribution: small alterations associated with macular pigment distribution,” Invest Ophthalmol Vis Sci 39, 2394–2404 (1998). - PubMed
    1. Chui TY, Song H, Clark CA, Papay JA, Burns SA, and Elsner AE. “Cone photoreceptor packing density and the outer nuclear layer thickness in healthy subjects,” Invest Ophthalmol Vis Sci 53(7), 3545–3553 (2012). - PMC - PubMed
    1. Jones BW, Pfeiffer RL, Ferrell WD, Watt CB, Tucker J, and Marc RE. “Retinal remodeling and metabolic alterations in human AMD,” Front Cell Neurosci 10, 103 (2016). - PMC - PubMed
    1. Elsner AE, Weber A, Cheney MC, VanNasdale DA, and Miura M, “Imaging polarimetry in patients with neovascular age-related macular degeneration,” J. Opt. Soc. Am. A 24, 1468–1480 (2007). - PMC - PubMed