Review
. 2018 Oct 9;18(20):3061-3073.
doi: 10.1039/c8lc00553b.

Development and application of human skeletal muscle microphysiological systems

Affiliations
Review

Development and application of human skeletal muscle microphysiological systems

George A Truskey. Lab Chip. .

Abstract

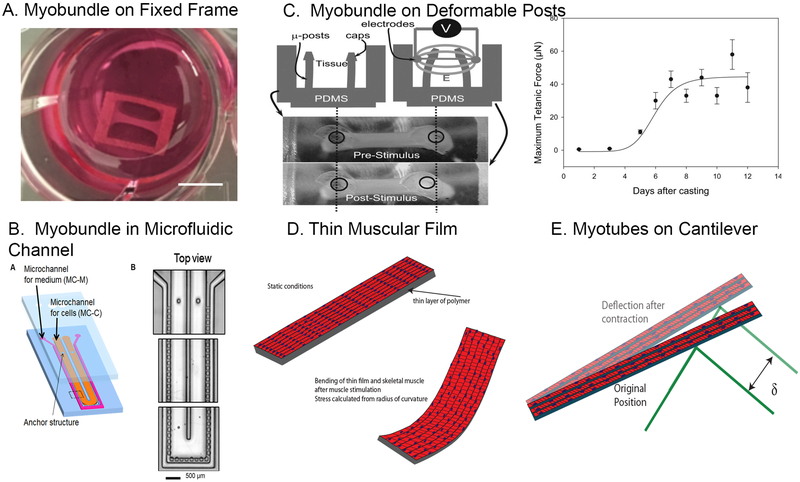
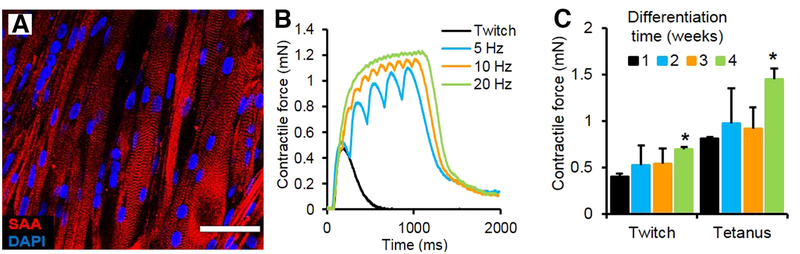
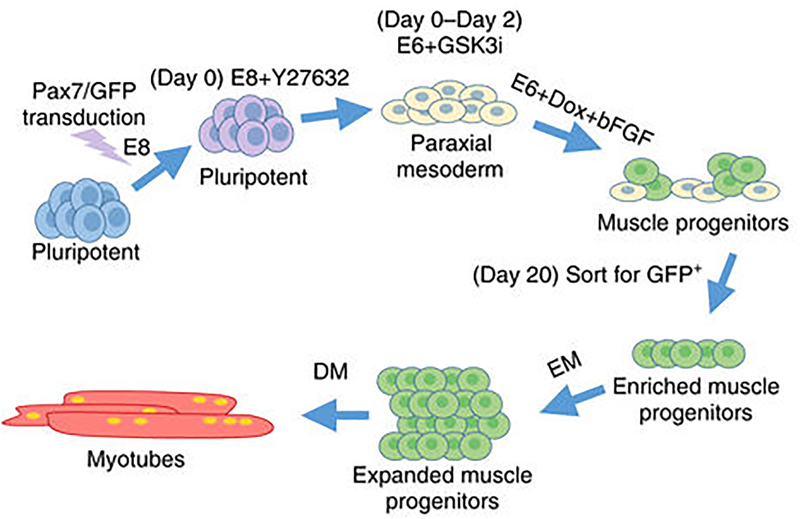
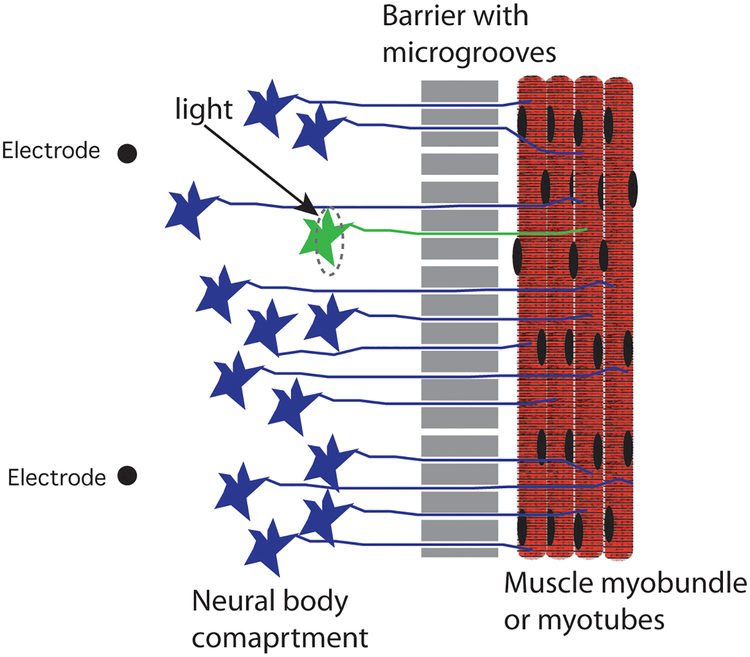
A number of major disease states involve skeletal muscle, including type 2 diabetes, muscular dystrophy, sarcopenia and cachexia arising from cancer or heart disease. Animals do not accurately represent many of these disease states. Human skeletal muscle microphysiological systems derived from primary or induced pluripotent stem cells (hPSCs) can provide an in vitro model of genetic and chronic diseases and assess individual variations. Three-dimensional culture systems more accurately represent skeletal muscle function than do two-dimensional cultures. While muscle biopsies enable culture of primary muscle cells, hPSCs provide the opportunity to sample a wider population of donors. Recent advances to promote maturation of PSC-derived skeletal muscle provide an alternative to primary cells. While contractile function is often measured in three-dimensional cultures and several systems exist to characterize contraction of small numbers of muscle fibers, there is a need for functional measures of metabolism suited for microphysiological systems. Future research should address generation of well-differentiated hPSC-derived muscle cells, enabling muscle repair in vitro, and improved disease models.


Conflict of interest statement

Conflicts of interest

There are no conflicts to declare.

Figures

Figure 1.
Figure 1.
Overview of major types of skeletal muscle microphysiological systems. (A) A skeletal muscle myobundle fabricated with human myoblasts in a fibrin gel attached to a porous nylon frame as in Madden et al. (Photo courtesy of Ringo Yen). (B) Left panel shows a schematic of the microfluidic channel to fabricate and perfuse myobundles. The device consists of consists of an inner hairpin microchannel to prepare skeletal muscle collagen gel myobundles less than 100 mm thick and an outer hairpin channel for the culture media. Posts enable attachment and compaction of collagen gel, allowing orientation of myotubes. (From Shimizu et al. with permission from Elsevier). (C) Aligned myofibers within myobundle attached to deformable posts, showing post deformation of the posts after electrical stimulation. Right panel shows the maturation of the tetanus force over time since fabrication (From Vandenburgh et al. with permission from John Wiley and Sons). (C) Schematic of thin muscular films containing a uniform layer of skeletal myotubes. Aligned myotubes are produced by microcontact printing of extracellular matrix on the deformable polymer. Contraction of the skeletal muscle cells following electrical or optogenetic stimulation causes bending of the myotubes and underlying polymer and the radius of curvature can be related to force. (D) Schematic of the deflection of a cantilever beam induced by contraction of one or more skeletal muscle myotubes attached to the cantilever. The cantilever deflection is measured by the displacement of a laser light that bounces off the cantilever.
Figure 2.
Figure 2.
(A) Aligned myofibers within myobundle exhibiting a striated pattern of the contractile protein sarcomeric α-actinin (SAA). (B) Representative contractile force traces of a 3-week myobundle showing fusion of individual twitches into a stronger tetanic contraction induced by increased stimulation frequency. (C) Twitch and tetanus forces increase over time in culture with significant enhancement at 4 weeks vs 1 week (*p < 0.05, n = 4 myobundles). From Madden et al. and used per a Creative Common license http://creativecommons.org/licenses/by/4.0/.
Figure 3.
Figure 3.
Schematic of the process to produce Pax7+ induced myogenic precursor cells (iMPCs) and formation of myotubes. Dox represents doxycycline, EM represents expansion media, and DM represents differentiation media. From Rao et al. and used per a Creative Common license http://creativecommons.org/licenses/by/4.0/.
Figure 4.
Figure 4.
Schematic of microfluidic chamber to allow motor neuron axons to attach to skeletal myotubes in 2D or 3D arrangements. The microgrooves allow single axons to grow and move in a directed manner towards the myotubes. Localized optogenetic stimulation of the green neuron and axon produces localized muscle contraction.
Figure 5.
Figure 5.
(A) The microfluidic chamber for optogenetic stimulation of nerve and muscle consists of three parallel gel regions. The platform is composed of a top microfluidic layer assembled on top of a PDMS membrane featuring two sets of two capped pillars (inset), itself bonded to a coverslip. The two medium channels enable perfusion of nutrients and drugs. The vacuum channel enables the bonding of the microfluidic layer and pillar layer to the coverslip. Lower panels: Schematic of muscle bundles in a hydrogel innervated by neurospheres located in the opposite gel chamber separated by a 1-mm-wide gel region. Muscle bundles are attached to the two micropillars and contractile forces deflect pillars. (B) Application of glutamate to the medium results in a delayed stimulation of the muscle, leading to the initiation of muscle twitching with force at an increasing frequency (right y axis) as glutamate diffuses within the neurospheres. (C) Force generated by the muscle bundle upon illumination of the ChR2H134R-HBG3-MN neurospheres on day 15. Application of αBTX inhibited the contractions. From Uzel et al. and used per a Creative Common license http://creativecommons.org/licenses/by/4.0/.
Figure 6.
Figure 6.
Effect of 24 h exposure to 10 μM terfenadine on the tetanus force of myobundles in the arrangement show in Figure 1A. The blue curve represents the myobundle force occurring during a 0.8 s electrical stimulation at 20 Hz at the time of application of terfenadine and the green curve represents the tetanus force after 24 h exposure to 10 μM terfenadine. Exposure to the DMSO vehicle in which terfenadine was dissolved did not affect the tetanus force (unpublished results).
Figure 7.
Figure 7.
A. Expanded view of 4 myobundles attached each to an elastic membrane with embedded microparticles that serves as a force transducer for individual myobundles. B. A six well dish with each dish containing a nylon frame with 4 myobundles each attached to an elastic membrane. Adapted from Ref. 100 with permission from The Royal Society of Chemistry.

References

    1. Baron AD, Brechtel G, Wallace P and Edelman SV, Am J Physiol, 1988, 255, E769–E774. - PubMed
    1. Tabebordbar M, Wang ET and Wagers AJ, Annual Review of Pathology: Mechanisms of Disease, 2013, 8, 441–475. - PubMed
    1. Querol L and Illa I, Current Opinion in Neurology, 2013, 26, 459–465. - PubMed
    1. Dalle S, Rossmeislova L and Koppo K, Frontiers in Physiology, 2017, 8. - PMC - PubMed
    1. Hwang H, Bowen BP, Lefort N, Flynn CR, De Filippis EA, Roberts C, Smoke CC, Meyer C, Højlund K, Yi Z and Mandarino LJ, Diabetes, 2010, 59, 33–42. - PMC - PubMed

Publication types

LinkOut - more resources