

Gradient-echo and spin-echo blood oxygenation level-dependent functional MRI at ultrahigh fields of 9.4 and 15.2 Tesla
- PMID: 30183108
- PMCID: PMC6585650
- DOI: 10.1002/mrm.27457
Gradient-echo and spin-echo blood oxygenation level-dependent functional MRI at ultrahigh fields of 9.4 and 15.2 Tesla
Abstract
Purpose: Sensitivity and specificity of blood oxygenation level-dependent (BOLD) functional MRI (fMRI) is sensitive to magnetic field strength and acquisition methods. We have investigated gradient-echo (GE)- and spin-echo (SE)-BOLD fMRI at ultrahigh fields of 9.4 and 15.2 Tesla.
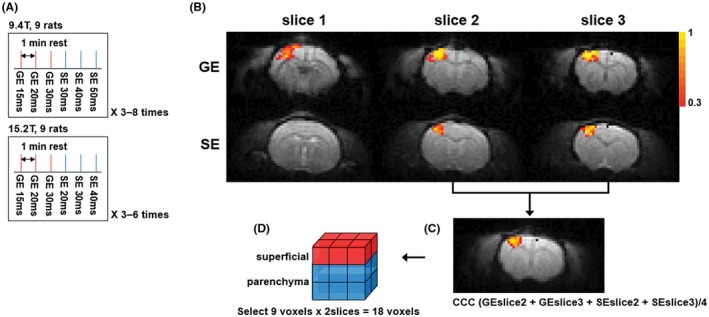
Methods: BOLD fMRI experiments responding to forepaw stimulation were performed with 3 echo times (TE) at each echo type and B0 in α-chloralose-anesthetized rats. The contralateral forelimb somatosensory region was selected for quantitative analyses.
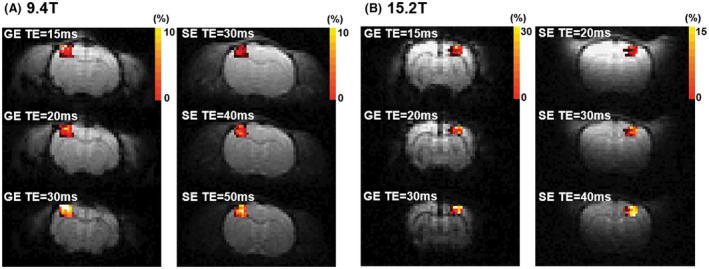
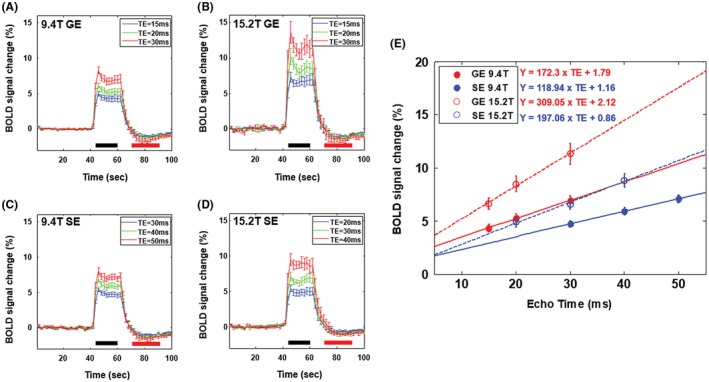
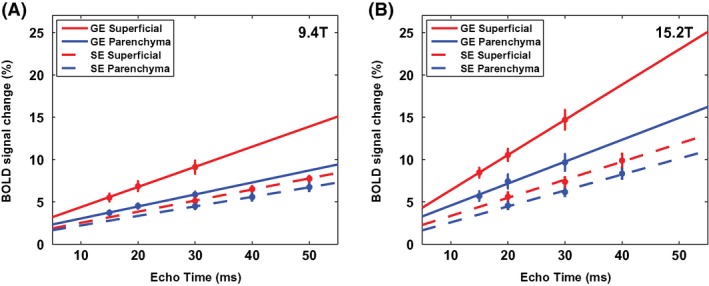
Results: At 9.4 T and 15.2 T, average baseline T2* (n = 9) was 26.6 and 17.1 msec, whereas baseline T2 value (n = 9) was 35.7 and 24.5 msec, respectively. Averaged stimulation-induced ΔR2* was -1.72 s-1 at 9.4 T and -3.09 s-1 at 15.2 T, whereas ΔR2 was -1.19 s-1 at 9.4 T and -1.97 s-1 at 15.2 T. At the optimal TE of tissue T2* or T2 , BOLD percent changes were slightly higher at 15.2 T than at 9.4 T (GE: 7.4% versus 6.4% and SE: 5.7% versus 5.4%). The ΔR2* and ΔR2 ratio of 15.2 T to 9.4 T was 1.8 and 1.66, respectively. The ratio of the macrovessel-containing superficial to microvessel-dominant parenchymal BOLD signal was 1.73 to 1.76 for GE-BOLD versus 1.13 to 1.19 for SE-BOLD, indicating that the SE-BOLD contrast is less sensitive to macrovessels than GE-BOLD.
Conclusion: SE-BOLD fMRI improves spatial specificity to microvessels compared to GE-BOLD at both fields. BOLD sensitivity is similar at the both fields and can be improved at ultrahigh fields only for thermal-noise-dominant ultrahigh-resolution fMRI.
Keywords: BOLD; fMRI; gradient-echo; spin-echo; ultrahigh field.
© 2018 International Society for Magnetic Resonance in Medicine.
Figures
Similar articles
-
Improved laminar specificity and sensitivity by combining SE and GE BOLD signals.Neuroimage. 2022 Dec 1;264:119675. doi: 10.1016/j.neuroimage.2022.119675. Epub 2022 Oct 13. Neuroimage. 2022. PMID: 36243267
-
Diffusion-weighted spin-echo fMRI at 9.4 T: microvascular/tissue contribution to BOLD signal changes.Magn Reson Med. 1999 Nov;42(5):919-28. doi: 10.1002/(sici)1522-2594(199911)42:5<919::aid-mrm12>3.0.co;2-8. Magn Reson Med. 1999. PMID: 10542351
-
Spatial location and strength of BOLD activation in high-spatial-resolution fMRI of the motor cortex: a comparison of spin echo and gradient echo fMRI at 7 T.NMR Biomed. 2012 May;25(5):717-25. doi: 10.1002/nbm.1783. Epub 2011 Sep 22. NMR Biomed. 2012. PMID: 21948326
-
Multi-echo fMRI: A review of applications in fMRI denoising and analysis of BOLD signals.Neuroimage. 2017 Jul 1;154:59-80. doi: 10.1016/j.neuroimage.2017.03.033. Epub 2017 Mar 29. Neuroimage. 2017. PMID: 28363836 Review.
-
Functional magnetic resonance imaging: the basics of blood-oxygen-level dependent (BOLD) imaging.Can Assoc Radiol J. 1998 Oct;49(5):320-9. Can Assoc Radiol J. 1998. PMID: 9803232 Review.
Cited by
-
In vivo magnetic resonance imaging and spectroscopy. Technological advances and opportunities for applications continue to abound.J Magn Reson. 2019 Sep;306:55-65. doi: 10.1016/j.jmr.2019.07.034. Epub 2019 Jul 9. J Magn Reson. 2019. PMID: 31377150 Free PMC article. Review.
-
Accelerated spin-echo functional MRI using multisection excitation by simultaneous spin-echo interleaving (MESSI) with complex-encoded generalized slice dithered enhanced resolution (cgSlider) simultaneous multislice echo-planar imaging.Magn Reson Med. 2020 Jul;84(1):206-220. doi: 10.1002/mrm.28108. Epub 2019 Dec 16. Magn Reson Med. 2020. PMID: 31840295 Free PMC article.
-
Functional MRI of murine olfactory bulbs at 15.2T reveals characteristic activation patters when stimulated by different odors.Sci Rep. 2023 Aug 16;13(1):13343. doi: 10.1038/s41598-023-39650-0. Sci Rep. 2023. PMID: 37587261 Free PMC article.
-
Advanced preclinical functional magnetic resonance imaging of the brain.Npj Imaging. 2025 Jun 18;3(1):27. doi: 10.1038/s44303-025-00085-z. Npj Imaging. 2025. PMID: 40603606 Free PMC article. Review.
-
Hyper BOLD Activation in Dorsal Raphe Nucleus of APP/PS1 Alzheimer's Disease Mouse during Reward-Oriented Drinking Test under Thirsty Conditions.Sci Rep. 2020 Mar 3;10(1):3915. doi: 10.1038/s41598-020-60894-7. Sci Rep. 2020. PMID: 32127559 Free PMC article.
References
-
- Bandettini PA, Wong EC, Hinks RS, Tikofsky RS, Hyde JS. Time course EPI of human brain function during task activation. Magn Reson Med. 1992;25:390–397. - PubMed
Publication types
MeSH terms
Substances
Grants and funding
LinkOut - more resources
Full Text Sources
Other Literature Sources
Medical
