

An Ancestry Informative Marker Set Which Recapitulates the Known Fine Structure of Populations in South Asia
- PMID: 30184103
- PMCID: PMC6143162
- DOI: 10.1093/gbe/evy182
An Ancestry Informative Marker Set Which Recapitulates the Known Fine Structure of Populations in South Asia
Abstract
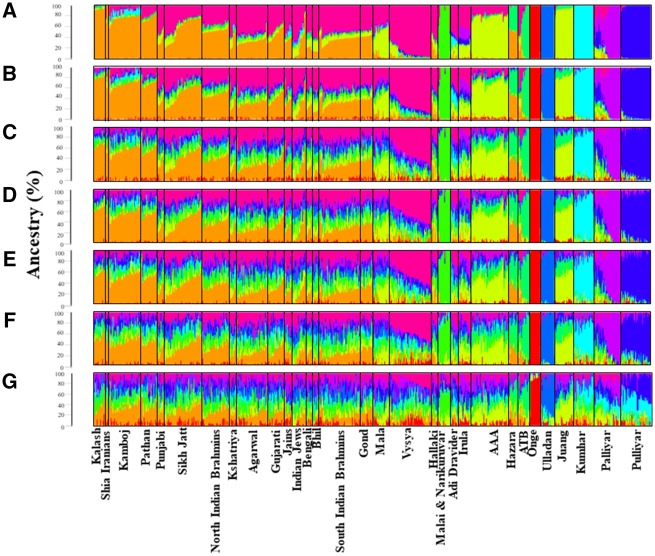
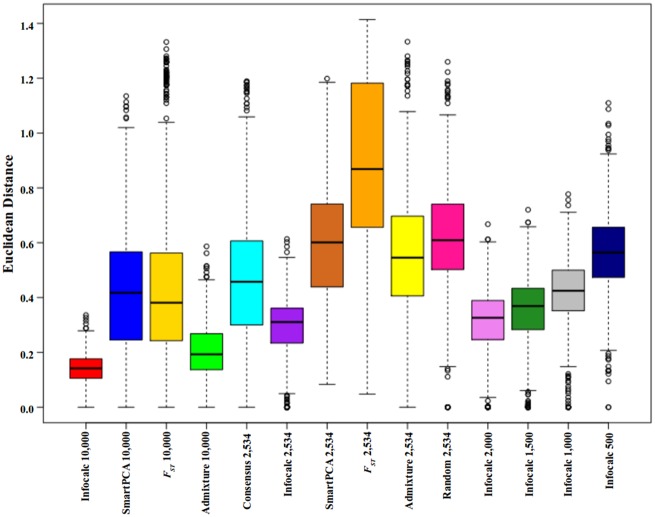
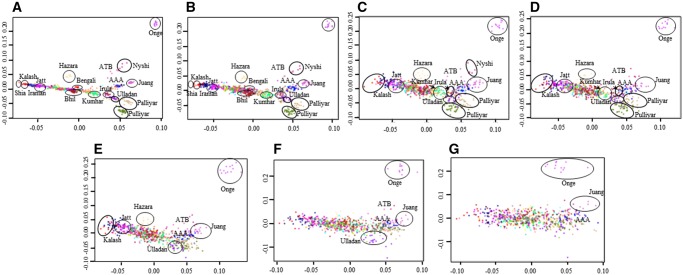
The inference of genomic ancestry using ancestry informative markers (AIMs) can be useful for a range of studies in evolutionary genetics, biomedical research, and forensic analyses. However, the determination of AIMs for highly admixed populations with complex ancestries has remained a formidable challenge. Given the immense genetic heterogeneity and unique population structure of the Indian subcontinent, here we sought to derive AIMs that would yield a cohesive and faithful understanding of South Asian genetic origins. To discern the most optimal strategy for extracting AIMs for South Asians we compared three commonly used AIMs-determining methods namely, Infocalc, FST, and Smart Principal Component Analysis with ADMIXTURE, using previously published whole genome data from the Indian subcontinent. Our findings suggest that the Infocalc approach is likely most suitable for delineation of South Asian AIMs. In particular, Infocalc-2,000 (N = 2,000) appeared as the most informative South Asian AIMs panel that recapitulated the finer structure within South Asian genomes with high degree of sensitivity and precision, whereas a negative control with an equivalent number of randomly selected markers when used to interrogate the South Asian populations, failed to do so. We discuss the utility of all approaches under evaluation for AIMs derivation and interpreting South Asian genomic ancestries. Notably, this is the first report of an AIMs panel for South Asian ancestry inference. Overall these findings may aid in developing cost-effective resources for large-scale demographic analyses and foster expansion of our knowledge of human origins and disease, in the South Asian context.
Figures
Similar articles
-
Using Ancestry Informative Markers (AIMs) to Detect Fine Structures Within Gorilla Populations.Front Genet. 2019 Feb 8;10:43. doi: 10.3389/fgene.2019.00043. eCollection 2019. Front Genet. 2019. PMID: 30800141 Free PMC article.
-
Ancestry informative markers (AIMs) for Korean and other East Asian and South East Asian populations.Int J Legal Med. 2019 Nov;133(6):1711-1719. doi: 10.1007/s00414-019-02129-7. Epub 2019 Aug 7. Int J Legal Med. 2019. PMID: 31388795
-
Establishing a second-tier panel of 18 ancestry informative markers to improve ancestry distinctions among Asian populations.Forensic Sci Int Genet. 2019 Jul;41:159-167. doi: 10.1016/j.fsigen.2019.05.001. Epub 2019 May 10. Forensic Sci Int Genet. 2019. PMID: 31136932
-
Application of geographic population structure (GPS) algorithm for biogeographical analyses of populations with complex ancestries: a case study of South Asians from 1000 genomes project.BMC Genet. 2017 Dec 28;18(Suppl 1):109. doi: 10.1186/s12863-017-0579-2. BMC Genet. 2017. PMID: 29297311 Free PMC article.
-
South Asia: The Missing Diverse in Diversity.Behav Genet. 2024 Jan;54(1):51-62. doi: 10.1007/s10519-023-10161-y. Epub 2023 Nov 2. Behav Genet. 2024. PMID: 37917228 Free PMC article. Review.
Cited by
-
Recapitulating whole genome based population genetic structure for Indian wild tigers through an ancestry informative marker panel.Heredity (Edinb). 2022 Feb;128(2):88-96. doi: 10.1038/s41437-021-00477-y. Epub 2021 Dec 2. Heredity (Edinb). 2022. PMID: 34857925 Free PMC article.
-
Genetic ancestry plays a central role in population pharmacogenomics.Commun Biol. 2021 Feb 5;4(1):171. doi: 10.1038/s42003-021-01681-6. Commun Biol. 2021. PMID: 33547344 Free PMC article.
-
Editorial: Bioinformatics of Genome Regulation and Systems Biology.Front Genet. 2020 Jul 28;11:625. doi: 10.3389/fgene.2020.00625. eCollection 2020. Front Genet. 2020. PMID: 32849761 Free PMC article. No abstract available.
-
The story of the lost twins: decoding the genetic identities of the Kumhar and Kurcha populations from the Indian subcontinent.BMC Genet. 2020 Oct 22;21(Suppl 1):117. doi: 10.1186/s12863-020-00919-2. BMC Genet. 2020. PMID: 33092524 Free PMC article.
References
-
- Barbosa FB, et al. 2017. Ancestry informative marker panel to estimate population stratification using genome-wide human array. Ann Hum Genet. 816:225–233. - PubMed
MeSH terms
LinkOut - more resources
Full Text Sources
Other Literature Sources
Miscellaneous
