. 2018 Sep 4;28(3):463-475.e4.
doi: 10.1016/j.cmet.2018.08.012.

Glycolytic Stimulation Is Not a Requirement for M2 Macrophage Differentiation

Affiliations

Glycolytic Stimulation Is Not a Requirement for M2 Macrophage Differentiation

Feilong Wang et al. Cell Metab. .

Abstract

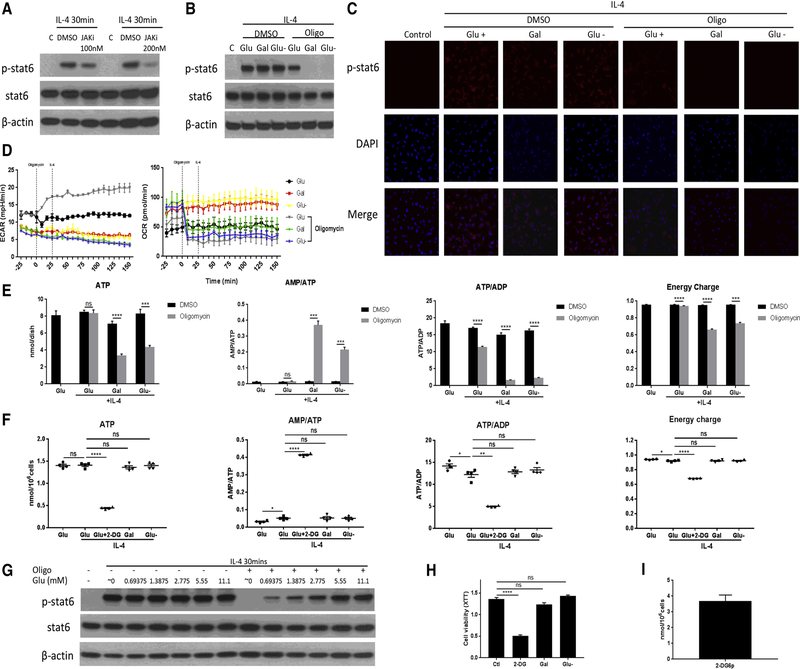
Enhanced glucose uptake and a switch to glycolysis are key traits of M1 macrophages, whereas enhanced fatty acid oxidation and oxidative phosphorylation are the main metabolic characteristics of M2 macrophages. Recent studies challenge this traditional view, indicating that glycolysis may also be critically important for M2 macrophage differentiation, based on experiments with 2-DG. Here we confirm the inhibitory effect of 2-DG on glycolysis, but also demonstrate that 2-DG impairs oxidative phosphorylation and significantly reduces 13C-labeled Krebs cycle metabolites and intracellular ATP levels. These metabolic derangements were associated with reduced JAK-STAT6 pathway activity and M2 differentiation marker expression. While glucose deprivation and glucose substitution with galactose effectively suppressed glycolytic activity, there was no effective suppression of oxidative phosphorylation, intracellular ATP levels, STAT6 phosphorylation, and M2 differentiation marker expression. These data indicate that glycolytic stimulation is not required for M2 macrophage differentiation as long as oxidative phosphorylation remains active.

Keywords: 2-DG; M2 macrophage; alternative stimulation; glucose; glycolysis; interleukin-4; metabolism.


Conflict of interest statement

Declaration of Interests

None for any author.

Figures

Figure 1.
Figure 1.. LPS but not IL-4 induces a glycolytic switch and 2-DG but not glucose depletion inhibits M2 macrophage differentiation
(a)Real-time measurement of ECAR and OCR of BMDMs left unstimulated (−) or stimulated with LPS. Vertical line indicates initial injection of the activator. Data are representative of three independent experiments (n=5, mean ± SEM) (b) Real-time measurement of ECAR and OCR of BMDMs left unstimulated (−) or stimulated with IL-4, vertical line indicates initial injection of the activator. Data are representative of three independent experiments (n=5, mean ± SEM) (c) and (d) BMDMs were incubated in the medium containing 11.1 mM 13C6-glucose for 1 hour, followed by stimulation with LPS (c) or IL-4 (d) for 2 hours, relative amount and 13C-labeled ratio of lactate were measured by GC/MS with natural abundance correction. * p<0.05, *** p<0.001, NS no significant difference. (n=3, mean ± SEM) (e) Immunoblot analysis of IL-1β expression in BMDMs after 6 and 12 hour stimulation with LPS +/− 1 hour pre-treatment with 2-DG (10 mM). Data are representative of three independent experiments (f) Immunoblot analysis of IL-1β expression in BMDMs after 24 and 48 hour stimulation with LPS in the medium with or without glucose. Data are representative of three independent experiments (g) Flow cytometry analysis of PD-L2 and RELMα in BMDMs stimulated with IL-4 for 24 hours in medium containing glucose, glucose + 2-DG (10 mM) or glucose depletion (with FBS final glucose concentration 0.3 mM). Data are representative of three independent experiments
Figure 2.
Figure 2.. Galactose suppresses glycolytic throughout but not M2 differentiation
(a) Real-time measurement of ECAR and OCR of BMDMs incubated in medium containing glucose, galactose or glucose + 10 mM 2-DG for 1 hour, left unstimulated (−) or stimulated with IL-4, vertical line indicates initiation injection of the activator. Data are representative of three independent experiments (n=5, mean ± SEM) (b) - (e) BMDMs were incubated in the medium containing glucose, glucose + 2-DG (10 mM), galactose or glucose depletion (with FBS final glucose concentration 0.3 mM) for 1 hour, followed by stimulation with IL-4 for 2 hours. Intracellular levels of glucose (b), Glucose 6-phosphate (c), lactate (d) and 2-deoxyglucose-6-phosphate (e) were measured by GC/MS. * p<0.05, ** p<0.01, *** p<0.001, **** p<0.0001, NS no significant difference. Data are representative of two independent experiments (n=5, mean ± SEM) (f) Flow cytometry analysis of PD-L2 and RELMα in BMDMs stimulated with IL-4 for 24 hours in medium containing glucose, glucose + 2-DG (10 mM) or galactose. Data are representative of three independent experiments
Figure 3.
Figure 3.. Differential effect of LPS and IL-4 as well as 2-DG and galactose or glucose depletion on 13C6-glucose and 13C5-glutamine labeled TCA cycle metabolites
(a)-(d) BMDMSs were incubated in medium containing 11.1 mM 13C6-glucose for 1 hour, followed by stimulation with IL-4 for 2 hours Relative enrichment of 13C-labeled ratio of TCA cycle metabolites was measured by GC/MS with natural abundance correction. NS no significant difference. Data are representative of two independent experiments (n=3, mean ± SEM) (e)-(h) BMDMs were incubated in medium containing 11.1 mM 13C6-glucose for 1hour, followed by stimulation with LPS for 2 hours. Relative enrichment of 13C-labeled ratio of TCA cycle metabolites was measured by GC/MS with natural abundance correction. * p<0.05, *** p<0.001, **** p<0.0001. Data are representative of two independent experiments (n=3, mean ± SEM) (i)-(m) BMDMs were incubated in medium containing glucose, glucose + 2-DG (10 mM), galactose or or glucose depletion (with FBS final glucose concentration 0.3 mM) for 1 hour, followed by stimulation with IL-4 for 2 hours. Intracellular levels of TCA cycle metabolites were measured by GC/MS. * p<0.05, *** p<0.001, **** p<0.0001, NS no significant difference. Data are representative of two independent experiments (n=5, mean ± SEM) (n)-(r) BMDMs were incubated in the 13C5-glutamine-supplemented (2 mM) medium containing glucose, glucose + 2-DG (10 mM), galactose or or glucose depletion (with FBS final glucose concentration 0.3 mM) for 1 hour, followed by stimulation with IL-4 for 2 hours. Relative enrichment of 13C-labeled ratio of TCA cycle metabolites were measured by GC/MS. * p<0.05, ** p<0.01, *** p<0.001, **** p<0.0001. Data are representative of two independent experiments (n=5, mean ± SEM)
Figure 4.
Figure 4.. Etoxomir and oligomycin differ in their effects on M2 differentiation markers from 2-DG
(a) BMDMs were incubated with or without etomoxir (200 µM) for 1 hour, followed by stimulation with IL-4 for 3 hours and OCR measurement. ** p<0.01. Data are representative of three independent experiments (n=5, mean ± SEM) (b) Raw264.7 cells were treated with or without 2-DG (10 mM) or etomoxir (200 µM) for 1 hour, followed by stimulation with IL-4. OCR profiles were measured at baseline and after indicated injections (n=5) (c) BMDMs were incubated with or without etomoxir (200µM) and oligomycin (1µM) for 1 hour, followed stimulated by IL-4 for 24 hours. PD-L2 and RELMα expression were analyzed by flow cytometry. Data are representative of three experiments (d) 3D (left) and 2D (right) flow cytometry analysis of CD36 expression in BMDMs treated as (b). Data are representative of three experiments
Figure 5.
Figure 5.. STAT-6 signaling, PPARɣ, and CD36 expression is suppressed only by 2-DG but no other intervention including glucose depletion and galactose
(a) Immunoblot analysis of STAT6 phosphorylation in BMDMs stimulated with IL-4 for indicated time +/− 1 hour pre-treatment with or without 2-DG (10 mM). Data are representative of three independent experiments (b) Immunofluorescence staining of p-STAT6 in BMDMs after 3 hour stimulation with IL-4 in medium containing glucose, glucose + 2-DG, galactose or glucose depletion (with FBS final glucose concentration 0.3 mM). Data are representative of two independent experiments (c) Immunoblot analysis of STAT6 phosphorylation in BMDMs stimulated with IL-4 for indicated times, after 1 hour pre-treatment with or without FX11 (80 µM). Data are representative of three independent experiments (d) Immunoblot analysis of STAT6 phosphorylation in BMDMs stimulated with IL-4 for indicated times +/− 1 hour pre-treatment with UK-5099 (100 µM). Data are representative of three independent experiments (e) Immunoblot analysis of STAT6 phosphorylation in BMDMs stimulated with IL-4 for indicated times, after 1 hour pre-treatment with or without etomoxir (200 uM). Data are representative of three independent experiments (f) Immunoblot analysis of STAT6 phosphorylation in BMDMs stimulated with IL-4 for indicated times in medium containing glucose, galactose and glucose depletion (with FBS final glucose concentration 0.3 mM). Data are representative of three independent experiments (g) Immunoblot analysis of PPAR-γ in BMDMs stimulated with IL-4 for 12 hours, after 1 hour pre-treatment with or without 2-DG (10 mM). Data are representative of three independent experiments (h) Immunoblot analysis of PPAR-γ in BMDMs stimulated with IL-4 for 12 hours in the medium containing glucose or galactose. Data are representative of three independent experiments (i) Immunoblot analysis of PPAR-γ in BMDMs stimulated with IL-4 for 12 hours in the medium with or without glucose (with FBS final glucose concentration 0.3 mM). Data are representative of three independent experiments (j) 3D (left) and 2D (right) Flow cytometry analysis of CD36 in BMDMs stimulated with IL-4 in the medium containing glucose, glucose + 2-DG (10 mM), galactose or no glucose (with FBS final glucose concentration 0.3 mM) for 24 hours. Data are representative of three independent experiments
Figure 6.
Figure 6.. 2-DG decreases intracellular ATP content and STAT-6 phosphorylation similar to the combined action of oligomycin with either glucose depletion or galactose
(a) Immunoblot analysis of STAT6 phosphorylation in BMDMs stimulated with IL-4 for 30min following 1 hour pre-treatment with or without ATP competitive inhibitor of JAK (100 or 200 nM). Data are representative of three independent experiments (b) Immunoblot analysis of STAT6 phosphorylation in BMDMs stimulated with IL-4 for 30min in the medium containing glucose, galactose or glucose depletion (Glu-, with the use of standard FBS final glucose concentration 0.3 mM) +/− 30 minutes of pre-treatment with oligomycin A (1 µM). Data are representative of three independent experiments (c) Immunofluorescence staining of p-STAT6 in BMDMs after 30 min stimulation with IL-4 in culture medium with glucose, galactose, or glucose depletion (Glu-, with the use of standard FBS final glucose concentration 0.3 mM) without or with 30 minutes of pre-treatment with oligomycin A (1 µM). Data are representative of two independent experiments (d) Real-time measurement of ECAR and OCR of BMDMs incubated in the medium containing glucose, galactose or glucose depletion (Glu-, with the use of standard FBS final glucose concentration 0.3 mM) for 1 hour, left unstimulated or stimulated with oligomycin (1 µM) and IL-4, vertical line indicates initiation injection of the activator. Data are representative of three independent experiments (n=3–4, mean ± SEM) (e) ATP, AMP/ATP, ATP/ADP and energy charge of RAW264.7 cells stimulated with IL-4 for 30 min in the medium containing glucose, galactose, or glucose depletion (Glu-, with the use of standard FBS final glucose concentration 0.3 mM) +/− 30 minutes of pre-treatment with oligomycin A (1 µM). *** p<0.001, **** p<0.0001, NS no significant difference (n=4, mean ± SEM) (f) Intracellular ATP, AMP/ATP, ATP/ADP and energy charge of BMDMs stimulated with IL-4 for 3 hours in the medium containing glucose, glucose + 2-DG (10 mM), galactose, or glucose depletion (Glu-, with the use of standard FBS final glucose concentration 0.3 mM). * p<0.05, ** p<0.01, **** p<0.0001, NS no significant difference (n=4, mean ± SEM) (g) Immunoblot analysis of STAT6 phosphorylation in BMDMs stimulated with IL-4 for 30 min in culture medium with different glucose concentrations (with the use of standard FBS, minimal glucose concentration 0.3 mM) +/− 30 minutes of pre-treatment with oligomycin A (1 µM). Data are representative of three independent experiments (h) Cell viability of BMDMs cells after stimulation with IL-4 for 12 hours in the medium containing glucose, glucose + 2-DG, galactose, or glucose depletion (with the use of standard FBS, minimal glucose concentration 0.3 mM). **** p<0.0001, NS no significant difference. Data are representative of three independent experiments (n=4, mean ± SEM) (i) BMDMs were incubated in the medium containing 2-DG (10 mM) 1 hour, followed by stimulation with IL-4 for 2 hours. The absolute amount of 2-DG6p was quantified (n=4, mean ± SEM)
Figure 7.
Figure 7.. Dose-dependent effects of 2-DG and glucose on metabolism, intracellular ATP content and differentiation of M2 macrophages
(a) BMDMs were incubated in the medium containing different concentrations of 2-DG for 1 hour, real-time changes in ECAR (a) and OCR (b) were measured in BMDMs stimulated with IL-4, injection indicated by the vertical line. Data are representative of three independent experiments (n=3–4, mean ± SEM) (b) Flow cytometry analysis of PD-L2 and RELMα in BMDMs stimulated with IL-4 for 24 hours in the medium containing different concentrations of 2-DG. Data are representative of three experiments (c) 3D (left) and 2D (right) Flow cytometry analysis of CD36 in BMDMs stimulated with IL-4 for 24 hours in the medium containing different concentrations of 2-DG. Data are representative of three experiments (d) Intracellular ATP, AMP/ATP, ATP/ADP and energy charge of BMDMs stimulated with IL-4 for 3 hours in the medium containing different concentrations of 2-DG. * p<0.05, ** p<0.01, *** p<0.001, **** p<0.0001 as compared to 0 mM. Data are representative of two independent experiments (n=4, mean ± SEM) (e) BMDMs were incubated in the medium without glucose (in distinction to the other experiments, 10% dialyzed FBS was used, which resulted in no detectable glucose, i.e. glucose concentration 0 mM) for 1 hour, real-time changes in ECAR (a) and OCR (b) were measured in BMDMs injected with different concentrations of glucose, followed stimulated with IL-4, and vertical line indicates initiation injection of the glucose and IL-4. Data are representative of three independent experiments (n=5, mean ± SEM) (f) Flow cytometry analysis of PD-L2 and RELMα in BMDMs stimulated with IL-4 for 24 hours in the medium containing different concentrations of glucose (with the use of 10% dialyzed FBS resulting in no detectable glucose, i.e. minimal glucose concentration of 0 mM). Data are representative of three experiments (g) 3D (left) and 2D (right) Flow cytometry analysis of CD36 in BMDMs stimulated with IL-4 for 24 hours in the medium containing different concentrations of glucose (with the use of 10% dialyzed FBS resulting in no detectable glucose, i.e. minimal glucose concentration of 0 mM).. Data are representative of three experiments (h) Intracellular ATP, AMP/ATP, ATP/ADP and energy charge of BMDMs stimulated with IL-4 for 3 hours in the medium containing different concentrations of glucose (with the use of 10% dialyzed FBS resulting in no detectable glucose, i.e. minimal glucose concentration of 0 mM). * p<0.05, ** p<0.01, *** p<0.001 compared with 11.1 mM. Data are representative of two independent experiments (n=4, mean ± SEM). (i) Immunoblot analysis of STAT6 phosphorylation in BMDMs stimulated with IL-4 for indicated times in medium with or without glucose plus 10% dialyzed FBS (resulting in no detectable glucose, i.e. glucose concentration 0 mM). Data are representative of three independent experiments (j) Immunoblot analysis of PPAR-γ in BMDMs stimulated with IL-4 for 12 hours in the medium with or without glucose plus 10% dialyzed FBS (resulting in no detectable glucose, i.e. minimal glucose concentration 0 mM). Data are representative of three independent experiments

References

    1. Akira S, Uematsu S, and Takeuchi O (2006). Pathogen recognition and innate immunity. Cell 124, 783–801. - PubMed
    1. Biswas SK and Mantovani A (2010). Macrophage plasticity and interaction with lymphocyte subsets: cancer as a paradigm. Nature Immunology 11, 889–896. - PubMed
    1. Burelle Y, Lamoureux MC, Péronnet F, Massicotte D, Lavoie C. (2006) Comparison of exogenous glucose, fructose and galactose oxidation during exercise using 13C-labelling. Br J Nutr 96:56–61. - PubMed
    1. Chang CH, Curtis JD, Maggi LB, Faubert B, Villarino AV, O’Sullivan D, Huang SCC, van der Windt GJ, Blagih J, Qiu J et al. (2013) Posttranscriptional control of T cell effector function by aerobic glycolysis. Cell 153, 1239–1251. - PMC - PubMed
    1. Chen W, Hoerter J, Guéron M (1996) A comparison of AMP degradation in the perfused rat heart during 2-deoxy-D-glucose perfusion and anoxia. Part I: The release of adenosine and inosine. J Mol Cell Cardiol 28:2163–74. - PubMed

Publication types

MeSH terms