. 2018 Sep 4;24(10):2784-2794.
doi: 10.1016/j.celrep.2018.08.018.

Dynamics of Transcription Regulation in Human Bone Marrow Myeloid Differentiation to Mature Blood Neutrophils

Affiliations

Dynamics of Transcription Regulation in Human Bone Marrow Myeloid Differentiation to Mature Blood Neutrophils

Luigi Grassi et al. Cell Rep. .

Abstract

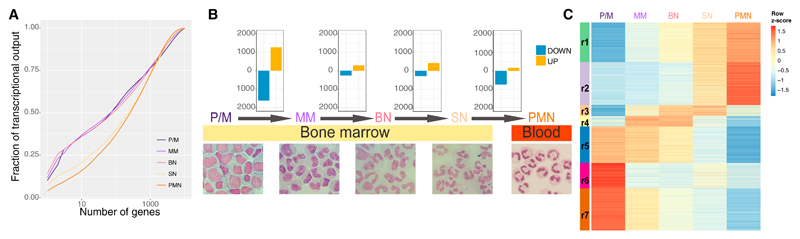
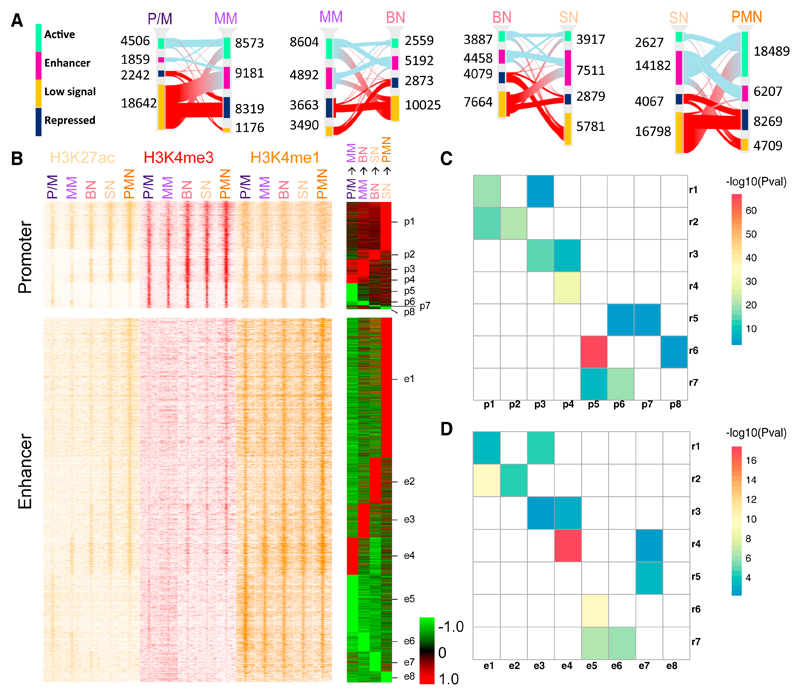
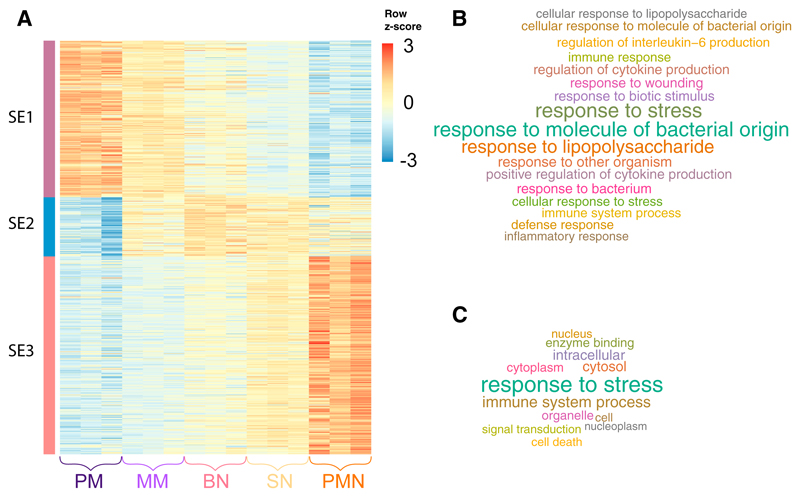
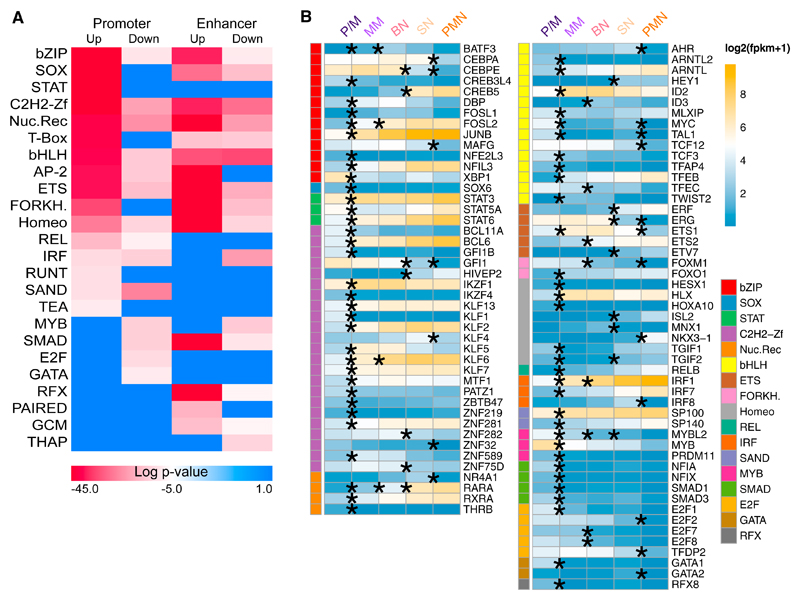
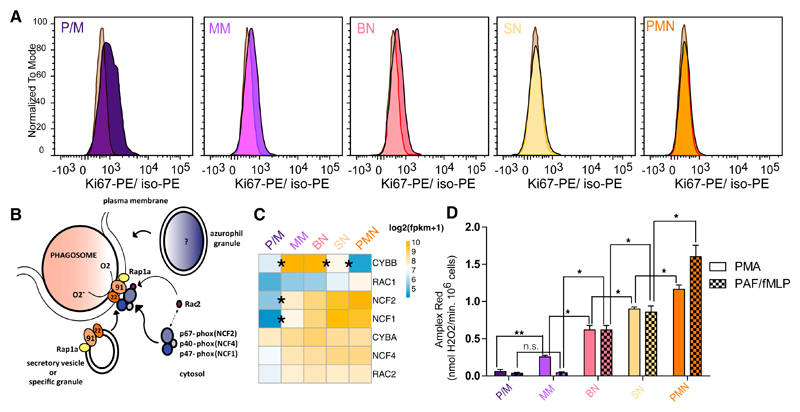
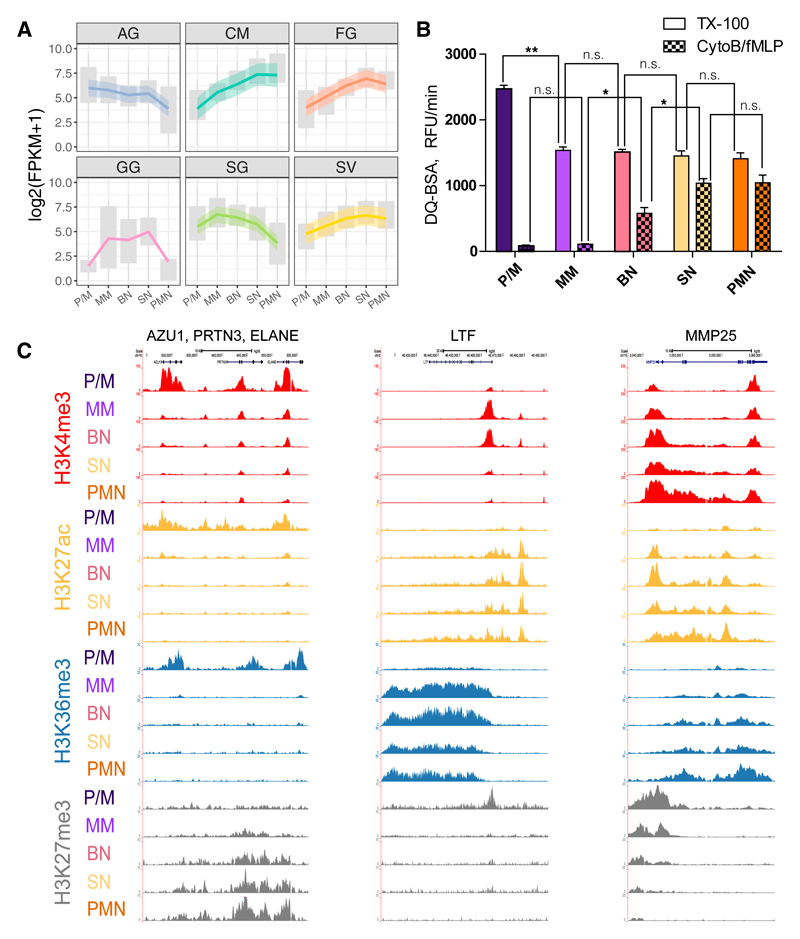
Neutrophils are short-lived blood cells that play a critical role in host defense against infections. To better comprehend neutrophil functions and their regulation, we provide a complete epigenetic overview, assessing important functional features of their differentiation stages from bone marrow-residing progenitors to mature circulating cells. Integration of chromatin modifications, methylation, and transcriptome dynamics reveals an enforced regulation of differentiation, for cellular functions such as release of proteases, respiratory burst, cell cycle regulation, and apoptosis. We observe an early establishment of the cytotoxic capability, while the signaling components that activate these antimicrobial mechanisms are transcribed at later stages, outside the bone marrow, thus preventing toxic effects in the bone marrow niche. Altogether, these data reveal how the developmental dynamics of the chromatin landscape orchestrate the daily production of a large number of neutrophils required for innate host defense and provide a comprehensive overview of differentiating human neutrophils.

Keywords: epigenome; myeloid differentiation; neutrophil; transcriptome.


Conflict of interest statement

Declaration of Interests

P.F. is a member of the Scientific Advisory Boards of Fabric Genomics, Inc., and Eagle Genomics, Ltd.

Figures

Figure 1
Figure 1. Transcriptome and Epigenome Dynamics of Neutrophil Differentiation
(A) Cumulative distribution of the average fraction of total transcription contributed by protein-coding genes when sorted from most to least expressed in each differentiation stage. (B) Top: bar plots reporting differentially expressed genes (posterior probability > 0.5 and absolute fold change > 2) in the comparisons P/M-MM, MM-BN, BN-SN, and SN-PMN. Bottom: May-Grünwald-Giemsa staining of the isolated cells. (C) Heatmap displaying the expression patterns of the clusters (r1–r7) identified by the K-means analysis of the genes differentially expressed in at least one comparison.
Figure 2
Figure 2. H3K27 Acetylation Drives Consecutive Neutrophil Differentiation Stages
(A) Sankey diagrams of consistent chromatin states for each of the neutrophil differentiation transitions. Different chromatin states are represented with specific color codes: green indicates active regions, purple enhancers, amber low signal regions, and dark blue heterochromatic regions. The red connecting lines indicate transitions toward inactive states (low signal and repressed); the light blue lines indicate transitions toward active states (active and enhancer). (B) Left: stacking heatmaps of H3K27ac (yellow), H3K4me3 (red), and H3K4me1 (orange) ChIP-seq of promoters and enhancers (±5 kb) with dynamic acetylation during different stages of neutrophil differentiation. Right: differentially acetylated promoter and enhancer during two consecutive neutrophil progenitor stage transitions are clustered as acetylation clusters for promoters p1–p8 and for enhancers e1–e8, respectively. Acetylation gains are presented in red and acetylation losses in green. (C and D) Heatmaps representing the association between the expression clusters identified in Figure 1C and the promoter (C) and enhancer (D) clusters identified in Figure 2B. Only significant corrected p values (<0.05) are reported in the figures.
Figure 3
Figure 3. Identification of Super-enhancers Associated with Neutrophil Differentiation
(A) Heatmap of H3K27ac density at superenhancers with dynamic acetylation during different stages of neutrophil differentiation. For each state tag density for the three replicates is included. (B and C) GO Biological Processes (B) and GO Slim (C) categories enriched by genes associated with super-enhancers activated at the final stages of neutrophil differentiation (cluster SE3).
Figure 4
Figure 4. Transcription Factors with Enriched Binding Sites in Dynamic Acetylated Regions
(A) Transcription factor (TF) family motif enrichment in the dynamic acetylated regions in Figure 2B. (B) RNA expression in log2(FPKM+1) of the TF family members in (A) differentially expressed in at least one of the comparison between differentiation stages; the asterisk denotes the transitions where the expression is significantly different.
Figure 5
Figure 5. Cell Cycle and NADPH Oxidase Regulation in Neutrophil Differentiation
(A) Flow cytometry analysis of Ki67 expression in bone marrow neutrophil progenitor fractions normalized to isotope control in gray for the three biological replicates. (B) Schematic of the assembly of the nicotinamide adenine dinucleotide phosphate (NADPH) oxidase enzyme complex on the phagosomal or plasma membrane upon neutrophil activation. (C) Heatmap representing the expression in log2(FPKM+1) of NADPH complex subunits during neutrophil differentiation. (D) Respiratory burst in sorted neutrophil progenitors from bone marrow and mature PMN upon stimulation with PMA and PAF/fMLP. Results are expressed as maximal rates in nmol H2O2/min · 106 PMNs and as mean ± SEM from the three biological replicates. t test corrected p values of the consecutive stages are indicated in the figure: *p < 0.1 and **p < 0.01. ns, nonsignificant. The t test corrected p values of all comparisons are reported in Table S5.
Figure 6
Figure 6. Epigenetics and Transcriptomics of Granule Proteins
(A) Granule gene expression across differentiation. Upper and lower boxplot margins indicate first and third quartiles. LOESS fitting of the data with relative confidence interval is represented by a colored line with a shadow area. (B) Proteolytic activity of the different differentiation stages measured by DQ-BSA cleavage. Triton X-100 releases total proteolytic activity stored in the cell by lysis, while proteolytic activity by CytoB/fMLP is a receptor-mediated release of proteases. Results are shown as the maximal slopes in RFU/min and expressed as mean ± SEM from the three biological replicates. t test corrected p values of the consecutive stages are indicated in the figure: *p < 0.1 and **p < 0.01. ns, nonsignificant. The t test corrected p values of all comparisons are reported in Table S5. (C) Representative views of epigenetic modifications dynamics at five loci encoding for granule proteins.

References

    1. Avellino R, Delwel R. Expression and regulation of C/EBPα in normal myelopoiesis and in malignant transformation. Blood. 2017;129:2083–2091. - PubMed
    1. Bainton DF, Ullyot JL, Farquhar MG. The development of neutrophilic polymorphonuclear leukocytes in human bone marrow. J Exp Med. 1971;134:907–934. - PMC - PubMed
    1. Bartůnek P, Králová J, Blendinger G, Dvorák kM, Zenke M. GATA-1 and c-myb crosstalk during red blood cell differentiation through GATA-1 binding sites in the c-myb promoter. Oncogene. 2003;22:1927–1935. - PubMed
    1. Bock C, Beerman I, Lien WH, Smith ZD, Gu H, Boyle P, Gnirke A, Fuchs E, Rossi DJ, Meissner A. DNA methylation dynamics during in vivo differentiation of blood and skin stem cells. Mol Cell. 2012;47:633–647. - PMC - PubMed
    1. Carrillo-de-Santa-Pau E, Juan D, Pancaldi V, Were F, Martin-Subero I, Rico D, Valencia A, BLUEPRINT Consortium Automatic identification of informative regions with epigenomic changes associated to hematopoiesis. Nucleic Acids Res. 2017;45:9244–9259. - PMC - PubMed

Publication types

MeSH terms

LinkOut - more resources