

TaxAss: Leveraging a Custom Freshwater Database Achieves Fine-Scale Taxonomic Resolution
- PMID: 30185512
- PMCID: PMC6126143
- DOI: 10.1128/mSphere.00327-18
TaxAss: Leveraging a Custom Freshwater Database Achieves Fine-Scale Taxonomic Resolution
Abstract
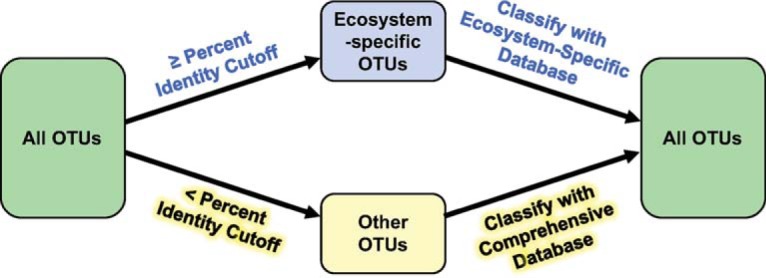
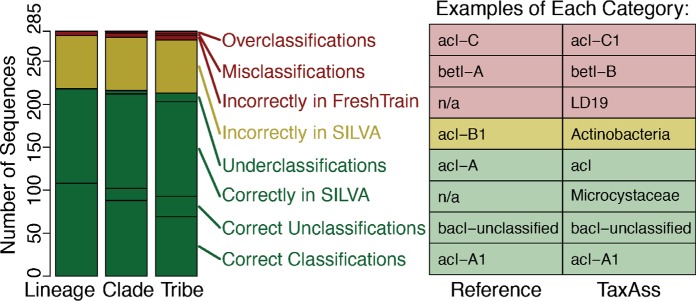
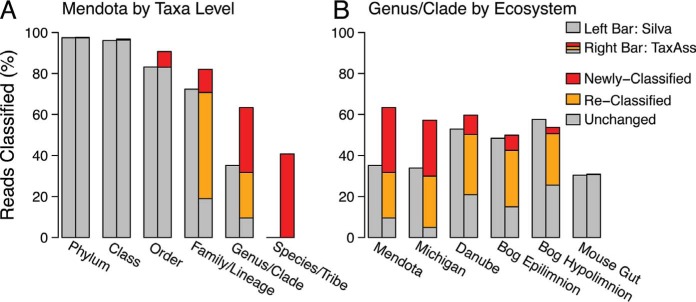
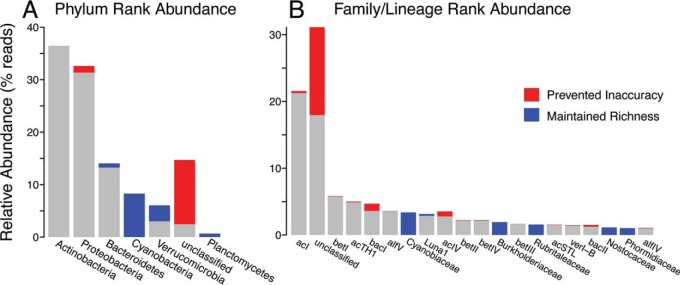
Taxonomy assignment of freshwater microbial communities is limited by the minimally curated phylogenies used for large taxonomy databases. Here we introduce TaxAss, a taxonomy assignment workflow that classifies 16S rRNA gene amplicon data using two taxonomy reference databases: a large comprehensive database and a small ecosystem-specific database rigorously curated by scientists within a field. We applied TaxAss to five different freshwater data sets using the comprehensive SILVA database and the freshwater-specific FreshTrain database. TaxAss increased the percentage of the data set classified compared to using only SILVA, especially at fine-resolution family to species taxon levels, while across the freshwater test data sets classifications increased by as much as 11 to 40% of total reads. A similar increase in classifications was not observed in a control mouse gut data set, which was not expected to contain freshwater bacteria. TaxAss also maintained taxonomic richness compared to using only the FreshTrain across all taxon levels from phylum to species. Without TaxAss, most organisms not represented in the FreshTrain were unclassified, but at fine taxon levels, incorrect classifications became significant. We validated TaxAss using simulated amplicon data derived from full-length clone libraries and found that 96 to 99% of test sequences were correctly classified at fine resolution. TaxAss splits a data set's sequences into two groups based on their percent identity to reference sequences in the ecosystem-specific database. Sequences with high similarity to sequences in the ecosystem-specific database are classified using that database, and the others are classified using the comprehensive database. TaxAss is free and open source and is available at https://www.github.com/McMahonLab/TaxAssIMPORTANCE Microbial communities drive ecosystem processes, but microbial community composition analyses using 16S rRNA gene amplicon data sets are limited by the lack of fine-resolution taxonomy classifications. Coarse taxonomic groupings at the phylum, class, and order levels lump ecologically distinct organisms together. To avoid this, many researchers define operational taxonomic units (OTUs) based on clustered sequences, sequence variants, or unique sequences. These fine-resolution groupings are more ecologically relevant, but OTU definitions are data set dependent and cannot be compared between data sets. Microbial ecologists studying freshwater have curated a small, ecosystem-specific taxonomy database to provide consistent and up-to-date terminology. We created TaxAss, a workflow that leverages this database to assign taxonomy. We found that TaxAss improves fine-resolution taxonomic classifications (family, genus, and species). Fine taxonomic groupings are more ecologically relevant, so they provide an alternative to OTU-based analyses that is consistent and comparable between data sets.
Keywords: 16S rRNA gene; amplicon sequencing; freshwater; limnology; microbial ecology; taxonomy; taxonomy assignment; taxonomy database.
Copyright © 2018 Rohwer et al.
Figures
Similar articles
-
Generation of Comprehensive Ecosystem-Specific Reference Databases with Species-Level Resolution by High-Throughput Full-Length 16S rRNA Gene Sequencing and Automated Taxonomy Assignment (AutoTax).mBio. 2020 Sep 22;11(5):e01557-20. doi: 10.1128/mBio.01557-20. mBio. 2020. PMID: 32963001 Free PMC article.
-
Metagenomic profiling of the microbial freshwater communities in two Bulgarian reservoirs.J Basic Microbiol. 2017 Aug;57(8):669-679. doi: 10.1002/jobm.201700137. Epub 2017 May 22. J Basic Microbiol. 2017. PMID: 28543439
-
Broadscale Ecological Patterns Are Robust to Use of Exact Sequence Variants versus Operational Taxonomic Units.mSphere. 2018 Jul 18;3(4):e00148-18. doi: 10.1128/mSphere.00148-18. mSphere. 2018. PMID: 30021874 Free PMC article.
-
Reference databases for taxonomic assignment in metagenomics.Brief Bioinform. 2012 Nov;13(6):682-95. doi: 10.1093/bib/bbs036. Epub 2012 Jul 10. Brief Bioinform. 2012. PMID: 22786784 Review.
-
A guide to the natural history of freshwater lake bacteria.Microbiol Mol Biol Rev. 2011 Mar;75(1):14-49. doi: 10.1128/MMBR.00028-10. Microbiol Mol Biol Rev. 2011. PMID: 21372319 Free PMC article. Review.
Cited by
-
Generation of Comprehensive Ecosystem-Specific Reference Databases with Species-Level Resolution by High-Throughput Full-Length 16S rRNA Gene Sequencing and Automated Taxonomy Assignment (AutoTax).mBio. 2020 Sep 22;11(5):e01557-20. doi: 10.1128/mBio.01557-20. mBio. 2020. PMID: 32963001 Free PMC article.
-
Microbial ecology of northern Gulf of Mexico estuarine waters.mSystems. 2024 Aug 20;9(8):e0131823. doi: 10.1128/msystems.01318-23. Epub 2024 Jul 9. mSystems. 2024. PMID: 38980056 Free PMC article.
-
Microbiota Composition Associates With Mosquito Productivity Outcomes in Belowground Larval Habitats.Mol Ecol. 2025 Jan;34(2):e17614. doi: 10.1111/mec.17614. Epub 2024 Dec 13. Mol Ecol. 2025. PMID: 39673091 Free PMC article.
-
Species invasions shift microbial phenology in a two-decade freshwater time series.Proc Natl Acad Sci U S A. 2023 Mar 14;120(11):e2211796120. doi: 10.1073/pnas.2211796120. Epub 2023 Mar 7. Proc Natl Acad Sci U S A. 2023. PMID: 36881623 Free PMC article.
-
In the right place, at the right time: the integration of bacteria into the Plankton Ecology Group model.Microbiome. 2023 May 20;11(1):112. doi: 10.1186/s40168-023-01522-0. Microbiome. 2023. PMID: 37210505 Free PMC article.
References
-
- Bálint M, Bahram M, Eren AM, Faust K, Fuhrman JA, Lindahl B, O’Hara RB, Öpik M, Sogin ML, Unterseher M, Tedersoo L. 2016. Millions of reads, thousands of taxa: microbial community structure and associations analyzed via marker genes. FEMS Microbiol Rev 40:686–700. doi:10.1093/femsre/fuw017. - DOI - PubMed
Publication types
MeSH terms
Substances
LinkOut - more resources
Full Text Sources
Other Literature Sources
