

Prostate cancer screening with prostate-specific antigen (PSA) test: a systematic review and meta-analysis
- PMID: 30185521
- PMCID: PMC6283370
- DOI: 10.1136/bmj.k3519
Prostate cancer screening with prostate-specific antigen (PSA) test: a systematic review and meta-analysis
Abstract
Objective: To investigate the efficacy and safety of prostate-specific antigen (PSA) testing to screen for prostate cancer.
Design: Systematic review and meta-analysis.
Data sources: Electronic search of Cochrane Central Register of Controlled Trials, Web of Science, Embase, Scopus, OpenGrey, LILACS, and Medline, and search of scientific meeting abstracts and trial registers to April 2018.
Eligibility criteria for selecting studies: Randomised controlled trials comparing PSA screening with usual care in men without a diagnosis of prostate cancer.
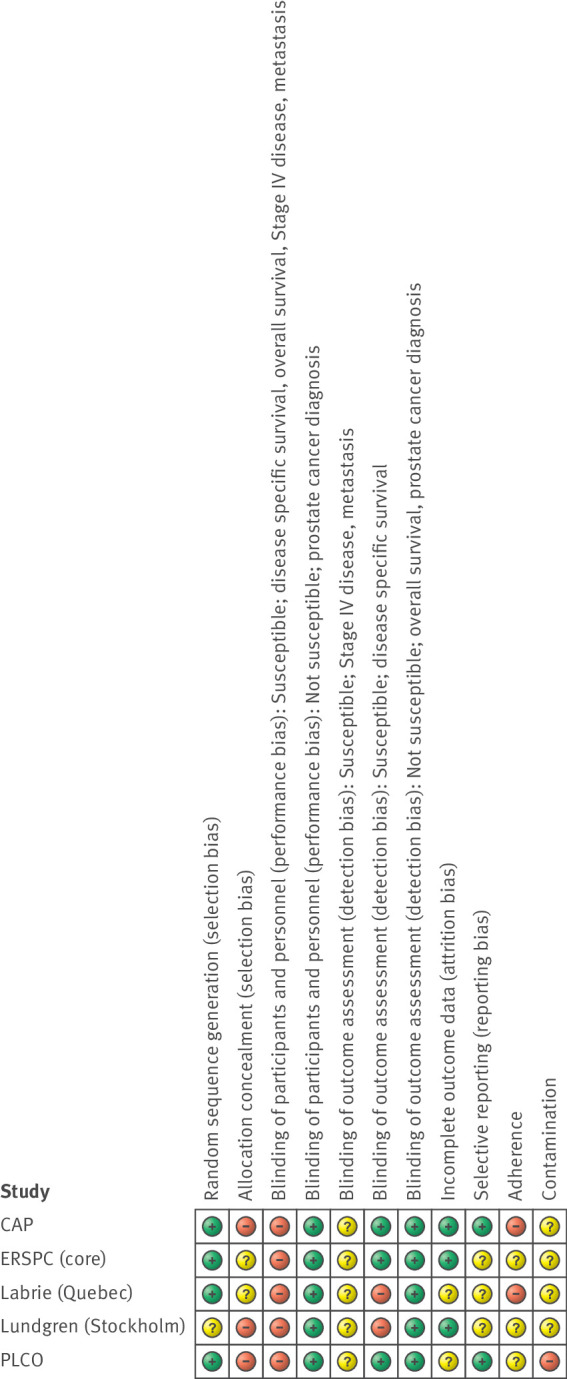
Data extraction: At least two reviewers screened studies, extracted data, and assessed the quality of eligible studies. A parallel guideline committee (BMJ Rapid Recommendation) provided input on the design and interpretation of the systematic review, including selection of outcomes important to patients. We used a random effects model to obtain pooled incidence rate ratios (IRR) and, when feasible, conducted subgroup analyses (defined a priori) based on age, frequency of screening, family history, ethnicity, and socioeconomic level, as well as a sensitivity analysis based on the risk of bias. The quality of the evidence was assessed with the GRADE approach.
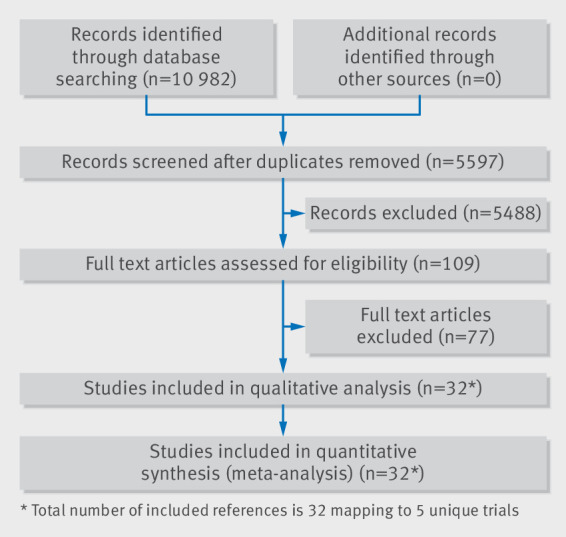
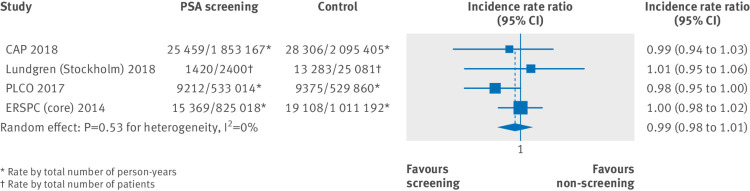
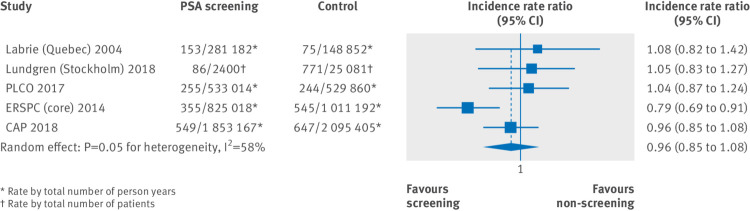
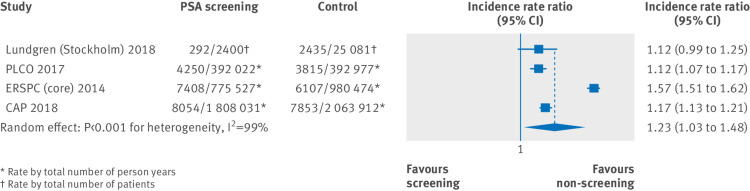
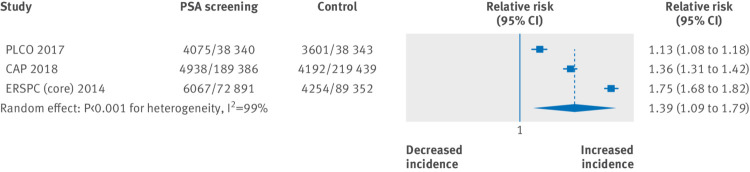
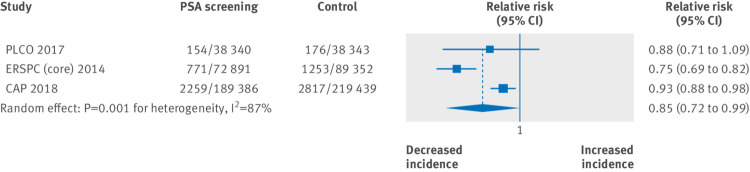
Results: Five randomised controlled trials, enrolling 721 718 men, were included. Studies varied with respect to screening frequency and intervals, PSA thresholds for biopsy, and risk of bias. When considering the whole body of evidence, screening probably has no effect on all-cause mortality (IRR 0.99, 95% CI 0.98 to 1.01; moderate certainty) and may have no effect on prostate-specific mortality (IRR 0.96, 0.85 to 1.08; low certainty). Sensitivity analysis of studies at lower risk of bias (n=1) also demonstrates that screening seems to have no effect on all-cause mortality (IRR 1.0, 0.98 to 1.02; moderate certainty) but may have a small effect on prostate-specific mortality (IRR 0.79, 0.69 to 0.91; moderate certainty). This corresponds to one less death from prostate cancer per 1000 men screened over 10 years. Direct comparative data on biopsy and treatment related complications from the included trials were limited. Using modelling, we estimated that for every 1000 men screened, approximately 1, 3, and 25 more men would be hospitalised for sepsis, require pads for urinary incontinence, and report erectile dysfunction, respectively.
Conclusions: At best, screening for prostate cancer leads to a small reduction in disease-specific mortality over 10 years but has does not affect overall mortality. Clinicians and patients considering PSA based screening need to weigh these benefits against the potential short and long term harms of screening, including complications from biopsies and subsequent treatment, as well as the risk of overdiagnosis and overtreatment.
Systematic review registration: PROSPERO registration number CRD42016042347.
Published by the BMJ Publishing Group Limited. For permission to use (where not already granted under a licence) please go to http://group.bmj.com/group/rights-licensing/permissions.
Conflict of interest statement
Competing interests All authors have completed the Unified Competing Interest form (available on request from the corresponding author) and declare: no support from any organisation for the submitted work; no financial relationships with any organisations that might have an interest in the submitted work in the previous three years; no other relationships or activities that could appear to have influenced the submitted work.
Figures
References
-
- International Agency for Research on Cancer. GLOBOCAN 2012: Cancer incidence and mortality worldwide in 2012. http://globocan.iarc.fr/Pages/fact_sheets_cancer.aspx#.
-
- Lin K, Lipsitz R, Miller T, Janakiraman S, U.S. Preventive Services Task Force Benefits and harms of prostate-specific antigen screening for prostate cancer: an evidence update for the U.S. Preventive Services Task Force. Ann Intern Med 2008;149:192-9. 10.7326/0003-4819-149-3-200808050-00009. - DOI - PubMed
Publication types
MeSH terms
Substances
LinkOut - more resources
Full Text Sources
Other Literature Sources
Medical
Research Materials
Miscellaneous