. 2018 Oct 15;78(20):5877-5890.
doi: 10.1158/0008-5472.CAN-18-1011. Epub 2018 Sep 5.

EGR1-Mediated Transcription of lncRNA-HNF1A-AS1 Promotes Cell-Cycle Progression in Gastric Cancer

Affiliations

EGR1-Mediated Transcription of lncRNA-HNF1A-AS1 Promotes Cell-Cycle Progression in Gastric Cancer

Hai-Ting Liu et al. Cancer Res. .

Abstract

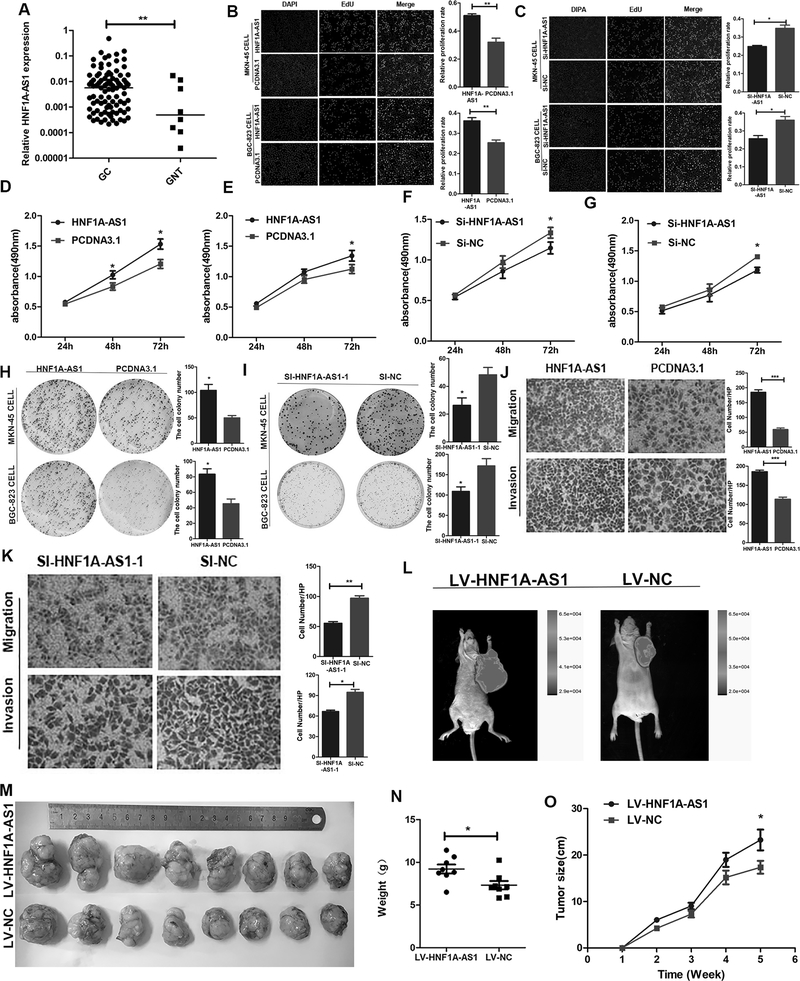
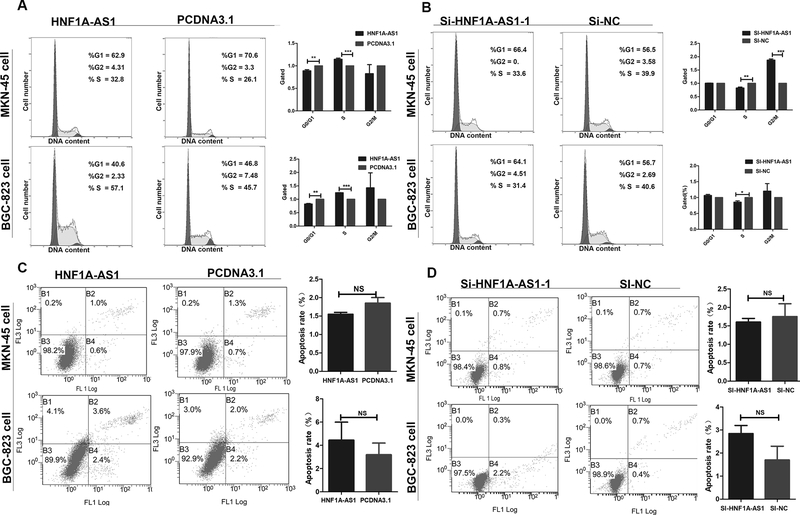
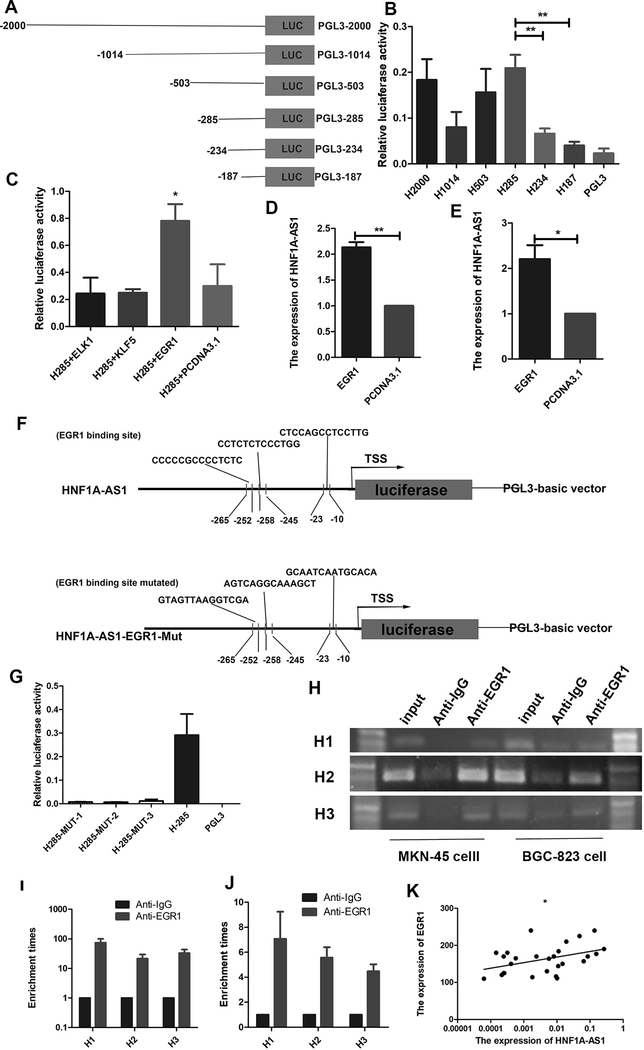
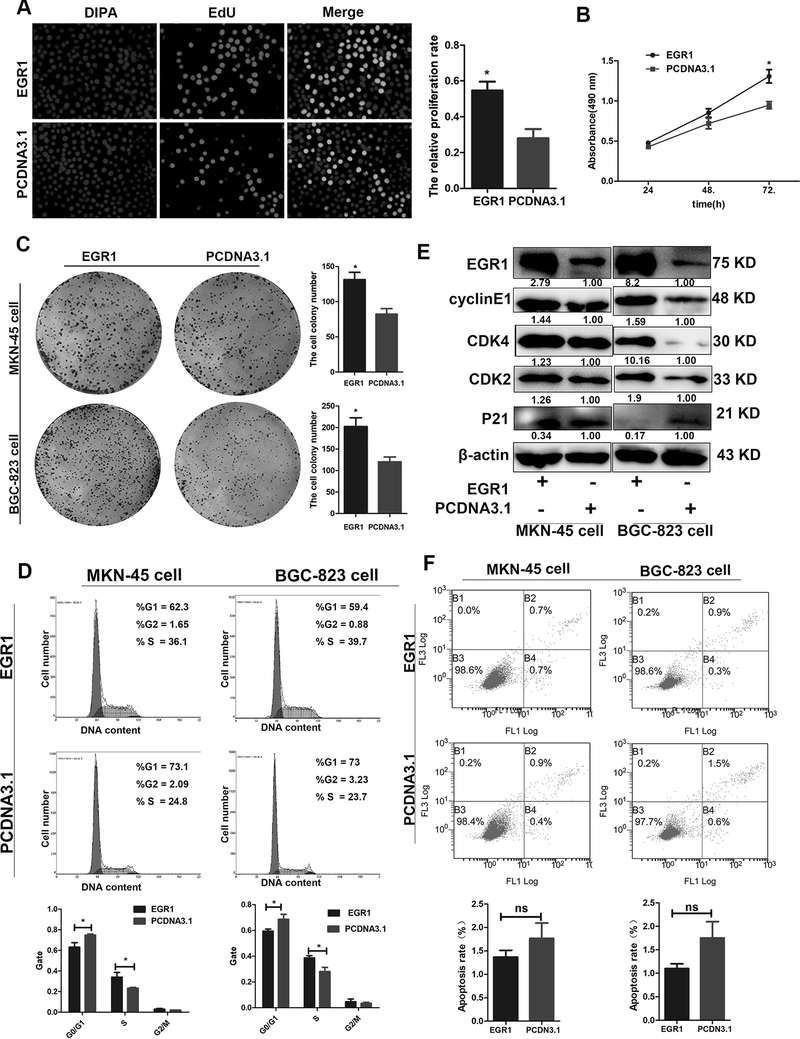
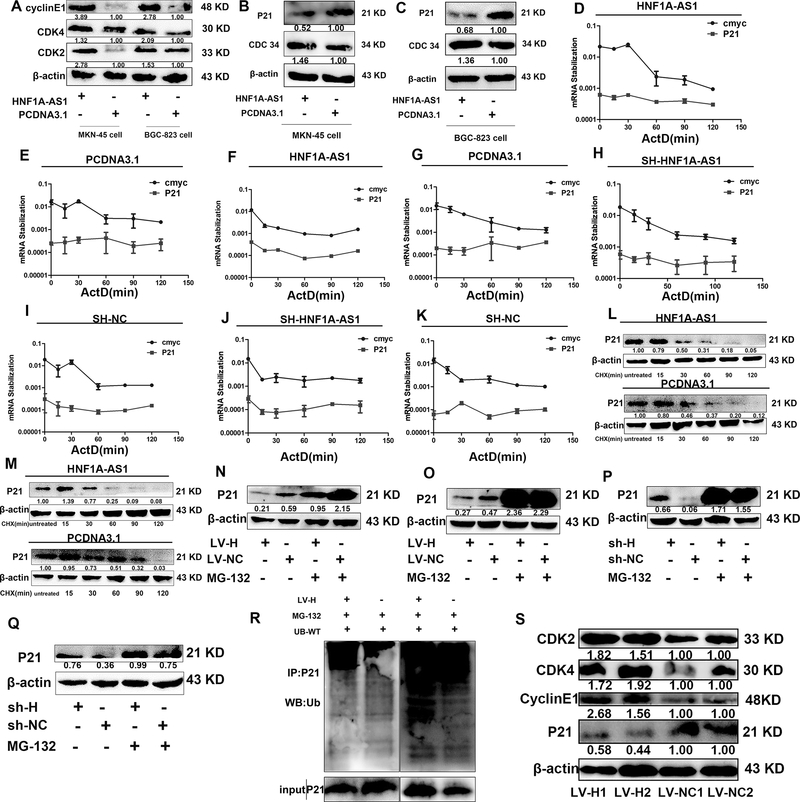
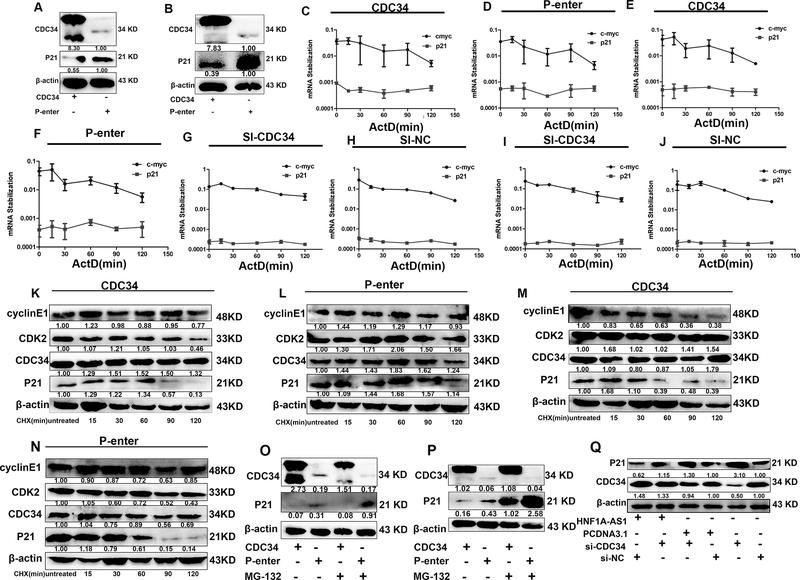
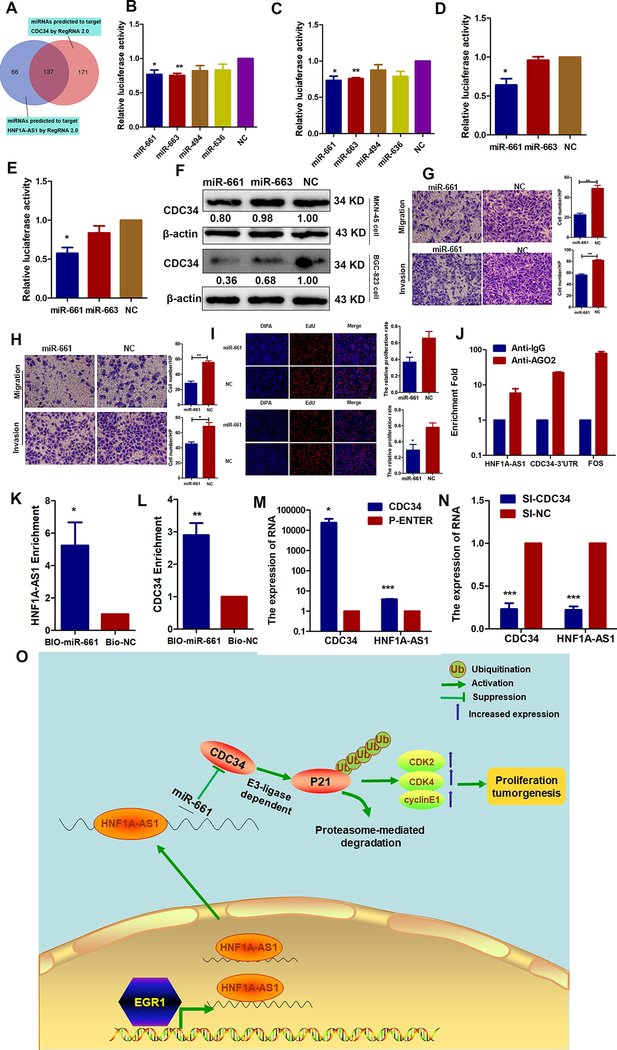
Long noncoding RNAs (lncRNA) are dysregulated in various human cancers and control tumor development and progression. However, the upstream mechanisms underlying their dysregulation remain unclear. Here, we demonstrate that the expression of hepatocyte nuclear factor 1 homeobox A antisense RNA 1 (HNF1A-AS1) is significantly upregulated in gastric cancer tissues. Overexpression of HNF1A-AS1 enhanced cell proliferation and promoted cell-cycle progression, whereas knockdown of HNF1A-AS1 elicited the opposite effects. Early growth response protein 1 (EGR1) directly bound the HNF1A-AS1 promoter region and activated its transcription. Overexpression of EGR1 enhanced cell proliferation and promoted cell-cycle promotion, similar to the function of HNF1A-AS1. HNF1A-AS1 functioned as competing endogenous RNA (ceRNA) by binding to miR-661, upregulating the expression of cell division cycle 34 (CDC34), which is a direct target of miR-661. EGR1 and HNF1A-AS1 enhanced the expression of cyclin-dependent kinase 2 (CDK2), CDK4, and cyclin E1 but inhibited the expression of p21 by promoting CDC34-mediated ubiquitination and degradation of p21. Taken together, these findings suggest that EGR1-activated HNF1A-AS1 regulates various pro- and antigrowth factors to promote the development of gastric cancer, implicating it as a possible target for therapeutic intervention in this disease.Significance: This study provides novel insights into mechanisms by which the noncoding RNA HNF1A-AS1 contributes to gastric cancer progression through modulation of the cell cycle. Cancer Res; 78(20); 5877-90. ©2018 AACR.


Conflict of interest statement

Competing financial interests

All authors promise that there is no conflict to disclose.

Figures

Figure 1.
Figure 1.. HNF1A-AS1 promotes GC cell growth and invasion.
(A). HNF1A-AS1 expression was analyzed by qRT-PCR in GC tissues (n = 99) and adjacent normal tissues (n = 8). HNF1A-AS1 expression level was normalized to that of GAPDH. (B-C). MKN-45 and BGC-823 cells growth was enhanced as evaluated by the EdU assay (B). And HNF1A-AS1 knockdown inhibited cell proliferation activities in both two cell lines (C). Three independent experiments were performed, and data are presented as mean ± SD. (D-G). The cell growth rates were determined with MTS proliferation assays. Three independent experiments were performed, and data are presented as mean ± SD. (H-I). Colony formation assays were used to explore the cell colony formation ability of HNF1A-AS1 and Si-HNF1A-AS-1–transfected cells. Three independent experiments were performed, and data are presented as mean ± SD. (J-K). Migration and invasion ability of the BGC-823 cell lines by Transwell assays. Three independent experiments were performed, and data are presented as mean ± SD. (L). Five weeks post implantation, the tumors in Nu/Nu mice was measured by an in vivo imaging system. (M). The HNF1A-AS1 stably expressing group or the negative control were used for tumorigenesis assay. Five weeks later, the mice were killed and the tumor nodules were harvested. (N-O). Tumor growth curves after subcutaneous injection of MKN-45 cells containing a stable overexpression of HNF1A-AS1 or the negative control are shown. The tumor weights (N) and volumes (O) were measured every 7 days after inoculation. *P < 0.05, ** P < 0.01, *** P < 0.001
Figure 2:
Figure 2:. The effect of HNF1A-AS1 on gastric cancer cell cycle and apoptosis in vitro.
(A). Flow cytometry was performed to determine the effects of HNF1A-AS1 on cell cycle. Significant G1 phase decrease and S phase increase was observed in both cell lines. (B). Significant G1 phase increase and S phase decrease was observed in both cell lines. (C-D). Apoptosis was analyzed by flow cytometry, which showed that upregulation or downregulation of HNF1A-AS1 expression did not induce apoptosis in comparison with the control cells. Three independent experiments were performed, and data are presented as mean ± SD. *P < 0.05, ** P < 0.01, *** P < 0.001
Figure 3.
Figure 3.. EGR1 activates HNF1A-AS1 transcription.
(A). Schematic diagram of the HNF1A-AS1 promoter fragments spanning from −2,000/ −1,014/ −503/ −285/ −234/ −187 to 0. This promoter fragments were cloned into the upstream of the firefly luciferase reporter gene in the pGL3-basic vector. (B). Transcriptional activity analysis of the potential HNF1A-AS1 promoter fragments in 293T cells. (C). Luciferase activity assay showed that EGR1 observably increased promoter activities of pGL3−285/0. (D-E). RT-qPCR assay indicated EGR1 promoted the expression level of HNF1A-AS1 in MKN-45 cells (D) and BGC-823 cells (E). (F). Schematic diagram of the luciferase reporter construct containing the human HNF1A-AS1 promoter and the mutant construct (H-Mut-1/2/3) containing the basal promoter in which the presumed HNF1A-AS1 binding site was mutated. (G). Luciferase activity of the HNF1A-AS1 promoter was decreased when the three presumed HNF1A-AS1 binding site was mutated. (H). ChIP-PCR assay showed that EGR1directly interacted with the EGR1 binding sites within HNF1A-AS1 promoter in MKN-45 cells and BGC-823 cells. A specific strong band of the expected size was detected in the input DNA. The fragment containing the EGR1 binding sites was detected. No band or very weak band was detected in the chromatin complex precipitated by antibody against IgG. H1, H2 and H3 respectively represent primer that covered the EGR1 binding sites. (I-J). ChIP-qPCR analysis indicated higher fold enrichment of promoter amplicons of EGR1 in anti-EGR1 antibody group than that of IgG group in MKN-45 cells (I) and BGC-823 cells (J), indicating that EGR1 could directly bind to HNF1A-AS1 promoter. H1, H2 and H3 respectively represent primer that covered the EGR1 binding sites. (K). A significant positive correlation was found between the protein levels of EGR1 and HNF1A-AS1 in GC tissues. Three independent experiments were performed, and data are presented as mean ± SD. *P < 0.05, ** P < 0.01, *** P < 0.001
Figure 4.
Figure 4.. EGR1 enhances GC cell proliferation.
(A) EdU assay was performed to observe the effect of EGR1 overexpression on cell proliferation. (B). Cells were seeded in 96-well plates after transfection with EGR1 overexpression or control vector, and cell number was determined every 24 h using MTS assays. (C). Effect of EGR1 overexpression on the colony formation of MKN-45 and BGC-823 cells. (D). Effect of EGR1 overexpression on the cell cycle progression of both cells. (E). The expression levels of CDK2, CDK4, cylcinE1 and P21 in both MKN-45 cells and BGC-823 cells transfected with EGR1 overexpression vector were detected by western blotting assay. (F). Apoptosis was determined by flow cytometry, which showed that EGR1 did not induce apoptosis in comparison with the control cells. Three independent experiments were performed, and data are shown as mean ± SD. *P < 0.05, ** P < 0.01, *** P < 0.001.
Figure 5.
Figure 5.. HNF1A-AS1 enhanced the expression of cell cycle regulators and promoted p21 degradation by ubiquitination.
(A). The expression levels of CDK2, CDK4 and cylcinE1 in HNF1A-AS1 over-expressed MKN-45 cells and BGC-823 cells were detected by Western Blotting assay. (B-C). Western Blotting assay was used to detect the expression levels of CDC34 and P21 in HNF1A-AS1 over-expressed MKN-45 cells (B) and BGC-823 cells (C). (D-G). MKN-45 cells (D-E) and BGC-823 cells (F-G) transfected with HNF1A-AS1 overexpression vector and control cells treated with Actinomycin D (ActD 5ug/ml) for the indicated periods of time. P21 mRNA levels were analyzed by RT-qPCR. (H-K). MKN-45 cells (H-I) and BGC-823 cells (J-K) transfected with HNF1A-AS1-targeting shRNA and control cells treated with Actinomycin D (ActD 5ug/ml) for the indicated periods of time. P21 mRNA levels were analyzed by RT-qPCR. (L-M). MKN-45 cells (L) and BGC-823 cells (M) transfected with HNF1A-AS1 overexpression vector and control cells were treated with cycloheximide (CHX 5ug/ml) or vehicle for the indicated periods. P21 protein levels were analyzed by western blotting. (N-O). MKN-45 cells (N) and BGC-823 cells (O) transfected with HNF1A-AS1 overexpression vector and control cells were treated with MG132 (5 μM) or vehicle for 24 h. Cell lysates were analyzed by western blotting. (P-Q). MKN-45 cells (P) and BGC-823 cells (Q) transfected with HNF1A-AS1-targeting shRNA and control cells were treated with MG132 (5 μM) or vehicle for 24 h. Cell lysates were analyzed by western blotting. (R). HNF1A-AS1 overexpression group or control group were treated with MG-132 (10 um) for 24h. Cell lysates were immunoprecipitated with antibody against P21. The ubiquitination of p21 was notably increased in MKN-45 cells overexpressing HNF1A-AS1 compared with the control group. (S). LV-HNF1A-AS1 enhanced the expression of CDK2, CDK4, cyclinE1, and decreased the expression of p21 in mice tumor xenografts, compared to that of the LV-NC group. ActD and CHX is respectively short for Actinomycin D and Cycloheximide. Three independent experiments were performed, and data are shown as mean ± SD.
Figure 6.
Figure 6.. CDC34 promoted p21 degradation.
(A-B). In CDC34 over-expressed MKN-45 cells and BGC-823 cells, the expression level of P21 was detected by western blotting. (C-F). MKN-45 cells (C-D) and BGC-823 cells (E-F) transfected with CDC34 overexpression vector and control cells treated with Actinomycin D (5ug/ml) for the indicated periods of time. P21 mRNA levels were analyzed by RT-qPCR. (G-J). MKN-45 cells (G-H) and BGC-823 cells (I-J) transfected with si-CDC34 and control cells treated with Actinomycin D (5ug/ml) for the indicated periods of time. P21 mRNA levels were analyzed by RT-qPCR. (K-N). MKN-45 cells (K-L) and BGC-823 cells (M-N) transfected with CDC34 overexpression vector and control cells were treated with cycloheximide (CHX 5ug/ml) or vehicle for the indicated periods. P21 protein levels were analyzed by western blotting. (O-P). MKN-45 cells (O) and BGC-823 cells (P) transfected with CDC34 overexpression vector and control cells were treated with MG132 (5 μM) or vehicle for 24 h. Cell lysates were analyzed by western blotting. (Q). Western blotting analysis of the p21 in BGC-823 cells overexpressing HNF1A-AS1 or control cells with or without transient transfection withCDC34 siRNA. ActD and CHX is respectively short for Actinomycin D and Cycloheximide. Three independent experiments were performed, and data are shown as mean ± SD.
Figure 7.
Figure 7.. HNF1A-AS1 functions as a ceRNA with miR-661 to upregulate CDC34 expression.
(A). A Venn diagram depicting 137 miRNAs that predicted to target both HNF1A-AS1 and CDC34 by RegRNA 2.0 algorithms. (B-C). Luciferase activity was detected using the dual-luciferase assay. The data indicated a decrease in luciferase activity in MKN-45(B) and BGC-823 (C) cells transfected with PGLO-HNF1A-AS1 and miR-661 or miR-663. (D-E). The results indicated a decrease in luciferase activity in MKN-45 (D) and BGC-823 (E) cells transfected with PGLO-CDC34–3’UTR and miR-661. (F). Western blot analyses were performed to confirm the CDC34 gene expression in both cells transfected with miR-661 or miR-663 mimics. (G-H). Effects of the miR-661 overexpression on migration and invasion abilities in MKN-45 cells (G) and BGC-823 cells (H). (I). EdU assays were performed to detect the effects of miR-661 on cell proliferation in MKN-45 cells (up) and BGC-823 cells (bottom). (J). RNA immunoprecipitation with an anti-Ago2 antibody was used to assess endogenous Ago2 binding to HNF1A-AS1 and CDC-34 3’UTR; IgG was used as the control. (K-L). BGC-823 cells were transfected with biotinylated miR-661(BIO-miR-661) or biotinylated NC (BIO-NC). Forty-eight hours after transfection, cells were collected for a biotin-based pulldown assay. HNF1A-AS1 and CDC34 expression levels were analyzed by RT–qPCR. (M-N). RT-qPCR assay was performed to detect HNF1A-AS1 expression in CDC34 up- or down-regulating BGC-823 cells. (O). Proposed functional action of HNF1A-AS1 in modulating gastric cancer tumorigenesis. The transcriptional factor EGR1 activated HNF1A-AS1 expression by directly binding to its promoter. And HNF1A-AS1 functioned as ceRNA by competitively binding to miR-661 to upregulate the expression of CDC34, which is a direct target of miR-661. Then, CDC34-mediated ubiquitination decreased the stability of p21 protein via degradation of P21 protein, and subsequently increased the expressions of CDK2, CDK4, cyclinE1 to enhance the proliferation capabilities of GC cells.

Similar articles

Cited by

References

    1. Torre LA, Bray F, Siegel RL, Ferlay J, Lortet-Tieulent J, Jemal A. Global cancer statistics, 2012. CA: a cancer journal for clinicians. 2015;65:87–108. - PubMed
    1. McLean MH, El-Omar EM. Genetics of gastric cancer. Nature reviews Gastroenterology & hepatology. 2014;11:664–74. - PubMed
    1. Schipper DL, Wagenmans MJ, Peters WH, Wagener DJ. Significance of cell proliferation measurement in gastric cancer. European journal of cancer. 1998;34:781–90. - PubMed
    1. Lansdorp-Vogelaar I, Kuipers EJ. Screening for gastric cancer in Western countries. Gut. 2016;65:543–4. - PubMed
    1. Duraes C, Almeida GM, Seruca R, Oliveira C, Carneiro F. Biomarkers for gastric cancer: prognostic, predictive or targets of therapy? Virchows Archiv : an international journal of pathology. 2014;464:367–78. - PubMed

Publication types

MeSH terms