. 2018 Sep 18;115(38):E8958-E8967.
doi: 10.1073/pnas.1802028115. Epub 2018 Sep 5.

Phylogenetic approach to recover integration dates of latent HIV sequences within-host

Affiliations

Phylogenetic approach to recover integration dates of latent HIV sequences within-host

Bradley R Jones et al. Proc Natl Acad Sci U S A. .

Abstract

Given that HIV evolution and latent reservoir establishment occur continually within-host, and that latently infected cells can persist long-term, the HIV reservoir should comprise a genetically heterogeneous archive recapitulating within-host HIV evolution. However, this has yet to be conclusively demonstrated, in part due to the challenges of reconstructing within-host reservoir establishment dynamics over long timescales. We developed a phylogenetic framework to reconstruct the integration dates of individual latent HIV lineages. The framework first involves inference and rooting of a maximum-likelihood phylogeny relating plasma HIV RNA sequences serially sampled before the initiation of suppressive antiretroviral therapy, along with putative latent sequences sampled thereafter. A linear model relating root-to-tip distances of plasma HIV RNA sequences to their sampling dates is used to convert root-to-tip distances of putative latent lineages to their establishment (integration) dates. Reconstruction of the ages of putative latent sequences sampled from chronically HIV-infected individuals up to 10 y following initiation of suppressive therapy revealed a genetically heterogeneous reservoir that recapitulated HIV's within-host evolutionary history. Reservoir sequences were interspersed throughout multiple within-host lineages, with the oldest dating to >20 y before sampling; historic genetic bottleneck events were also recorded therein. Notably, plasma HIV RNA sequences isolated from a viremia blip in an individual receiving otherwise suppressive therapy were highly genetically diverse and spanned a 20-y age range, suggestive of spontaneous in vivo HIV reactivation from a large latently infected cell pool. Our framework for reservoir dating provides a potentially powerful addition to the HIV persistence research toolkit.

Keywords: HIV; evolution; latency; phylogenetics; reservoir.


Conflict of interest statement

The authors declare no conflict of interest.

Figures

Fig. 1.
Fig. 1.
Framework illustration. (A) Hypothetical pVL and sampling history of an HIV-infected individual who initiated cART in chronic infection. Throughout all figures, circles denote plasma HIV RNA, diamonds denote HIV DNA, filled symbols denote training data (plasma HIV RNA sequences used for model calibration), and open symbols denote censored data (sequences destined for molecular dating). Training data are colored based on collection date, while censored data are shown in black. Yellow shading denotes cART. Here, plasma HIV RNA sequences collected at baseline and 1.7 and 4.2 y (training data; filled colored circles) are used to infer integration dates of proviral DNA sequences sampled during suppressive cART in year 7 (censored data; open black diamond). (B) Maximum-likelihood within-host phylogeny relating training and censored sequences, where the root represents the inferred MRCA (i.e., the date of the transmitted/founder event). Scale in nucleotide substitutions per site. (C) The thick gray dotted diagonal represents the linear model relating root-to-tip distances of the training data to their sampling dates. The x intercept (here, 1 y before baseline sampling) represents the inferred root date. The linear model is used to convert root-to-tip distances of censored sequences to their establishment (i.e., integration) dates. For example, the latent sequence at the top right, whose divergence from the root is 0.09, is inferred to have integrated at the beginning of year 4 (dotted red line). Light gray lines trace the ancestor–descendant relationships of HIV lineages. (D) Histogram summarizing inferred integration dates of censored sequences. Arrow denotes baseline sampling.
Fig. 2.
Fig. 2.
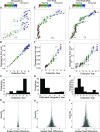
Framework proof of concept using simulated and published HIV sequences. (A) Representative rooted tree relating simulated longitudinal within-host plasma HIV RNA sequences with 50% of tips randomly assigned as training data (circles colored by sampling time point) or censored for molecular dating (open black circles). (B) Resulting linear model with ancestor traces overlaid. (C) Inferred dates of censored sequences; arrow indicates baseline sampling date. (D) Density plots of normalized error distributions (expressed as the absolute difference between predicted and true sampling dates of the censored sequences, scaled by the total dataset timespan, where −1 and 1 represent −100% and 100%, respectively) from 100 (of 961) successful simulations selected at random. (EG) Same as AC, but for within-host plasma HIV RNA sequences from LANL participant 13654 where 50% of tips were randomly assigned as training data. (H) Density plots of normalized error distributions for all six successful LANL RNA datasets. (IK) Same as AC, but for LANL participant 821 with HIV RNA and DNA sequences treated as training and censored, respectively. (L) Density plots of normalized differences between HIV DNA predicted and sampling dates for the six successful LANL RNA/DNA datasets.
Fig. 3.
Fig. 3.
Reservoir dating: participant 1. (A) Plasma HIV RNA sequences from 14 pre-cART time points spanning August 1996 to June 2006 were used as training data (colored circles) to infer the integration dates of censored sequences sampled at four time points between 2007 and 2016, including proviral DNA sequences sampled in 2011 and 2016 (open black diamonds) and plasma HIV RNA sequences from viremic episodes in 2007 and 2015 (open black circles). Yellow shading denotes cART. (B) Rooted tree relating training and censored sequences. (C) Linear model (gray dotted diagonal) with ancestor traces overlaid. (D) Inferred integration dates of censored sequences, colored by sampling date. Arrow denotes baseline sampling date.
Fig. 4.
Fig. 4.
Reservoir dating: participant 2. (A) Plasma HIV RNA sequences from four pre-ART time points between February 1997 and December 1999, and an additional 12 time points between April 2001 and August 2006 during incompletely suppressive dual ART (circles colored by sampling time point) were used as training data to infer the integration dates of censored sequences sampled 7 and 10 y post-cART, including HIV RNA sequences from a viremia episode in 2013 (black open circles) and proviral DNA sampled in 2016 (black open diamonds). Pink and yellow shading denote dual ART and cART, respectively. (B) Rooted tree relating training and censored sequences. (C) Linear models for the pre-ART period (thick gray diagonal, L1) and dual ART period (hatched gray diagonal, L2), with HIV ancestor traces overlaid. Censored sequences are dated using the model inferred from the lineages in which they reside. (D) Inferred integration dates of censored sequences, colored by sampling date. Arrow denotes baseline sampling.
Fig. 5.
Fig. 5.
Framework robustness to training data sampling depth and frequency: RNA censoring validation. This figure summarizes the framework’s ability to recover known plasma HIV RNA sampling dates with progressively fewer training data (censoring validation). (A) The proportion of linear models passing validation (solid line) and the number of sequences used for model training (floating box plots) are shown for the n = 1,096 subsampled as well as the full (14 time points) dataset. Throughout, box width is scaled to dataset size, box plot horizontal indicates the median, edges indicate interquartile ranges, whiskers denote values within 150% of the quartiles, and circles denote outliers. (B and C) MAE and concordance coefficient distributions (between recovered and known sampling dates), respectively, stratified by number of training time points. (D) Model ∆AIC for all 1,097 datasets, where color denotes the number of training time points and shape denotes whether the model passed or failed. A dotted vertical line denotes ∆AIC = 10. (E) Graphic relating model success (black, pass; orange, fail due to ∆AIC <10; teal, fail due to root date criterion), MAE, and date of the earliest training time point for all 1,097 datasets. (F) Graphic relating model success with respect to earliest and latest training sampling time points.
Fig. 6.
Fig. 6.
Model robustness to rooting strategy. Overall concordance of HIV integration dates estimated from RTT vs. OGR for LANL HIV RNA (A), LANL HIV RNA/DNA (B), and reservoir characterization (C) datasets. Results colored by unique individuals. For A and B, scales are in years before first sampling.

Similar articles

Cited by

References

    1. Chun TW, et al. Presence of an inducible HIV-1 latent reservoir during highly active antiretroviral therapy. Proc Natl Acad Sci USA. 1997;94:13193–13197. - PMC - PubMed
    1. Finzi D, et al. Identification of a reservoir for HIV-1 in patients on highly active antiretroviral therapy. Science. 1997;278:1295–1300. - PubMed
    1. Archin NM, Sung JM, Garrido C, Soriano-Sarabia N, Margolis DM. Eradicating HIV-1 infection: Seeking to clear a persistent pathogen. Nat Rev Microbiol. 2014;12:750–764. - PMC - PubMed
    1. Pace MJ, Agosto L, Graf EH, O’Doherty U. HIV reservoirs and latency models. Virology. 2011;411:344–354. - PMC - PubMed
    1. Richman DD, et al. The challenge of finding a cure for HIV infection. Science. 2009;323:1304–1307. - PubMed

Publication types

MeSH terms

Associated data

LinkOut - more resources