. 2018 Sep 18;115(38):E8987-E8995.
doi: 10.1073/pnas.1806215115. Epub 2018 Sep 5.

Elimination of the error signal in the superior colliculus impairs saccade motor learning

Affiliations

Elimination of the error signal in the superior colliculus impairs saccade motor learning

Yoshiko Kojima et al. Proc Natl Acad Sci U S A. .

Abstract

When movements become dysmetric, the resultant motor error induces a plastic change in the cerebellum to correct the movement, i.e., motor adaptation. Current evidence suggests that the error signal to the cerebellum is delivered by complex spikes originating in the inferior olive (IO). To prove a causal link between the IO error signal and motor adaptation, several studies blocked the IO, which, unfortunately, affected not only the adaptation but also the movement itself. We avoided this confound by inactivating the source of an error signal to the IO. Several studies implicate the superior colliculus (SC) as the source of the error signal to the IO for saccade adaptation. When we inactivated the SC, the metrics of the saccade to be adapted were unchanged, but saccade adaptation was impaired. Thus, an intact rostral SC is necessary for saccade adaptation. Our data provide experimental evidence for the cerebellar learning theory that requires an error signal to drive motor adaptation.

Keywords: cerebellum; error signal; motor learning; saccade; superior colliculus.


Conflict of interest statement

The authors declare no conflict of interest.

Figures

Fig. 1.
Fig. 1.
Injection and adaptation procedures. (A) Muscimol injection into the rostral SC. A 35-gauge epoxylite-insulated stainless steel tube delivers microstimulation to evoke a saccade and muscimol to inactivate that portion of SC (pink). Green arrow represents the injection site’s preferred vector, called the visual error vector. Blue arrow shows a 10° vector in the preferred vector direction (preferred bigger vector); red arrow represents a 15° vector in the nonpreferred direction (adapt saccade vector). A unilateral injection inactivates the visual error vector (green arrow) but does not affect the adapt saccade vector (red arrow), which is represented in the other SC. (B) The intrasaccadic adapt target step is held constant at the visual error vector. Target step vectors (red, blue, and green arrows) used in the constant error paradigm are the same as those in A.
Fig. 2.
Fig. 2.
Effect of muscimol on saccades congruent with the (A and B) visual error vector and (C and D) adapt saccade vector in injection experiment 1 (Exp. 1 in Table 1). (A and C) Time course of gain change before, during, and after the injection but before the adaptation session. (B and D) Time course of reaction time before, during, and after the injection but before the adaptation session. Each dot indicates a saccade. Box plots indicate the first and last 25 saccades of preinjection and postinjection, respectively. For the visual error vector, the injection produced a significant change in both saccade gain (A) and reaction time (B). For the adapt saccade vector, the reaction time was slightly decreased (D), but the gain was unchanged (C).
Fig. 3.
Fig. 3.
Effect of muscimol on saccades congruent with (A) the visual error vector, (B) the adapt saccade vector, and (C) preferred bigger vector for all six injection experiments. Circles show the median of the first and last 25 saccades of preinjection and postinjection, respectively. Solid and dashed lines indicate whether the first and last medians, respectively, are significantly different or not. Arrows indicate data from experiment 1 in Fig. 2.
Fig. 4.
Fig. 4.
Gain change during adaptation for datasets (A) 1 and (B) 6. Black dots represent individual saccades, and black lines are exponential fits for the injection data. Gray lines are exponential fits for the three associated control experiments. The exponential fits for the injection and associated control datasets are significantly different.
Fig. 5.
Fig. 5.
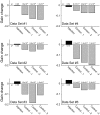
Gain change during gain decrease adaptation for all six datasets. Black bars indicate the injection experiments; gray bars indicate the three control experiments associated with each injection. None of the injection experiments exhibited a significant gain change, whereas all of the control experiments did.
Fig. 6.
Fig. 6.
Changes in saccade (A, C, and E) peak velocity and (B, D, and F) duration during adaptation. (A and B) Time course of the changes during adaptation in dataset 1. Black dots represent individual saccades in the injection experiment. Black circles are the median of the first and last 25 saccades. Gray circles are medians of the first and last 25 saccades of three associated control experiments. Summary of all (C and D) injection experiments and (E and F) control experiments. Circles are the medians of the first and last 25 saccades of each experiment. Solid and dashed lines indicate whether the first and last medians, respectively, are significantly different or not. None of the injection experiments were associated with a significant change in peak velocity (C), whereas most control experiments were (E). No injection experiment (D) and most of the control experiments (F) were not associated with significant changes in saccade duration.
Fig. 7.
Fig. 7.
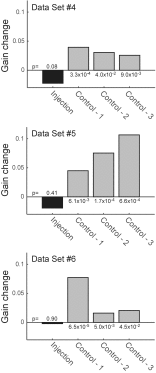
Gain change during gain increase adaptation for three selected datasets. Black bars indicate the injection experiments; gray bars indicate the three control experiments associated with each injection. None of the injection experiments exhibited a significant gain change, whereas all of the control experiments did.
Fig. 8.
Fig. 8.
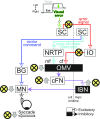
Schematic of saccade neural circuits and changes that occur there during adaptation. Gray arrows indicate the changes in neural activity during gain decrease adaptation. Yellow and black X marks indicate that the plastic changes in the OMV no longer occur after a muscimol injection into the SC eliminates the error signal. BG, saccade burst generator; cf, climbing fibers; cFN, caudal fastigial nucleus; IBN, inhibitory burst neuron; IO, inferior olive; mf, mossy fibers; MN, abducens motoneuron; NRTP, nucleus reticularis tegmenti pontis; OMV, oculomotor vermis; SC, superior colliculus.

Similar articles

Cited by

References

    1. Albus JS. A theory of cerebellar function. Math Biosci. 1971;10:25–61.
    1. Marr D. A theory of cerebellar cortex. J Physiol. 1969;202:437–470. - PMC - PubMed
    1. Ito M. Bases and implications of learning in the cerebellum—Adaptive control and internal model mechanism. Prog Brain Res. 2005;148:95–109. - PubMed
    1. Demer JL, Robinson DA. Effects of reversible lesions and stimulation of olivocerebellar system on vestibuloocular reflex plasticity. J Neurophysiol. 1982;47:1084–1107. - PubMed
    1. de’Sperati C, Lopiano L, Montarolo PG. Lesions of the inferior olive do not affect long- or short-term habituation of the acoustic startle response in rats. Neurosci Lett. 1989;100:164–168. - PubMed

Publication types