. 2018 Oct 29;92(22):e00728-18.
doi: 10.1128/JVI.00728-18. Print 2018 Nov 15.

The Coronavirus Transmissible Gastroenteritis Virus Evades the Type I Interferon Response through IRE1α-Mediated Manipulation of the MicroRNA miR-30a-5p/SOCS1/3 Axis

Affiliations

The Coronavirus Transmissible Gastroenteritis Virus Evades the Type I Interferon Response through IRE1α-Mediated Manipulation of the MicroRNA miR-30a-5p/SOCS1/3 Axis

Yanlong Ma et al. J Virol. .

Abstract

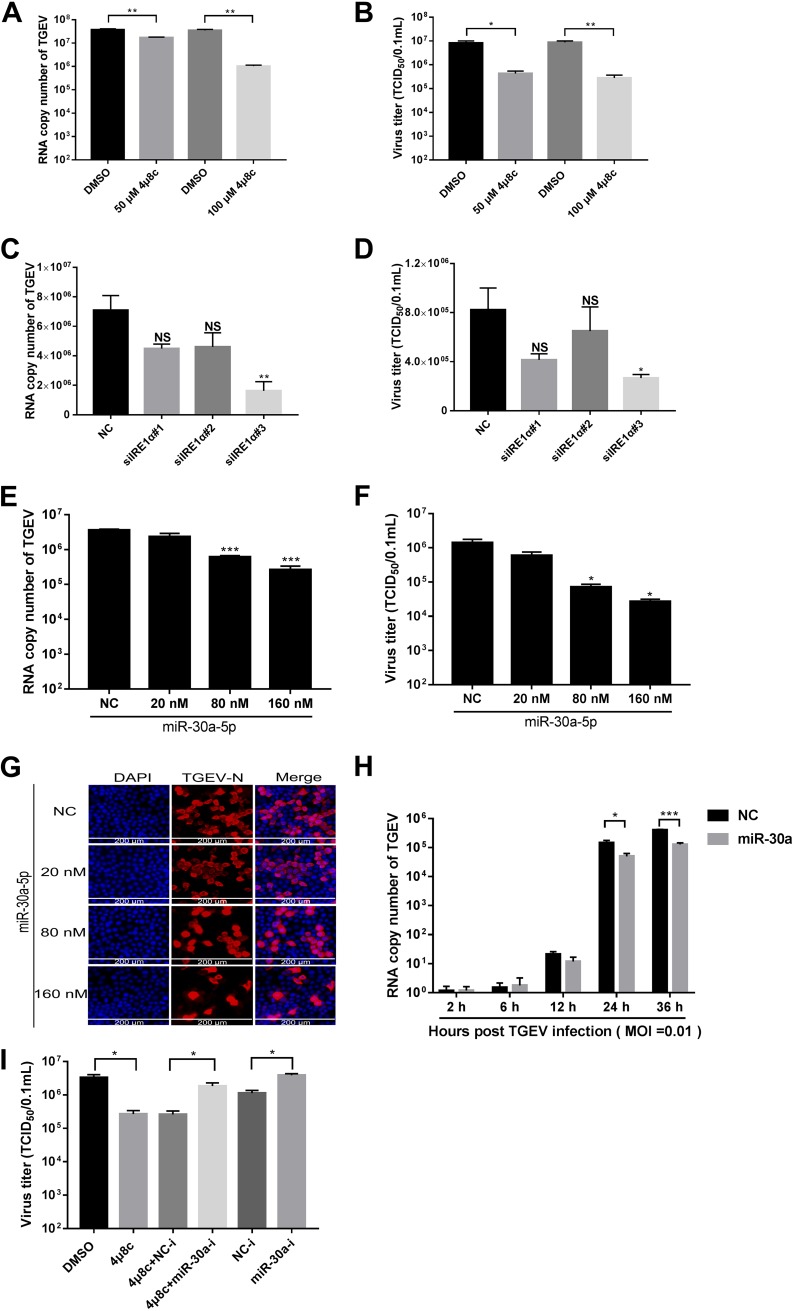
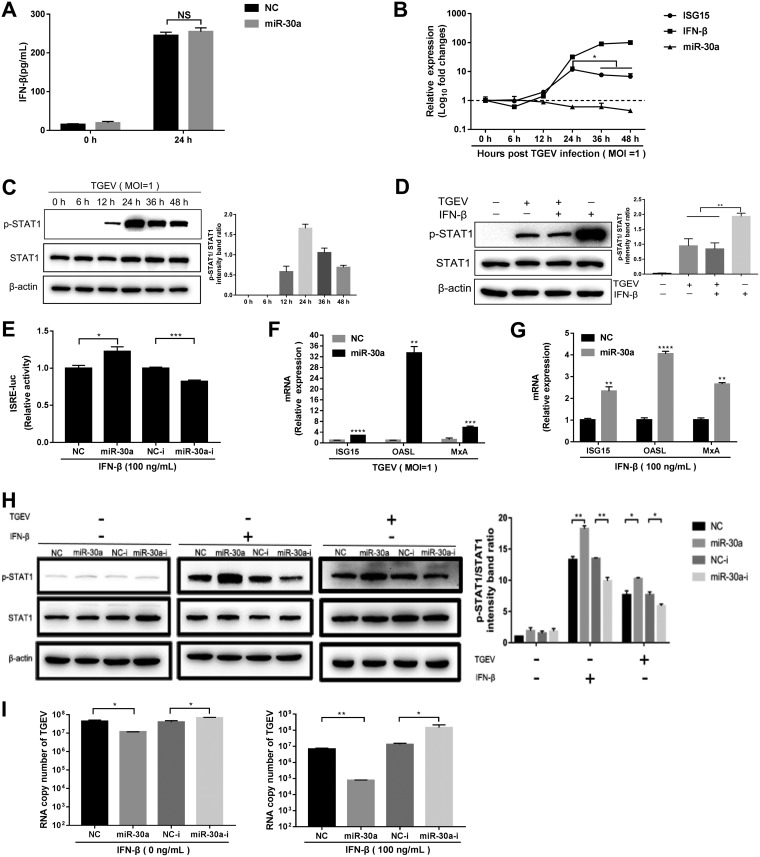
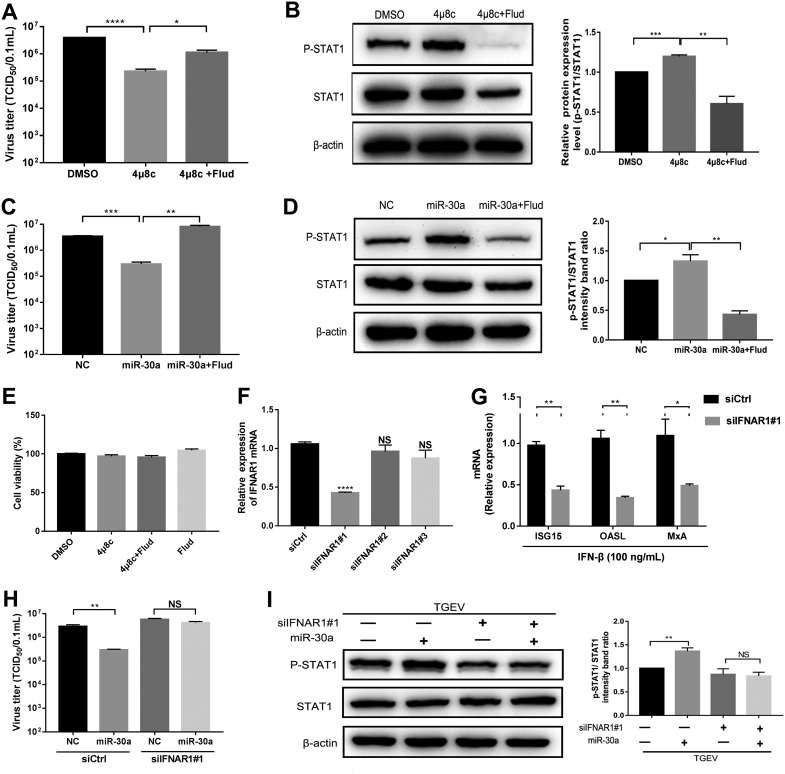
In host innate immunity, type I interferons (IFN-I) are major antiviral molecules, and coronaviruses have evolved diverse strategies to counter the IFN-I response during infection. Transmissible gastroenteritis virus (TGEV), a member of the Alphacoronavirus family, induces endoplasmic reticulum (ER) stress and significant IFN-I production after infection. However, how TGEV evades the IFN-I antiviral response despite the marked induction of endogenous IFN-I has remained unclear. Inositol-requiring enzyme 1 α (IRE1α), a highly conserved ER stress sensor with both kinase and RNase activities, is involved in the IFN response. In this study, IRE1α facilitated TGEV replication via downmodulating the host microRNA (miR) miR-30a-5p abundance. miR-30a-5p normally enhances IFN-I antiviral activity by directly targeting the negative regulators of Janus family kinase (JAK)-signal transducer and activator of transcription (STAT), the suppressor of cytokine signaling protein 1 (SOCS1), and SOCS3. Furthermore, TGEV infection increased SOCS1 and SOCS3 expression, which dampened the IFN-I antiviral response and facilitated TGEV replication. Importantly, compared with mock infection, TGEV infection in vivo resulted in decreased miR-30a-5p levels and significantly elevated SOCS1 and SOCS3 expression in the piglet ileum. Taken together, our data reveal a new strategy used by TGEV to escape the IFN-I response by engaging the IRE1α-miR-30a-5p/SOCS1/3 axis, thus improving our understanding of how TGEV escapes host innate immune defenses.IMPORTANCE Type I interferons (IFN-I) play essential roles in restricting viral infections. Coronavirus infection induces ER stress and the interferon response, which reflects different adaptive cellular processes. An understanding of how coronavirus-elicited ER stress is actively involved in viral replication and manipulates the host IFN-I response has remained elusive. Here, TGEV inhibited host miR-30a-5p via the ER stress sensor IRE1α, which led to the increased expression of negative regulators of JAK-STAT signaling cascades, namely, SOCS1 and SOCS3. Increased SOCS1 or SOCS3 expression impaired the IFN-I antiviral response, promoting TGEV replication. These findings enhance our understanding of the strategies used by coronaviruses to antagonize IFN-I innate immunity via IRE1α-mediated manipulation of the miR-30a-5p/SOCS axis, highlighting the crucial role of IRE1α in innate antiviral resistance and the potential of IRE1α as a novel target against coronavirus infection.

Keywords: IRE1α; SOCS; miR-30a-5p; transmissible gastroenteritis virus (TGEV); type I interferon.


Figures

FIG 1
FIG 1
TGEV infection suppresses miR-30a-5p expression in vitro and in vivo. (A) The ER stress inducer Tg decreased miR-30a-5p expression in ST cells. The miR-30a-5p levels in ST cells were measured by RT-qPCR after Tg treatment for 24 h. (B to E) TGEV infection downregulated miR-30a-5p expression in vitro. The miR-30a-5p levels (B) and TGEV infection (C) in ST cells were measured by RT-qPCR at 24 hpi at different MOIs. For time kinetics, the levels of miR-30a-5p (D) and TGEV genomes (E) in ST cells were quantified at the indicated time points after infection with TGEV at an MOI of 1. The results from three independent experiments are shown. (F, G) TGEV infection suppressed miR-30a-5p expression in vivo. Piglets were orally inoculated with 5 ml 1 × 10⁵ TCID50 TGEV or DMEM. Total cellular RNA from each ileum was collected at 48 hpi, and the levels of miR-30a-5p (F) and TGEV viral RNA in the ileum (G) were measured by RT-qPCR. *, P < 0.05; **, P < 0.01; ***, P < 0.001; NS, not significant versus the mock-infected control.
FIG 2
FIG 2
Activated IRE1α reduces miR-30a-5p abundance. (A) Analysis of IRE1α activation by XBP1 mRNA splicing. IRE1α activation by TGEV infection was analyzed by PCR amplification of total XBP1 cDNA and further digestion with PstI, as previously described (40). The sizes of the PCR-amplified fragments from spliced and unspliced XBP1 DNA with or without PstI cleavage are also listed. The PCR fragments of total XBP1, spliced XBP1, and unspliced XBP1 DNA in ST cells that were infected with TGEV at an MOI of 1 for various time points or treated with Tg (1 μM) for 24 h are shown. The PCR products of the housekeeping gene GAPDH (glyceraldehyde-3-phosphate dehydrogenase), used as an internal control, are shown in the top panel. The ratio of the band intensities for spliced and total XBP1 DNA in the infected cells was normalized to that in the mock-infected cells. ORF, open reading frame. (B) TGEV infection upregulated ERdj4 expression. The relative expression of ERdj4 normalized to that of GAPDH following TGEV infection was measured and is presented. (C) Analysis of IRE1α activation in partial samples from the assay whose results are presented in panel A, D, or E. (D, E) The inhibition of IRE1α by 4μ8c rescued the suppression of miR-30a-5p by TGEV (D) or Tg (E). ST cells were pretreated with 50 or 100 μM 4μ8c for 2 h, followed by TGEV infection (MOI = 1) (D) or Tg (1 μM) treatment (E). The relative expression of miR-30a-5p normalized to that of internal U6 siRNA was measured by RT-qPCR after 24 h. The results are presented as the relative expression of miR-30a-5p in ST cells normalized to that of miR-30a-5p in the mock-infected control cells. *, P < 0.05; **, P < 0.01; ***, P < 0.001; NS, not significant. (F to H) Knockdown of IRE1α rescued miR-30a-5p suppression following TGEV infection or Tg treatment. ST cells were transfected with siIRE1α#1, siIRE1α#2, siIRE1α#3, or scrambled control siRNA (NC) at 100 nM for 24 h, followed by infection with TGEV for 24 h at an MOI of 0.01 (F, G) or treatment with Tg (1 μM) for 24 h (H). Next, the cells were harvested to determine the efficiency of IRE1α knockdown (F) or miR-30a-5p expression (G, H). The results represent those from three independent experiments. *, P < 0.05; **, P < 0.01; ***, P < 0.001; NS, not significant.
FIG 3
FIG 3
miR-30a-5p inhibits the replication of TGEV. (A, B) The inhibition of IRE1α by 4μ8c suppressed TGEV infection (MOI = 1) in ST cells. ST cells were pretreated with 50 or 100 μM 4μ8c for 2 h and then infected with TGEV (MOI = 1); TGEV RNA (A) and titers (B) were measured at 24 hpi. *, P < 0.05; **, P < 0.01. (C, D) IRE1α knockdown by siRNAs decreased TGEV replication. ST cells were transfected with IRE1α siRNA or the scrambled control siRNA (siRNA NC) at 100 nM, followed by infection with TGEV (MOI = 0.01); TGEV RNA (C) and titers (D) were quantified at 24 hpi. *, P < 0.05; **, P < 0.01 versus siRNA NC-transfected control cells. (E to G) miR-30a-5p overexpression inhibited TGEV infection. ST cells were transfected with miR-30a-5p mimics at the indicated doses (20, 80, and 160 nM) for 24 h, followed by infection with TGEV for 24 h at an MOI of 0.01. TGEV infection was determined at 24 hpi by RT-qPCR (E) or titration (F). *, P < 0.05; ***, P < 0.001 versus mimic NC. (G) The suppression of TGEV infection by miR-30a-5p was confirmed by IFA. TGEV-N, N protein of TGEV. (H) miR-30a-5p suppressed TGEV replication at the late stages of infection. ST cells were transfected with 160 nM miR-30a-5p mimics for 24 h and then infected with TGEV at an MOI of 0.01. TGEV infection was analyzed at 2, 6, 12, 24, or 36 hpi. *, P < 0.05; ***, P < 0.001. (I) The miR-30a-5p inhibitor rescued TGEV suppression by 4μ8c. ST cells were transfected with 160 nM miR-30a-5p inhibitor or NC inhibitor. After 24 h of transfection, ST cells were treated with 100 μM 4μ8c for 2 h and then infected with TGEV (MOI = 1). TGEV infection was measured at 24 hpi. *, P < 0.05.
FIG 4
FIG 4
miR-30a-5p enhances IFN-I antiviral signaling rather than IFN-I production. (A) miR-30a-5p did not manipulate IFN-β production. ST cells were transfected with 160 nM miR-30a-5p mimics or NC mimics for 24 h, followed by infection with TGEV (MOI = 0.01) for 24 h. The IFN-β levels in the supernatant were measured by ELISA. NS, not significant. (B, C) TGEV infection antagonized interferon signaling at the late stages of infection. ST cells were infected with TGEV at an MOI of 1, and then the samples were collected at different times for the quantification of ISG15, IFN-β, and miR-30a-5p expression (B) or the Western blotting of pSTAT1, STAT1, or β-actin (C). *, P < 0.05. (D) TGEV infection impaired IFN-I-elicited STAT1 signaling. ST cells were infected with TGEV at an MOI of 1 for 36 h, followed by stimulation with IFN-β for 30 min. Then, cells were lysed and collected for Western blotting of pSTAT1, STAT1, or β-actin. *, P < 0.05. (E) miR-30a-5p modulated the activity of the ISRE reporter vector following IFN-β stimulation. The ISRE reporter vector and pRL-TK were cotransfected with the indicated miR-30a-5p mimics, NC mimics, miR-30a-5p inhibitor, or NC inhibitor into ST cells for 24 h, followed by stimulation with IFN-β (100 ng/ml). Cells were harvested for luciferase (luc) assay at 12 h after IFN-β stimulation. *, P < 0.05; ***, P < 0.001. (F to H) miR-30a-5p promoted IFN-β signaling. The cells were transfected with 160 nM miR-30a-5p mimics, NC mimics, miR-30a-5p inhibitor, or NC inhibitor for 24 h, followed by IFN-β treatment or TGEV infection (MOI = 1). The samples were collected at 24 h after TGEV infection or IFN-β stimulation for the quantification of ISG expression (F, G) and for Western blotting of pSTAT1, STAT1, or β-actin (H). Quantifications were normalized to those for the mock-treated and uninfected NC. *, P < 0.05; **, P < 0.01; ***, P < 0.001; ****, P < 0.0001. (I) miR-30a-5p enhanced the anti-TGEV activity of IFN-β. After transfection with miR-30a-5p mimics or inhibitor for 24 h, cells were pretreated with IFN-β or DMEM for 24 h and then infected with TGEV (MOI = 0.01) and harvested at 24 hpi for viral RNA quantification. *, P < 0.05; **, P < 0.01; ***, P < 0.001; NS, not significant.
FIG 5
FIG 5
miR-30a-5p targets the 3′ UTRs of SOCS1 and SOCS3. (A) Schematic diagram of the predicted target sites of miR-30a-5p in the SOCS1 and SOCS3 3′ UTRs of six representative mammals. The predicted target sites and mutated target sites of miR-30a-5p are underlined and were mutated as indicated. (B) Results of the luciferase assay. ST cells were cotransfected with SOCS1 or SOCS3 wild-type or mutant luciferase vectors (500 ng) and 160 nM miR-30a-5p mimics or NC mimics, miR-30a-5p inhibitor, or NC inhibitor, and the luciferase activity was analyzed at 30 h after transfection. FL, firefly luciferase; RL, Renilla luciferase. (C) The suppression of SOCS1 and SOCS3 mRNA levels by miR-30a-5p under TGEV-uninfected conditions. ST cells were transfected with 160 nM NC mimics, miR-30a-5p mimics, NC inhibitor, or miR-30a-5p inhibitor. The expression levels of SOCS1 and SOCS3 were analyzed by RT-qPCR at 48 h after transfection. The relative expression of SOCS1 and SOCS3 was normalized to that of the NC control. Bars represent the means ± SEM (n = 3). (D) The suppression of SOCS1 and SOCS3 protein levels by miR-30a-5p under TGEV-uninfected and -infected conditions. ST cells were transfected as described in the legend to panel C for 24 h, followed by infection with TGEV (MOI = 1) or mock infection with DMEM, and the samples were collected at 24 h for Western blotting of SOCS1, SOCS3, or β-actin. Quantifications were normalized to those for the uninfected NC. (E to G) TGEV infection upregulated SOCS1 and SOCS3 expression. (E) The SOCS1 and SOCS3 expression levels in ST cells were measured by RT-qPCR at 24 hpi at different MOIs. P values represent the difference from the mock-infected control. For time kinetics, the SOCS1 and SOCS3 mRNA levels (F) or SOCS1 and SOCS3 protein levels (G) in ST cells were measured at the indicated time points after infection with TGEV at an MOI of 1. (H) Treatment with 4μ8c abolished the upregulation of SOCS1 and SOCS3 by TGEV infection by modulating miR-30a-5p. ST cells were transfected with 160 nM miR-30a-5p inhibitor for 24 h. Next, ST cells were pretreated with 100 μM 4μ8c or DMSO for 2 h, followed by infection with TGEV (MOI = 1). Cells were collected for RT-qPCR analysis for determination of SOCS1 and SOCS3 expression at 24 hpi. (I, J) Elevated expression of SOCS1 and SOCS3 in the ilea after TGEV infection. The expression of SOCS1 (I) and SOCS3 (J) in the ilea at 48 hpi was quantified by RT-qPCR. Bars represent the means ± SEM. *, P < 0.05; **, P < 0.01; ***, P < 0.001; ****, P < 0.0001; NS, not significant.
FIG 6
FIG 6
Increased expression of SOCS1 or SOCS3 dampens the IFN-I antiviral response and promotes TGEV replication. (A) Overexpression of SOCS1 and SOCS3 in ST cells. ST cells were transfected as indicated with pCAGGS-HA, pCAGGS-SOCS1, or pCAGGS-SOCS3 for 48 h, and the transient expression of SOCS1 and SOCS3 was confirmed by IFA with anti-HA staining. (B) SOCS1 or SOCS3 overexpression suppressed the activation of STAT1 by IFN-β and TGEV infection. ST cells were transfected as indicated with pCAGGS-HA, pCAGGS-SOCS1, or pCAGGS-SOCS3 for 24 h, followed by incubation with porcine IFN-β (100 ng/ml) or infection with TGEV (MOI = 1). Cells were collected for Western blotting of pSTAT1, STAT1, or β-actin after 24 h. P values represent the difference from the vector control. (C, D) SOCS1 or SOCS3 overexpression enhanced TGEV infection and undermined the anti-TGEV activity of IFN-β. ST cells were transfected as described in the legend to panel B, followed by incubation with porcine IFN-β (C) or DMEM (D) for 24 h. Then, cells were infected with TGEV at an MOI of 0.01; TGEV infection was determined at 24 hpi. (E) Knockdown of SOCS1 and SOCS3 by siRNAs in ST cells. ST cells were harvested for Western blotting of SOCS1 and SOCS3 expression at 48 h after transfection with 100 nM siSOCS1s, siSOCS3s, or scrambled control siRNA. (F) Enhancement of the anti-TGEV activity of IFN-β by knockdown of SOCS1 or SOCS3 in ST cells. ST cells were transfected with siSOCS1s, siSOCS3s, or the scrambled control siRNA for 24 h, followed by incubation with IFN-β for 24 h. Then, the cells were infected with TGEV (MOI = 0.01) and harvested for quantification of TGEV infection at 24 hpi. (G) Silencing of SOCS1 or SOCS3 boosted IFN-β signaling under IFN-β-stimulated conditions. ST cells were stimulated with IFN-β at 24 h after transfection with siSOCS1#1, siSOCS3#3, or the scrambled control siRNA, and cells were collected for RT-qPCR analysis of ISG15, OASL, or MxA expression relative to that of GAPDH after 24 h of stimulation. (H) Silencing of SOCS1 or SOCS3 decreased TGEV infection under IFN-β-unstimulated conditions. ST cells were transfected with siSOCS1#1, siSOCS3#3, or the scrambled control siRNA for 24 h. Then, cells were infected TGEV (MOI = 0.01) and harvested for quantification of TGEV infection at 24 hpi. (I) Silencing of SOCS1 or SOCS3 boosted IFN-β signaling under TGEV-infected conditions. ST cells were treated as described in the legend to panel H, and cells were collected for RT-qPCR analysis of ISG15, OASL, or MxA expression relative to that of GAPDH. *, P < 0.05; **, P < 0.01; ***, P < 0.001; ****, P < 0.0001; NS, not significant.
FIG 7
FIG 7
IRE1α facilitates TGEV infection by modulating the miR-30a-5p/SOCS axis. (A, B) The blockage of STAT1 activation rescued the viral suppression of 4μ8c. ST cells were pretreated with 100 μM 4μ8c for 2 h or 100 μM 4μ8c for 2 h plus 10 μM fludarabine (Flud) for 24 h, followed by infection with TGEV (MOI = 1). Then, the TGEV titer (A) was measured at 24 hpi, and STAT1 and p-STAT1 were analyzed by Western blotting (B). (C, D) The blockage of STAT1 activation rescued the viral suppression of miR-30a-5p. ST cells were transfected with 160 nM NC mimics, miR-30a-5p mimics, or miR-30a-5p mimics plus stimulation with 10 μM fludarabine for 24 h, followed by infection with TGEV (MOI = 1). Next, the TGEV titer (C) was measured at 24 hpi, and STAT1 and p-STAT1 were analyzed by Western blotting (D). (E) Effect of 4μ8c and fludarabine on cell viability. ST cells were treated with 4μ8c, 4μ8c plus fludarabine, fludarabine only, or the carrier control (DMSO) as described above. Cell cytotoxicity was analyzed with a CCK-8 system as described in Materials and Methods. (F) Knockdown of IFNAR1 by siRNAs in ST cells. ST cells were harvested for RT-qPCR analysis of IFNAR1 expression at 48 h after transfection with 100 nM siRNAs or scrambled control siRNA (siCtrl). (G) Silencing of IFNAR1 dampened IFN-β signaling under IFN-β-stimulated conditions. ST cells were transfected with 100 nM siIFNAR1#1 or scrambled control siRNA for 24 h, followed by incubation with IFN-β for 24 h. Then, the cells were collected for RT-qPCR analysis of ISG15, OASL, or MxA expression relative to that of GAPDH. (H, I) Silencing of IFNAR1 abolished viral suppression (H) and enhancement of p-STAT1 (I) of miR-30a-5p. NC mimics or miR-30a-5p mimics (160 nM) were cotransfected with 100 nM siIFNAR1#1 or the scrambled control siRNA in ST cells for 24 h, followed by infection with TGEV (MOI = 1). The TGEV titer (H) and STAT1 and p-STAT1 levels (I) were measured at 24 hpi. *, P < 0.05; **, P < 0.01; ***, P < 0.001; ****, P < 0.0001; NS, not significant.
FIG 8
FIG 8
TGEV antagonizes IFN-I-related innate immunity via IRE1α-mediated manipulation of the miR-30a-5p/SOCS axis. During TGEV infection, TGEV activates IRE1α, which reduces miR-30a-5p abundance. The decreased level of miR-30a-5p dampens IFN-I antiviral signaling by increasing the expression of SOCS1 and SOCS3, leading to viral escape from the IFN-I response. Pri-miR-30a, primary miR-30a.

Similar articles

Cited by

References

    1. Cruz JL, Sola I, Becares M, Alberca B, Plana J, Enjuanes L, Zuniga S. 2011. Coronavirus gene 7 counteracts host defenses and modulates virus virulence. PLoS Pathog 7:e1002090. doi:10.1371/journal.ppat.1002090. - DOI - PMC - PubMed
    1. Fung TS, Liu DX. 2014. Coronavirus infection, ER stress, apoptosis and innate immunity. Front Microbiol 5:296. doi:10.3389/fmicb.2014.00296. - DOI - PMC - PubMed
    1. Favreau DJ, Desforges M, St-Jean JR, Talbot PJ. 2009. A human coronavirus OC43 variant harboring persistence-associated mutations in the S glycoprotein differentially induces the unfolded protein response in human neurons as compared to wild-type virus. Virology 395:255–267. doi:10.1016/j.virol.2009.09.026. - DOI - PMC - PubMed
    1. Versteeg GA, van de Nes PS, Bredenbeek PJ, Spaan WJ. 2007. The coronavirus spike protein induces endoplasmic reticulum stress and upregulation of intracellular chemokine mRNA concentrations. J Virol 81:10981–10990. doi:10.1128/JVI.01033-07. - DOI - PMC - PubMed
    1. DeDiego ML, Nieto-Torres JL, Jimenez-Guardeno JM, Regla-Nava JA, Alvarez E, Oliveros JC, Zhao J, Fett C, Perlman S, Enjuanes L. 2011. Severe acute respiratory syndrome coronavirus envelope protein regulates cell stress response and apoptosis. PLoS Pathog 7:e1002315. doi:10.1371/journal.ppat.1002315. - DOI - PMC - PubMed

Publication types

MeSH terms

LinkOut - more resources