

Antibody-Mediated CD4 Depletion Induces Homeostatic CD4+ T Cell Proliferation without Detectable Virus Reactivation in Antiretroviral Therapy-Treated Simian Immunodeficiency Virus-Infected Macaques
- PMID: 30185596
- PMCID: PMC6206490
- DOI: 10.1128/JVI.01235-18
Antibody-Mediated CD4 Depletion Induces Homeostatic CD4+ T Cell Proliferation without Detectable Virus Reactivation in Antiretroviral Therapy-Treated Simian Immunodeficiency Virus-Infected Macaques
Abstract
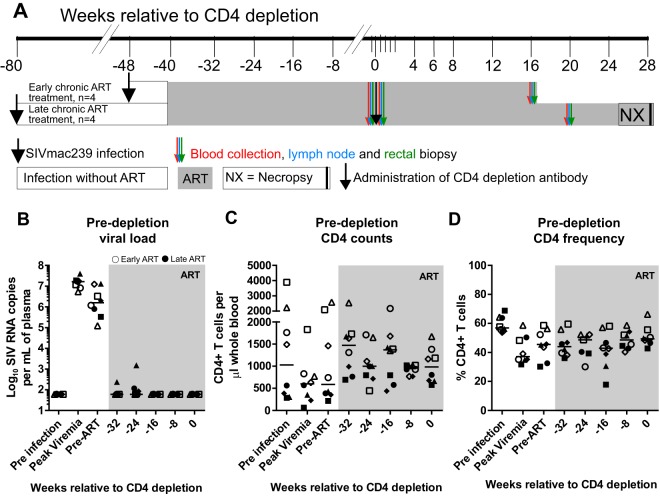
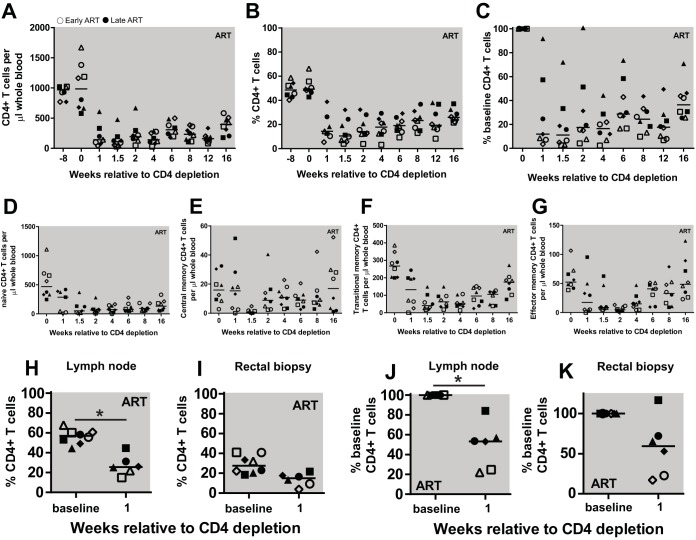
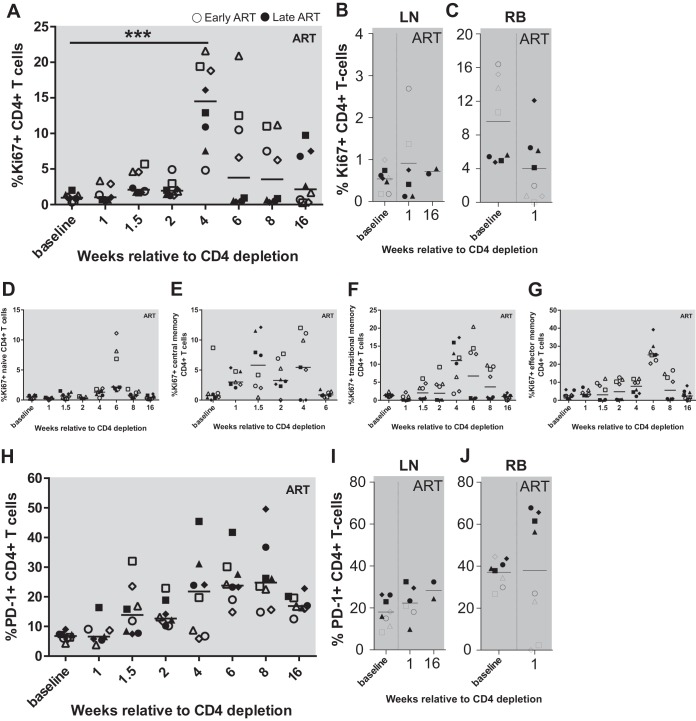
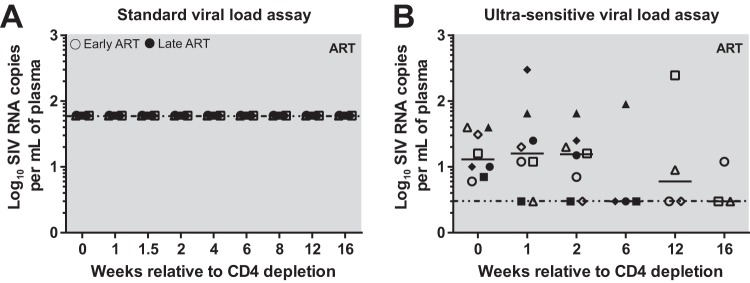
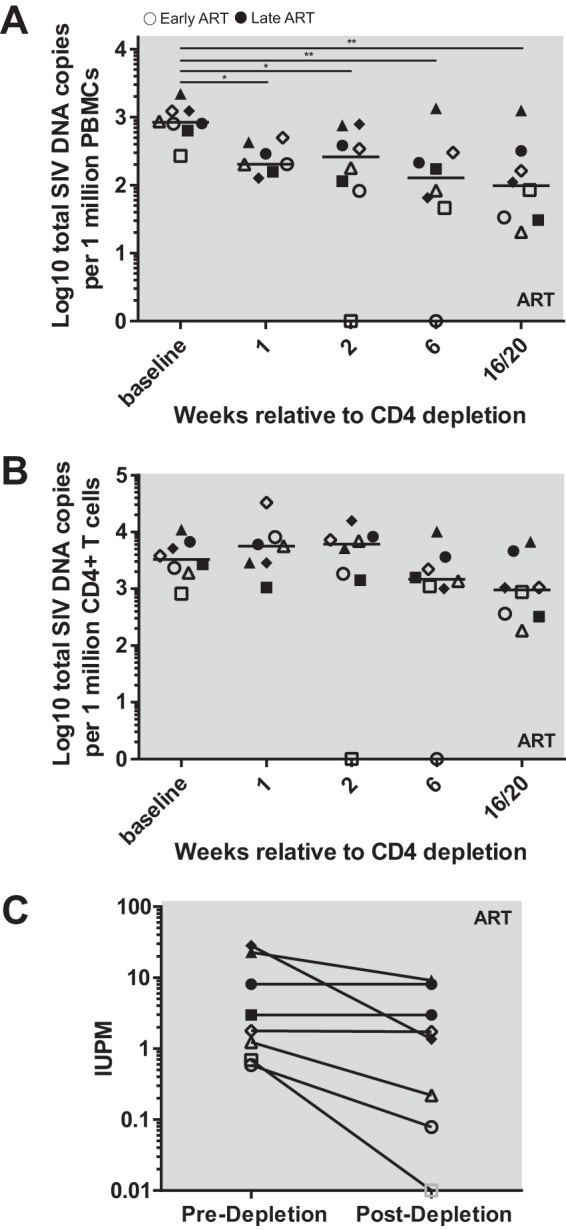
A major barrier to human immunodeficiency virus (HIV) eradication is the long-term persistence of latently infected CD4+ T cells harboring integrated replication-competent virus. It has been proposed that the homeostatic proliferation of these cells drives long-term reservoir persistence in the absence of virus reactivation, thus avoiding cell death due to either virus-mediated cytopathicity or immune effector mechanisms. Here, we conducted an experimental depletion of CD4+ T cells in eight antiretroviral therapy (ART)-treated, simian immunodeficiency virus (SIV)-infected rhesus macaques (RMs) to determine whether the homeostatically driven CD4+ T-cell proliferation that follows CD4+ T-cell depletion results in reactivation of latent virus and/or expansion of the virus reservoir. After administration of the CD4R1 antibody, we observed a CD4+ T cell depletion of 65 to 89% in peripheral blood and 20 to 50% in lymph nodes, followed by a significant increase in CD4+ T cell proliferation during CD4+ T cell reconstitution. However, this CD4+ T cell proliferation was not associated with detectable increases in viremia, indicating that the homeostatic activation of CD4+ T cells is not sufficient to induce virus reactivation from latently infected cells. Interestingly, the homeostatic reconstitution of the CD4+ T cell pool was not associated with significant changes in the number of circulating cells harboring SIV DNA compared to results for the first postdepletion time point. This study indicates that, in ART-treated SIV-infected RMs, the homeostasis-driven CD4+ T-cell proliferation that follows experimental CD4+ T-cell depletion occurs in the absence of detectable reactivation of latent virus and does not increase the size of the virus reservoir as measured in circulating cells.IMPORTANCE Despite successful suppression of HIV replication with antiretroviral therapy, current treatments are unable to eradicate the latent virus reservoir, and treatment interruption almost invariably results in the reactivation of HIV even after decades of virus suppression. Homeostatic proliferation of latently infected cells is one mechanism that could maintain the latent reservoir. To understand the impact of homeostatic mechanisms on virus reactivation and reservoir size, we experimentally depleted CD4+ T cells in ART-treated SIV-infected rhesus macaques and monitored their homeostatic rebound. We find that depletion-induced proliferation of CD4+ T cells is insufficient to reactivate the viral reservoir in vivo Furthermore, the proportion of SIV DNA+ CD4+ T cells remains unchanged during reconstitution, suggesting that the reservoir is resistant to this mechanism of expansion at least in this experimental system. Understanding how T cell homeostasis impacts latent reservoir longevity could lead to the development of new treatment paradigms aimed at curing HIV infection.
Keywords: SIV; SIV reservoir; homeostatic proliferation.
Copyright © 2018 American Society for Microbiology.
Figures
Similar articles
-
Combination of CD8β Depletion and Interleukin-15 Superagonist N-803 Induces Virus Reactivation in Simian-Human Immunodeficiency Virus-Infected, Long-Term ART-Treated Rhesus Macaques.J Virol. 2020 Sep 15;94(19):e00755-20. doi: 10.1128/JVI.00755-20. Print 2020 Sep 15. J Virol. 2020. PMID: 32669328 Free PMC article.
-
Brain Macrophages in Simian Immunodeficiency Virus-Infected, Antiretroviral-Suppressed Macaques: a Functional Latent Reservoir.mBio. 2017 Aug 15;8(4):e01186-17. doi: 10.1128/mBio.01186-17. mBio. 2017. PMID: 28811349 Free PMC article.
-
Short-Term Pegylated Interferon α2a Treatment Does Not Significantly Reduce the Viral Reservoir of Simian Immunodeficiency Virus-Infected, Antiretroviral Therapy-Treated Rhesus Macaques.J Virol. 2018 Jun 29;92(14):e00279-18. doi: 10.1128/JVI.00279-18. Print 2018 Jul 15. J Virol. 2018. PMID: 29720521 Free PMC article.
-
Brain macrophages harbor latent, infectious simian immunodeficiency virus.AIDS. 2019 Dec 1;33 Suppl 2(Suppl 2):S181-S188. doi: 10.1097/QAD.0000000000002269. AIDS. 2019. PMID: 31789817 Free PMC article. Review.
-
HIV Persistence in Adipose Tissue Reservoirs.Curr HIV/AIDS Rep. 2018 Feb;15(1):60-71. doi: 10.1007/s11904-018-0378-z. Curr HIV/AIDS Rep. 2018. PMID: 29423731 Free PMC article. Review.
Cited by
-
Making a Monkey out of Human Immunodeficiency Virus/Simian Immunodeficiency Virus Pathogenesis: Immune Cell Depletion Experiments as a Tool to Understand the Immune Correlates of Protection and Pathogenicity in HIV Infection.Viruses. 2024 Jun 17;16(6):972. doi: 10.3390/v16060972. Viruses. 2024. PMID: 38932264 Free PMC article. Review.
-
In-depth single-cell analysis of translation-competent HIV-1 reservoirs identifies cellular sources of plasma viremia.Nat Commun. 2021 Jun 17;12(1):3727. doi: 10.1038/s41467-021-24080-1. Nat Commun. 2021. PMID: 34140517 Free PMC article.
-
Pathways towards human immunodeficiency virus elimination.EBioMedicine. 2020 Mar;53:102667. doi: 10.1016/j.ebiom.2020.102667. Epub 2020 Feb 27. EBioMedicine. 2020. PMID: 32114397 Free PMC article. Review.
-
CD8 lymphocyte depletion enhances the latency reversal activity of the SMAC mimetic AZD5582 in ART-suppressed SIV-infected rhesus macaques.J Virol. 2021 Mar 25;95(8):e01429-20. doi: 10.1128/JVI.01429-20. Epub 2021 Feb 10. J Virol. 2021. PMID: 33568515 Free PMC article.
-
Prolonged experimental CD4+ T-cell depletion does not cause disease progression in SIV-infected African green monkeys.Nat Commun. 2023 Feb 22;14(1):979. doi: 10.1038/s41467-023-36379-2. Nat Commun. 2023. PMID: 36813761 Free PMC article.
References
-
- UNAIDS. 2018. Latest statistics on the status of the AIDS epidemic. UNAIDS, Geneva, Switzerland: http://www.unaids.org/en/resources/fact-sheet.
-
- Finzi D, Blankson J, Siliciano JD, Margolick JB, Chadwick K, Pierson T, Smith K, Lisziewicz J, Lori F, Flexner C, Quinn TC, Chaisson RE, Rosenberg E, Walker B, Gange S, Gallant J, Siliciano RF. 1999. Latent infection of CD4+ T cells provides a mechanism for lifelong persistence of HIV-1, even in patients on effective combination therapy. Nat Med 5:512–517. doi:10.1038/8394. - DOI - PubMed
-
- Strain MC, Gunthard HF, Havlir DV, Ignacio CC, Smith DM, Leigh-Brown AJ, Macaranas TR, Lam RY, Daly OA, Fischer M, Opravil M, Levine H, Bacheler L, Spina CA, Richman DD, Wong JK. 2003. Heterogeneous clearance rates of long-lived lymphocytes infected with HIV: intrinsic stability predicts lifelong persistence. Proc Natl Acad Sci U S A 100:4819–4824. doi:10.1073/pnas.0736332100. - DOI - PMC - PubMed
-
- Chun TW, Carruth L, Finzi D, Shen X, DiGiuseppe JA, Taylor H, Hermankova M, Chadwick K, Margolick J, Quinn TC, Kuo YH, Brookmeyer R, Zeiger MA, Barditch-Crovo P, Siliciano RF. 1997. Quantification of latent tissue reservoirs and total body viral load in HIV-1 infection. Nature 387:183–188. doi:10.1038/387183a0. - DOI - PubMed
Publication types
MeSH terms
Substances
Grants and funding
LinkOut - more resources
Full Text Sources
Other Literature Sources
Research Materials
