. 2018 Nov;8(11):1458-1473.
doi: 10.1158/2159-8290.CD-18-0046. Epub 2018 Sep 5.

Cholinergic Signaling via Muscarinic Receptors Directly and Indirectly Suppresses Pancreatic Tumorigenesis and Cancer Stemness

Affiliations

Cholinergic Signaling via Muscarinic Receptors Directly and Indirectly Suppresses Pancreatic Tumorigenesis and Cancer Stemness

Bernhard W Renz et al. Cancer Discov. 2018 Nov.

Abstract

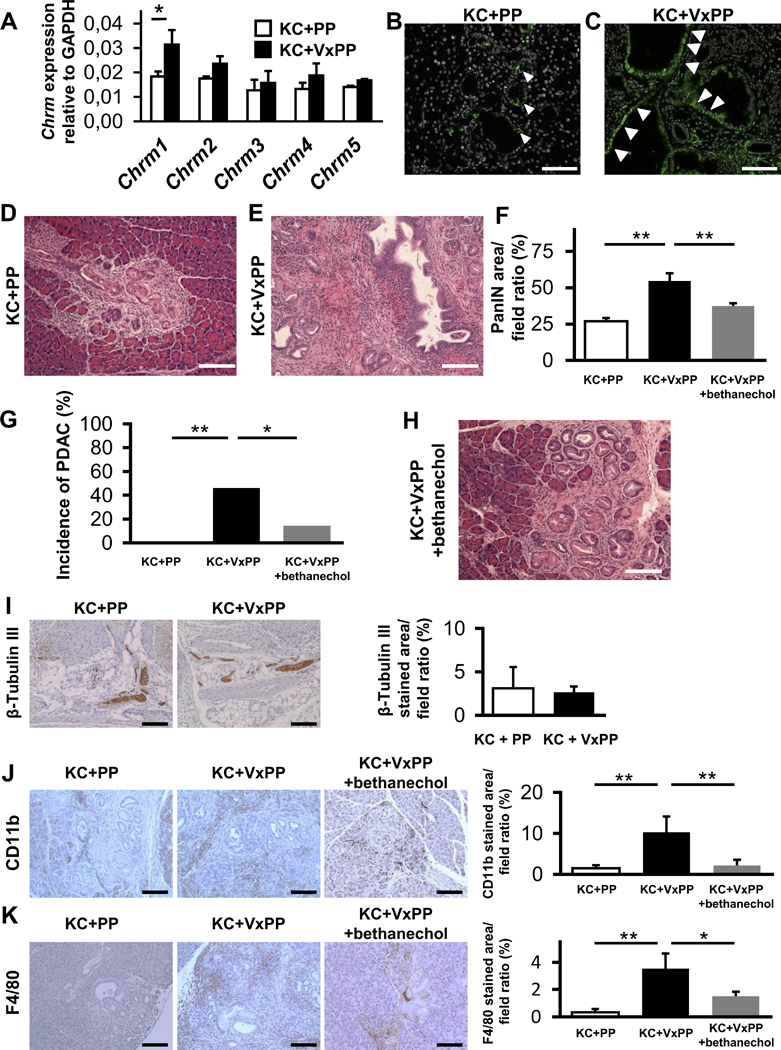
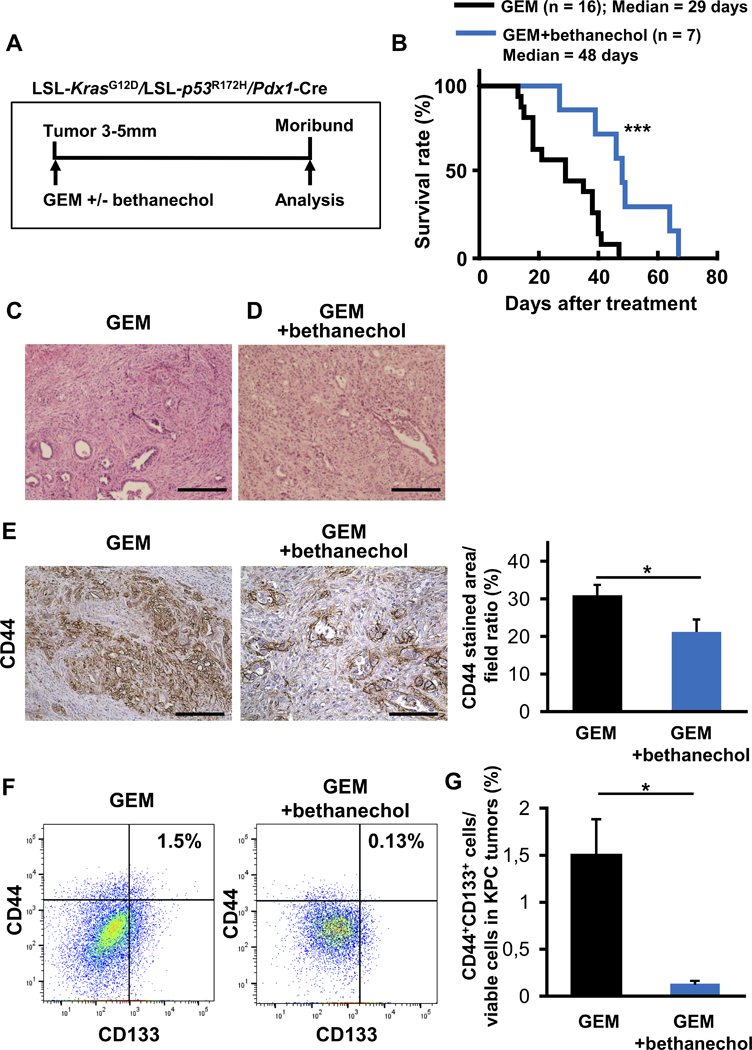
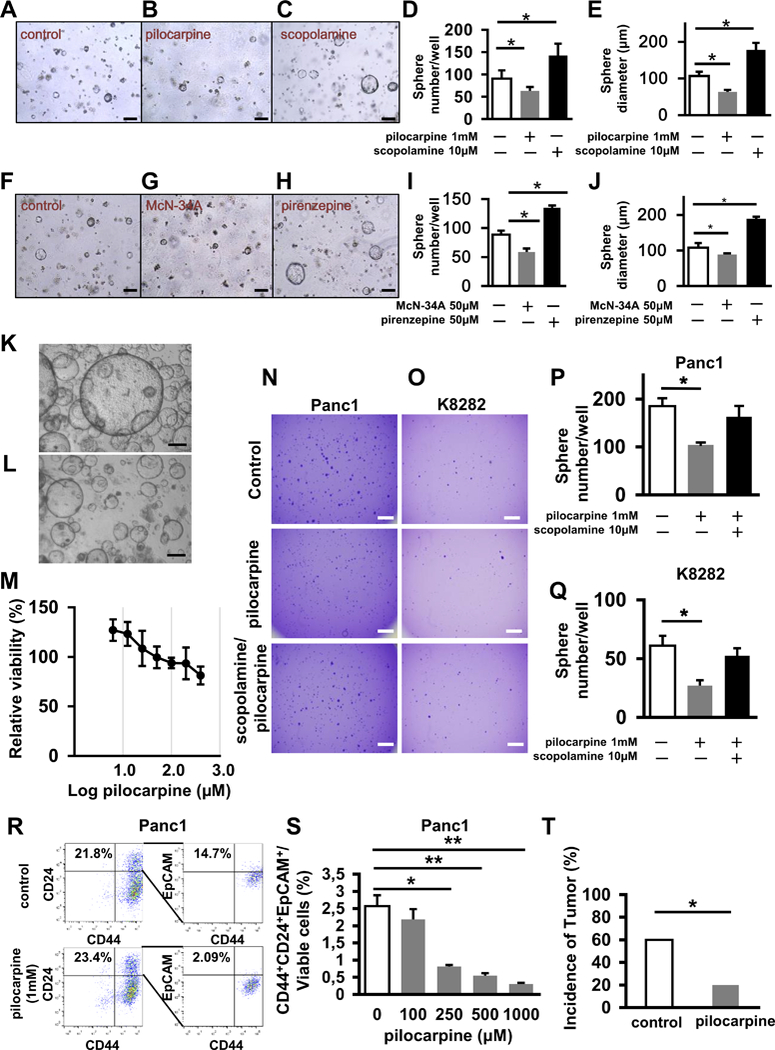
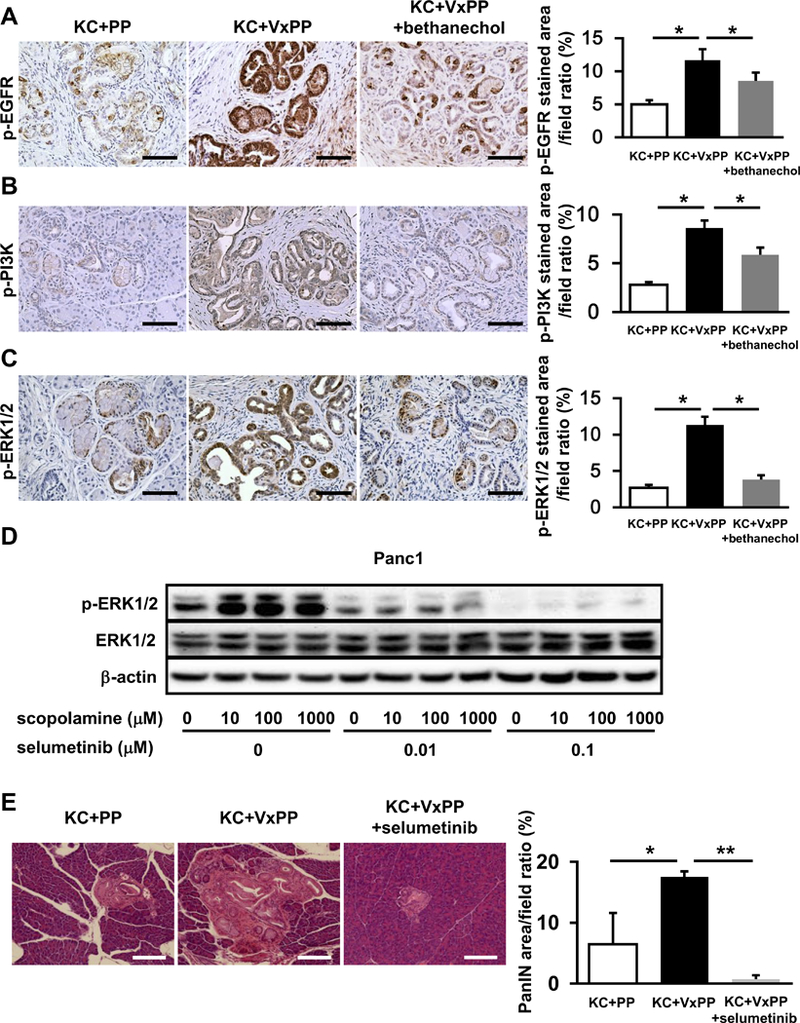
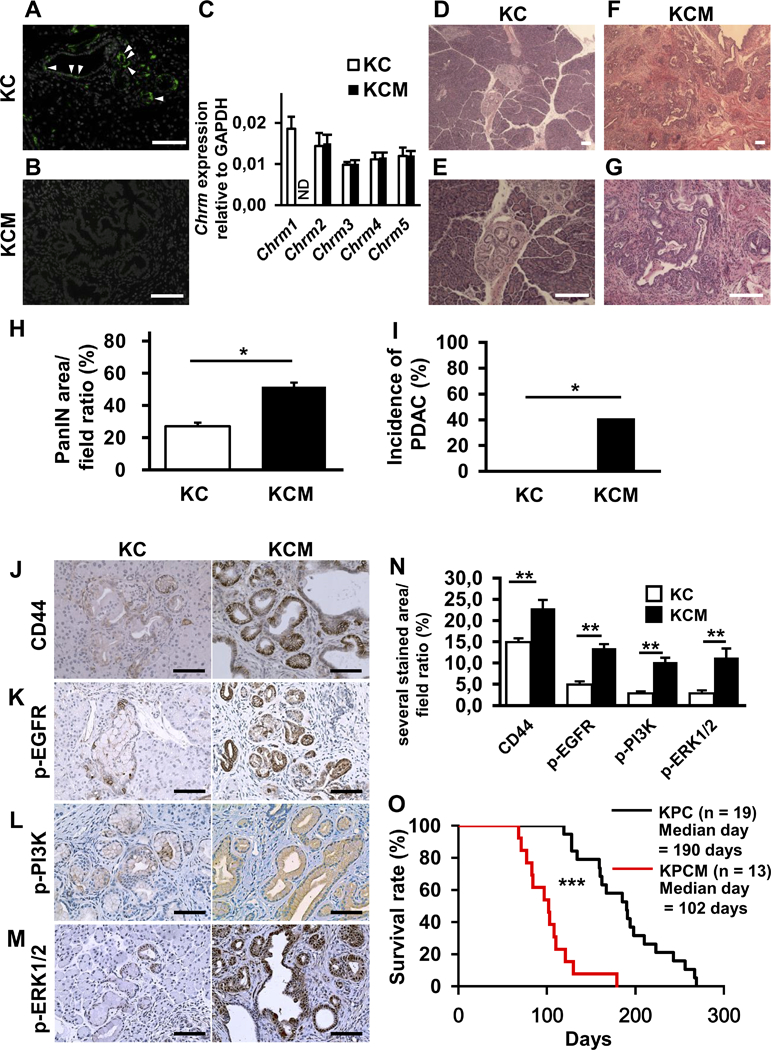
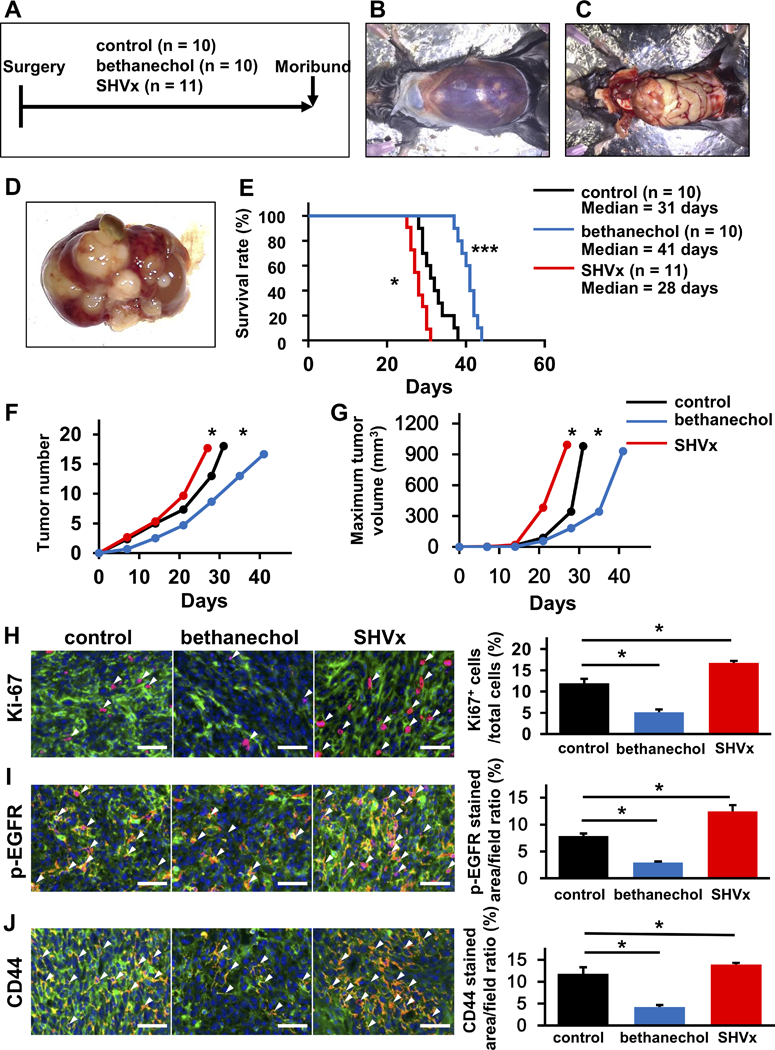
In many solid tumors, parasympathetic input is provided by the vagus nerve, which has been shown to modulate tumor growth. However, whether cholinergic signaling directly regulates progression of pancreatic ductal adenocarcinoma (PDAC) has not been defined. Here, we found that subdiaphragmatic vagotomy in LSL-Kras +/G12D;Pdx1-Cre (KC) mice accelerated PDAC development, whereas treatment with the systemic muscarinic agonist bethanechol restored the normal KC phenotype, thereby suppressing the accelerated tumorigenesis caused by vagotomy. In LSL-Kras +/G12D;LSL-Trp53 +/R172H;Pdx1-Cre mice with established PDAC, bethanechol significantly extended survival. These effects were mediated in part through CHRM1, which inhibited downstream MAPK/EGFR and PI3K/AKT pathways in PDAC cells. Enhanced cholinergic signaling led to a suppression of the cancer stem cell (CSC) compartment, CD11b+ myeloid cells, TNFα levels, and metastatic growth in the liver. Therefore, these data suggest that cholinergic signaling directly and indirectly suppresses growth of PDAC cells, and therapies that stimulate muscarinic receptors may be useful in the treatment of PDAC.Significance: Subdiaphragmatic vagotomy or Chrm1 knockout accelerates pancreatic tumorigenesis, in part via expansion of the CSC compartment. Systemic administration of a muscarinic agonist suppresses tumorigenesis through MAPK and PI3K/AKT signaling, in early stages of tumor growth and in more advanced, metastatic disease. Therefore, CHRM1 may represent a potentially attractive therapeutic target. Cancer Discov; 8(11); 1458-73. ©2018 AACR. This article is highlighted in the In This Issue feature, p. 1333.


Conflict of interest statement

Disclosure: The authors have no conflicts of interest or funding to disclose.

Figures

Figure 1.
Figure 1.. Subdiaphragmatic Vagotomy Promotes Pancreatic Tumorigenesis.
A. Relative quantification of mRNA expression of Chrm1 to Chrm5 in KC+PP mice pancreata compared to KC+VxPP mice pancreata at 20 weeks (n = 3, each group). B. Representative image of CHRM1 immunofluorescent staining (IHC-F) of pancreata from KC+PP at 20 weeks. White arrowheads indicate CHRM1 positive cells in PanIN lesions (CHRM1; green, DAPI; white). C. Representative image of CHRM1 IHC-F of pancreata from KC+VxPP at 20 weeks. White arrowheads indicate CHRM1 positive cells in PanIN lesions. D. Representative image of H&E stained pancreatic section from KC+PP mice at 20 weeks showing low grade PanIN lesions. E. Representative image of H&E stained pancreata from KC+VxPP mice at 20 weeks showing high-grade PanIN / PDAC lesions. F. Percentage of PanIN area in higher power fields in pancreata from KC+VxPP mice (n = 12), KC+PP mice (n = 10) and KC+PP+bethanechol (n = 14) at 20 weeks. G. Percentage of KC+VxPP mice (n = 13) compared to KC+PP mice (n = 10) and KC+PP+bethanechol mice (n = 14) that developed pancreatic cancer at 20 weeks. H. Representative image of H&E stained pancreata from KC+VxPP+bethanechol mice at 20 weeks showing low-grade PanIN lesions. I. Representative images of pancreatic immunohistochemical staining (IHC) for β-Tubulin III in KC+PP and KC+VxPP mice at 20 weeks (n = 4, each group). Bar graph showing quantification of β-Tubulin III stained area in pancreata from KC+PP and KC+VxPP mice. J. Representative images of pancreatic IHC for CD11b in KC+PP, KC+VxPP and KC+VxPP+bethanechol mice at 20 weeks. Bar graph showing quantification of CD11b stained area in pancreata from KC+PP, KC+VxPP and KC+VxPP+bethanechol mice (n = 3, each group). K. Representative images of pancreatic IHC for F4/80 in KC+PP, KC+VxPP and KC+VxPP+bethanechol mice at 20 weeks. Bar graph shows quantification of F4/80 stained area in pancreata from KC+PP, KC+VxPP and KC+VxPP+bethanechol mice (n = 3, each group). *p < 0.05; **p < 0.01. Means ± SD. Scale bars, 100 μm.
Figure 2.
Figure 2.. Muscarinic Stimulation Suppresses Pancreatic Tumorigenesis and Extends Overall Survival in KPC Mice.
A. Experimental setup: KPC mice were enrolled with tumors of 3–5 mm, confirmed by high resolution ultrasound, and treated with gemcitabine (GEM) (100 mg/kg) biweekly (n = 15) or GEM + bethanechol in the drinking water (400 μg/ml) (n = 10) until they became moribund and needed to be sacrificed. B. Kaplan-Meier curve comparing overall survival of KPC mice treated with GEM (n = 15) or GEM+bethanechol (n=10) after initiation of the respective therapy. C. Representative images of H&E stained pancreatic ductal adenocarcinoma (PDAC) from GEM treated KPC mice. D. Representative images of H&E stained PDAC from GEM+bethanechol treated KPC mice. E. Representative images of IHC for CD44 in tumors from KPC mice treated by GEM or GEM+bethanechol. Bar graph showing quantification of the area stained positive for CD44 in PDAC from KPC mice treated with GEM (n = 15) or GEM + bethanechol (n = 10). F. Representative flow cytometric plot of CD44+CD133+ cells in PDAC from KPC mice treated with GEM or GEM + bethanechol. Numbers are showing ratio of CD44+CD133+ cells to viable cells. G. Bar graph shows quantification of CD44+CD133+ cells in PDAC from KPC mice treated with GEM (n = 3) or GEM + bethanechol (n = 4). Scale bars, 100 μm. Means ± SE in Fig. 2E and Means ± SD in Fig. 2G. *p < 0.05; ***p < 0.001.
Figure 3.
Figure 3.. Cholinergic Signaling Directly Promotes Cell Proliferation in Kras Mutant Spheres via CHRM1 and Regulates Cancer Stemness.
A-C. Representative images of pancreatic spheres isolated from LSL-Kras+/G12D mice and treated with an Adeno-Cre virus (A) or an Adeno-Cre virus and pilocarpine (B) or an Adeno-Cre virus and scopolamine (C). D and E. Number of spheres per well (D) and size of spheres (E) isolated from LSL-Kras+/G12D mice and cultured in the presence of an Adeno-Cre virus, which are untreated, treated with pilocarpine, or treated with scopolamine (n = 3, each group). F-H. Representative images of spheres isolated from LSL-Kras+/G12D mice and treated with an Adeno-Cre virus (F) or an Adeno-Cre virus and McN-34A (G) or Adeno-Cre virus and pirenzepine (H). I and J. Number of spheres per well (I) and size of spheres (J) isolated from LSL-Kras+/G12D mice and cultured in the presence of Adeno-Cre virus, which are untreated, treated with McN-34A, or treated with pirenzepine (n = 3, each group). K. Representative image of organoids generated from primary resected human PDAC specimen without treatment L. Representative image of organoids generated from primary resected human PDAC specimen treated with 100 μM of pilocarpine. M. Graph showing dose-dependent decrease in viability of organoids generated from primary resected human PDAC specimen on pilocarpine treatment. N. Representative images of spheres in soft agar from Panc1 cells that are untreated, treated by pilocarpine or treated by scopolamine and pilocarpine at day 14. O. Representative images of spheres in soft agar from K8282 cells that are untreated, treated by pilocarpine or treated by scopolamine and pilocarpine at day 14. P. Bar graph shows quantification of numbers of spheres from Panc1 cells plated in soft agar which are untreated, treated by pilocarpine or treated by scopolamine and pilocarpine at day 14 (n = 3, each group). Q. Bar graph showing quantification of numbers of spheres from K8282 cells plated in soft agar, which are untreated, treated by pilocarpine or treated by scopolamine and pilocarpine at day 14 (n = 3, each group). R. Flow cytometric analysis of CD44+CD24+EpCAM+ cells in Panc1 cells that are untreated, treated with pilocarpine. Numbers are showing the ratio of indicated cells to total cell number on the graphs. S. Bar graph shows quantification of CD44+CD24+EpCAM+ cells in Panc1 cells treated with different dosages of pilocarpine (n = 3). T. Percentage of NOD/SCID mice developing tumors 6 weeks after injection of 25,000 injected Panc1 cells with and without pretreatment with pilocarpine (n = 10, each group). Scale bars, 100 μm in Fig A-C and F-H, 500 μm in Fig K, L, N and O. Means ± SD in Fig D, E, I, J, M and T, Means ± SEM in Fig P, Q and S. *p < 0.05; **p < 0.01.
Figure 4.
Figure 4.. Muscarinic Signaling Inhibits Downstream EGFR/MAPK and PI3K/AKT Signaling in PDAC Cells.
A-C. Representative images IHC for p-EGFR (A), p-PI3K (B), and p-ERK1/2 (C) in pancreatic sections from KC + PP mice, KC + VxPP mice, and KC + VxPP + bethanechol mice. Bar graphs show quantification of p-EGFR, p-PI3K or p-ERK1/2 staining in pancreata from KC + PP mice, KC + VxPP mice, and KC + VxPP + bethanechol mice (n = 3, each group). D. Representative western blot showing p-ERK1/2 and ERK1/2 relative to β-actin in Panc1 cells after treatment with indicated dosages of scopolamine and selumetinib. E. Representative H&E stained images of pancreatic sections from KC + PP mice, KC + VxPP mice, and KC + VxPP + selumetinib mice. Bar graph shows quantification of PanIN area in pancreata from KC + PP mice, KC + VxPP mice, and KC + VxPP + selumetinib mice (n = 3, each group). Scale bars, 100 μm, Means ± SD. *p < 0.05; **p < 0.01.
Figure 5.
Figure 5.. Knockout of CHRM1 Results in Larger PanIN Area and Tumor Incidence in KC Mice and Shorter Overall Survival in KPC Mice.
A and B. Representative images of CHRM1 immunofluorescence in pancreatic sections from KC (A) and KCM (B) mice at 20 weeks (CHRM1; green, DAPI; white). C. Relative quantification of mRNA expression of Chrm1–5 in KC compared to KCM mice at 20 weeks (n = 3, each group). D and E. Representative images of H&E stained pancreatic sections from KC mice at 20 weeks showing low-grade PanIN lesions in low (D) and high (E) power magnification. F and G. Representative images of H&E stained pancreatic sections from KCM mice at 20 weeks showing high-grade PanIN lesions/PDAC in low (F) and high (G) power magnification. H. Quantification of PanIN area in pancreatic sections from KC and KCM mice at 20 weeks (n = 5, each group) I. Percentage of KC and KCM mice with PDAC development at 20 weeks (n = 10, each group). J-M. Representative images of pancreatic IHC for CD44 (J), p-EGFR (K), p-PI3K (L), and p-ERK1/2 (M) in KC and KCM mice at 20 weeks. N. Bar graph shows quantification of CD44, p-EGFR, p-PI3K, and p-ERK staining in pancreata from KC and KCM mice at 20 weeks (n = 3, each group). O. Kaplan-Meier curve comparing overall survival of KPC (n = 19) and KPCM mice (n = 13). Scale bars, 100 μm, Means ± SD. *p < 0.05; **p < 0.01, ***p < 0.001.
Figure 6.
Figure 6.. Parasympathetic Signaling Influences Survival in a Model of Hepatic Metastasis.
A. Experimental setup for the studies depicted in A-J. Wild-type C57BL/6 mice received splenic injections of 2×10⁶ GFP-labelled Panc02 cells and were then divided into 3 groups: untreated controls (n = 10), bethanechol-treated (n = 10), and selective hepatic vagotomy by transection of the hepatic branch of the vagus nerve (SHVx) (n =11). Mice were observed until they became moribund and needed to be sacrificed. B. Representative images at the time of necropsy. Mouse shows massive bloody ascites. C and D. Representative images showing cancer cells replacing the normal liver tissue as large pale nodules. E. Kaplan-Meier curve comparing overall survival after splenic injection of GFP-labeled Panc02 cells in control mice (black), mice with SHVx (red) or mice treated with bethanechol (blue). F. Tumor number at necropsy in mice that received SHVx (red) and bethanechol (blue), compared to untreated control (black). G. Tumor volume in mice that received SHVx (red) and bethanechol (blue) compared to untreated control (black). H-J. Representative images of immunofluorescent staining of liver metastases from untreated control, bethanechol-treated and SHVx mice for Ki-67 (Ki-67; red) (H), p-EGFR (p-EGFR; red) (I), and CD44 (CD44; red) (J). GFP; green, DAPI; blue, white arrowheads indicate red-positive cells). Bar Graphs show quantitative analysis of positive cells for each staining in untreated control, bethanechol-treated, and SHVx mice (n = 3, each group). Scale bars, 100 μm. Means ± SD. *p < 0.05; *** p < 0.001.

References

    1. Siegel RL, Miller KD, Jemal A. Cancer statistics, 2018. CA: A Cancer Journal for Clinicians. 3rd ed. 2018;97:3133–24. - PubMed
    1. Werner J, Combs SE, Springfeld C, Hartwig W, Hackert T, Büchler MW. Advanced-stage pancreatic cancer: therapy options. Nat Rev Clin Oncol. 2013;10:323–33. - PubMed
    1. Neoptolemos JP, Kleeff J, Michl P, Costello E, Greenhalf W, Palmer DH. Therapeutic developments in pancreatic cancer: current and future perspectives. Nat Rev Gastroenterol Hepatol. 2018;15:333–48. - PubMed
    1. Olive KP, Jacobetz MA, Davidson CJ, Gopinathan A, McIntyre D, Honess D, et al. Inhibition of Hedgehog Signaling Enhances Delivery of Chemotherapy in a Mouse Model of Pancreatic Cancer. Science [Internet]. AAAS; 2009;324:1457–61. Available from: http://stke.sciencemag.org/cgi/content/full/sci;324/5933/1457 - PMC - PubMed
    1. Demir IE, Friess H, Ceyhan GO. Neural plasticity in pancreatitis and pancreatic cancer. Nat Rev Gastroenterol Hepatol. 2015;12:649–59. - PubMed

Publication types

MeSH terms