. 2018 Sep 6;3(17):e121225.
doi: 10.1172/jci.insight.121225.

Calpain-6 controls the fate of sarcoma stem cells by promoting autophagy and preventing senescence

Affiliations

Calpain-6 controls the fate of sarcoma stem cells by promoting autophagy and preventing senescence

Caroline Andrique et al. JCI Insight. .

Abstract

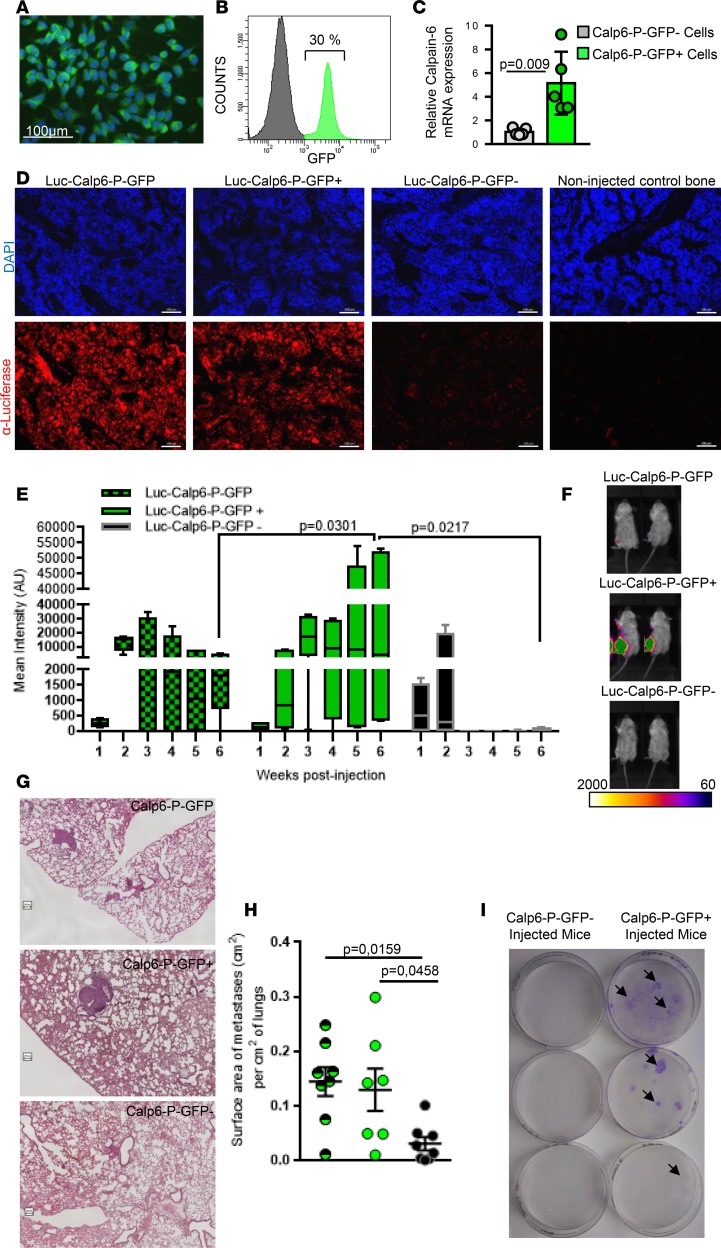
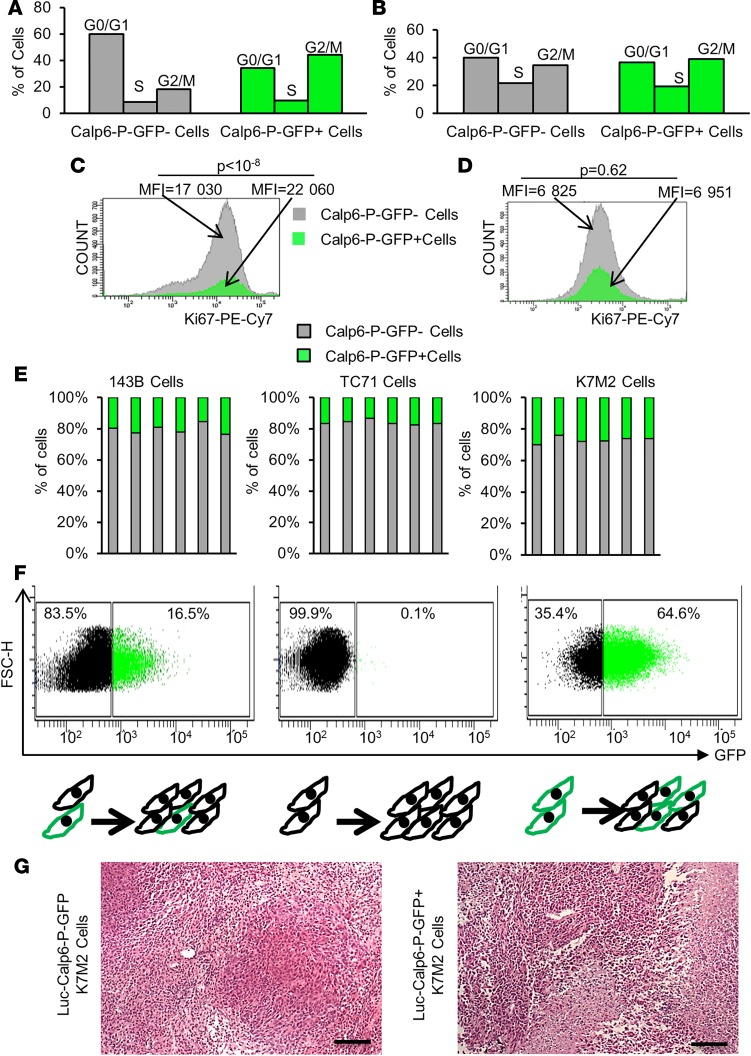
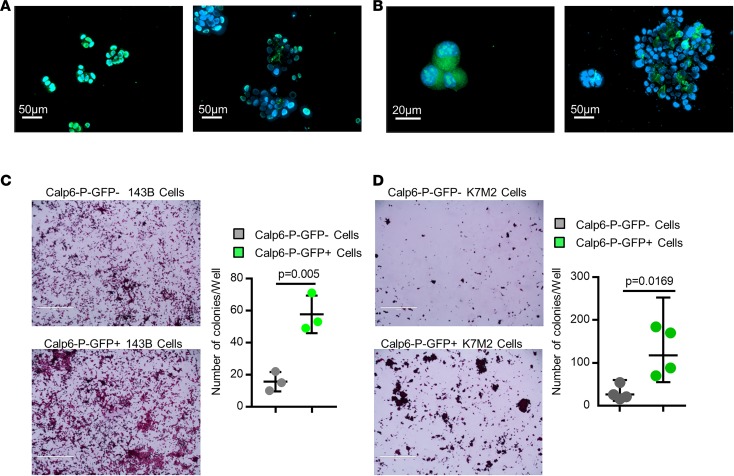
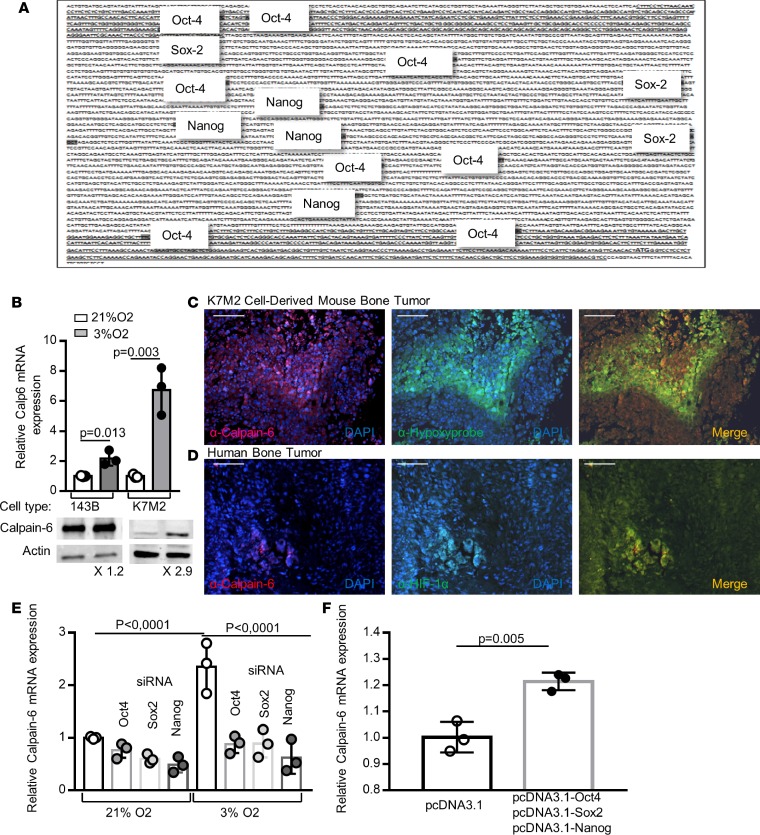
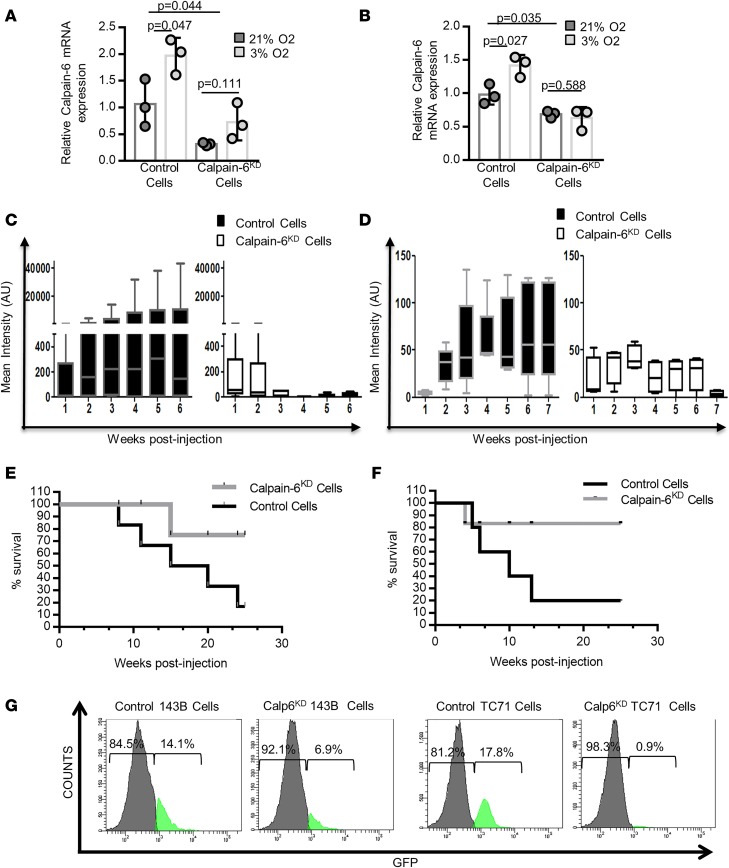
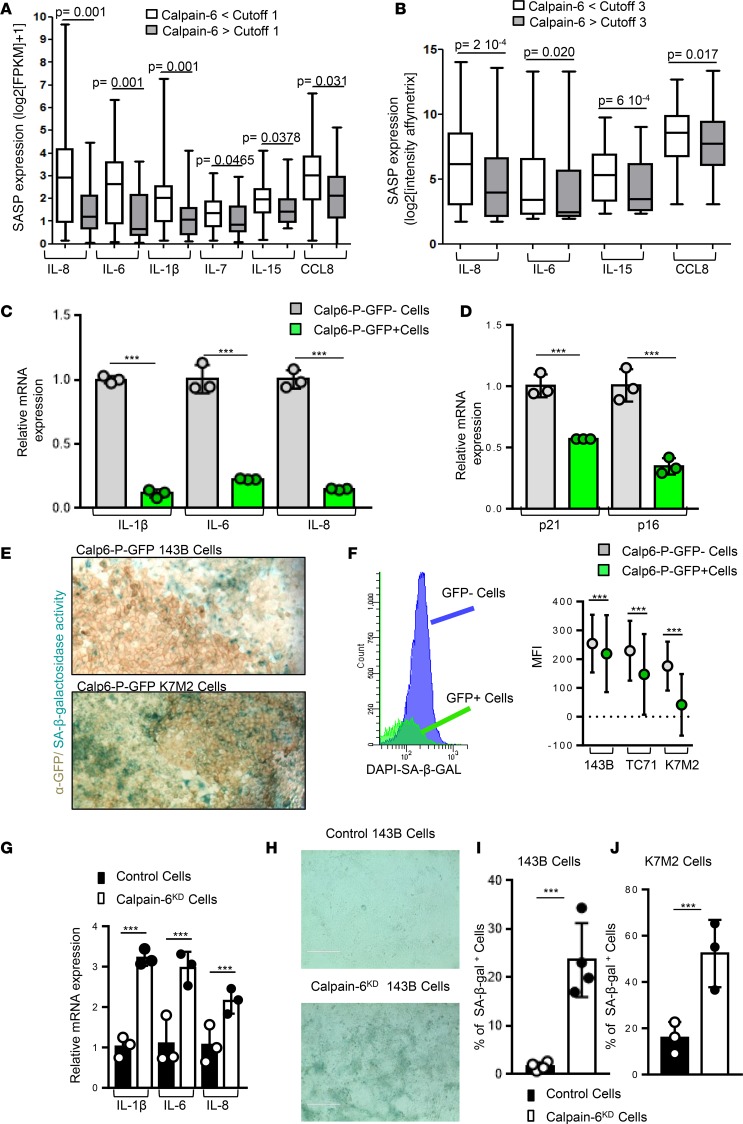
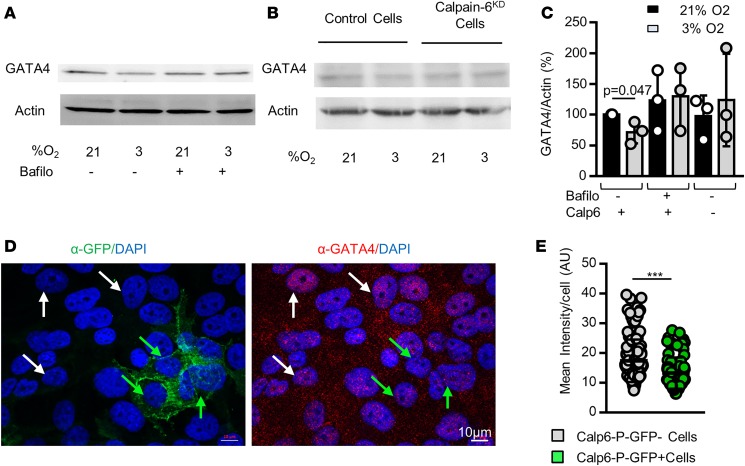
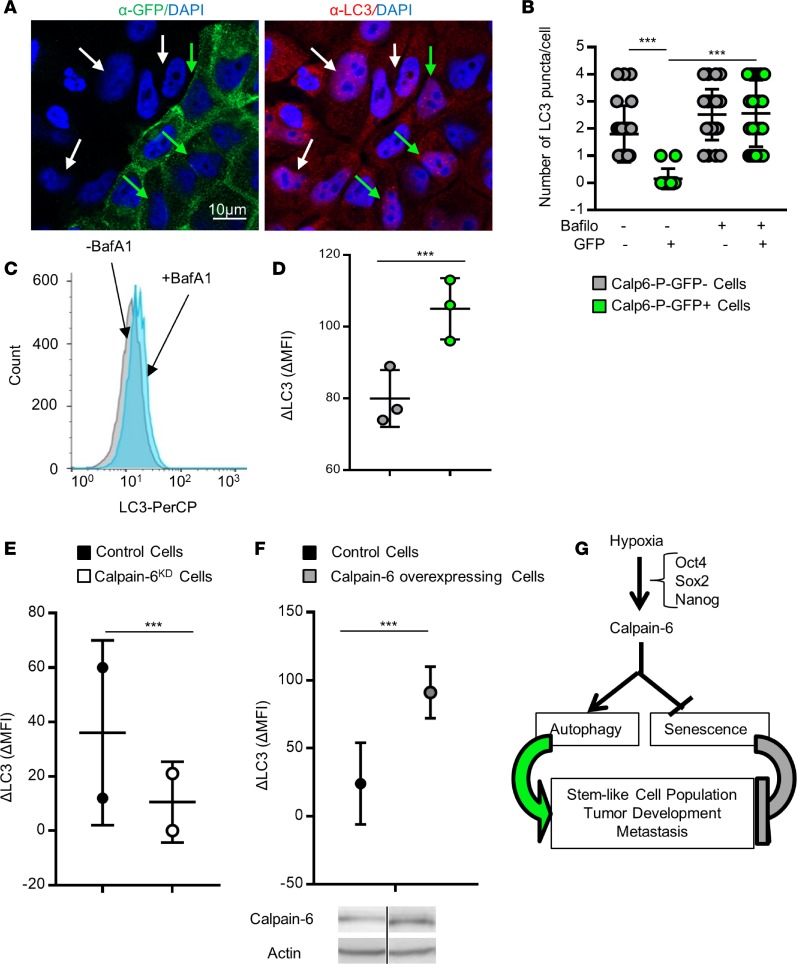
Sarcomas are still unsolved therapeutic challenges. Cancer stem cells are believed to contribute to sarcoma development, but lack of specific markers prevents their characterization and targeting. Here, we show that calpain-6 expression is associated with cancer stem cell features. In mouse models of bone sarcoma, calpain-6-expressing cells have unique tumor-initiating and metastatic capacities. Calpain-6 levels are especially high in tumors that have been successfully propagated in mouse to establish patient-derived xenografts. We found that calpain-6 levels are increased by hypoxia in vitro and calpain-6 is detected within hypoxic areas in tumors. Furthermore, calpain-6 expression depends on the stem cell transcription network that involves Oct4, Nanog, and Sox2 and is activated by hypoxia. Calpain-6 knockdown blocks tumor development in mouse and induces depletion of the cancer stem cell population. Data from transcriptomic analyses reveal that calpain-6 expression in sarcomas inversely correlates with senescence markers. Calpain-6 knockdown suppresses hypoxia-dependent prevention of senescence entry and also promotion of autophagic flux. Together, our results demonstrate that calpain-6 identifies sarcoma cells with stem-like properties and is a mediator of hypoxia to prevent senescence, promote autophagy, and maintain the tumor-initiating cell population. These findings open what we believe is a novel therapeutic avenue for targeting sarcoma stem cells.

Keywords: Autophagy; Cellular senescence; Oncogenes; Oncology.


Conflict of interest statement

Conflict of interest: The authors have declared that no conflict of interest exists.

Figures

Figure 1
Figure 1. Calpain-6–expressing cells are tumor-initiating cells.
(A) Fluorescence microscopy of Calp6-P-GFP K7M2 cells. (B) Flow cytometry of GFP in Calp6-P-GFP K7M2 cells. (C) RT-qPCR analysis of calpain-6 mRNA expression in sorted Calp6-P-GFP and -GFP+ K7M2 cells. Data are the mean ± SD from 3 independent RNA extracts compared by 2-tailed Student’s t test. (D) Immunofluorescence of luciferase-expressing cells (tumor cells) in sections of bone injected with unsorted Luc-Calp6-P-GFP or sorted Luc-Calp6-P-GFP+ or -GFP K7M2 cells. The bones were collected at 6 weeks after implantation. Bone tissues from noninjected mice served as control. Scale bars: 100 μm. (E) Quantification of bioluminescent signals in tibias of Luc-Calp6-P-GFP K7M2–implanted mice during tumor growth. n = 6 mice/group. Data are medians, box edges are the interquartile range, and whiskers are the range. Outliers were identified by Grubbs’ test (α = 0.05). Data were compared by 2-way ANOVA. (F) Typical images of the bioluminescent signals in tibias of K7M2-implanted mice. (G) Representative H&E-stained lung sections from mice implanted for 6 weeks with unsorted Calp6-P-GFP or sorted Calp6-P-GFP or -GFP+ K7M2 cells. Scale bars: 100 μm. (H) Metastasis area. n = 7 mice (unsorted Calp6-P-GFP K7M2 cells), n = 7–8 mice (sorted Calp6-P-GFP or -GFP+ K7M2 cells). Data are the mean ± SD compared by 1-way ANOVA. (I) Crystal violet staining of K7M2 cells in lung cell cultures. Each well was seeded with lung cells from a K7M2 bone–implanted mouse. Arrows indicate cell clones.
Figure 2
Figure 2. Calpain-6–expressing cells are at the top of the cellular hierarchy.
(A and B) Analysis of cell cycle in Calp6-P-GFP and -GFP+ 143B cells (A) and K7M2 cells (B). (C and D) Flow cytometry of the proliferation marker Ki67 in 143B cells (C) and K7M2 cells (D). Data are mean fluorescence intensity compared by 2-tailed Student’s t test (50,000 cells were analyzed). (E) The proportion of Calp6-P-GFP+ cells analyzed by flow cytometry in confluent cells at multiple passages in different cell lines. (F) Flow cytometry of Calp6-P-GFP–/+ cells 5 days after seeding of unsorted, sorted Calp6-P-GFP, or sorted Calp6-P-GFP+ 143B cells. (G) H&E staining of K7M2 and Calp6-P-GFP+ K7M2 cell–derived tumors. Scale bars: 100 μm.
Figure 3
Figure 3. Calpain-6 expression is associated with stem cell features.
(A and B) Fluorescence microscopy of GFP in little spheres (left panel) and large spheres (right panel) of 143B cells (A) and K7M2 cells (B). (C and D) Stem-cell colony-formation assays with 143B cells (C) and K7M2 cells (D). Data are the mean ± SD from 3 independent cultures of 143B cells and 4 independent cultures of K7M2 cells compared by 2-tailed Student’s t test. Scale bars: 1,000 μm.
Figure 4
Figure 4. Oct4, Sox2, and Nanog mediate calpain-6 upregulation by hypoxia.
(A) Regulatory sequence in the 5′ region upstream of the ATG in CAPN6. Consensus sites for Nanog, Oct4, and Sox2 are indicated. Shaded text indicates putative promoters. (B) RT-qPCR and Western blot analysis of calpain-6 in 143B and K7M2 cells cultured in 21% or 3% O2. Data are the mean ± SD of 3 extracts from different cultures compared by 2-tailed Student’s t test. (C) Representative immunofluorescence of calpain-6 and hypoxyprobe in sections of K7M2 cell–derived bone tumor. (D) Representative immunofluorescence of calpain-6 and HIF-1α in sections of human osteosarcoma. Scale bars (C and D): 1,000 μm. (E) RT-qPCR analysis of calpain-6 mRNA expression in 143B cells transfected with control, Oct-4, Sox2, or Nanog siRNA in 143B cells cultured in 21% or 3% O2. Data are the mean ± SD of 3 extracts from different cultures compared by 1-way ANOVA. (F) RT-qPCR analysis of calpain-6 mRNA expression in 143B cells transfected with empty vector or Oct-4, Sox2, and Nanog coding vector. Data are the mean ± SD of 3 extracts from different cultures compared by 2-tailed Student’s t test.
Figure 5
Figure 5. Calpain-6 knockdown inhibits tumorigenesis.
(A and B) RT-qPCR of calpain-6 in control and calpain-6KD K7M2 (A) and 143B (B) cells cultured in 21% or 3% O2. Results are the mean ΔΔCT ± SD of 3 extracts from different cultures compared by 1-way ANOVA. (C and D) Mean bioluminescence intensity in control and calpain-6KD K7M2 cell–implanted (C) and control and calpain-6KD 143B cell–implanted (D) mice. n = 6 mice/group for K7M2 cell–implanted and n = 5 mice/group for 143B cell–implanted mice. Data are medians, box edges are the interquartile range, and whiskers are the range. Outliers were identified by Grubbs’ test (α = 0.05). Data were compared by multiple t test corrected by the 2-stage step-up method of Benjamini, Krieger, and Yekutieli. (E and F) Kaplan-Meier survival curves for mice implanted with K7M2 (E) and 143B (F) cells. (G) Flow cytometry of Calp-6-GFP+ cells in calpain-6KD 143B and TC71 cell populations (50,000 cells were analyzed).
Figure 6
Figure 6. Calpain-6 expression is associated with reduced senescence markers.
(A and B) Senescence-associated secretory phenotype (SASP) gene expression in tumors with and without calpain-6 expression from transcriptomic analysis of soft-tissue sarcomas. (A) RNA sequencing. Cutoff = 1 for calpain-6 expression. n = 71 tumors for calpain-6 <1, n = 24 tumors for calpain-6 >1. (B) Affymetrix RNA microarray. Cutoff = 3 for calpain-6 expression. n = 239 tumors for calpain-6 <3, n = 100 tumors for calpain-6 >3. Data are medians, box edges are the interquartile range, and whiskers are the range. P values are from 2-tailed Mann-Whitney U test. (C and D) RT-qPCR analyses of mRNA levels of senescence markers in sorted Calp6-P-GFP and GFP+ human sarcoma 143B cells (C) and mouse K7M2 cells (D). Data are the mean ± SD of 3 independent cell extracts evaluated by 2-sided Student’s t test. (E) Detection of senescence-associated β-galactosidase (SA-β-Gal) activity in Calp6-P-GFP and -GFP+ 143B and K7M2 cells. Membrane GFP was revealed by immunohistochemistry. (F) Flow cytometry of SA-β-Gal activity in Calp6-P-GFP and -GFP+ 143B, TC71, and K7M2 cells and quantification. Data are the mean ± SD from n = 34,980 (143B), 35,150 (TC71), and 33,282 (K7M2) GFP cells; n = 9,630 (143B), 7,243 (TC71), and 13 390 (K7M2) GFP+ cells compared by 2-tailed Student’s t test. (G) RT-qPCR analyses of mRNA levels of SASP genes in control and calpain-6KD 143B cells. Data are the mean ± SD of 3 independent cell extracts evaluated by 2-tailed Student’s t test. (H) Representative images of SA-β-Gal+ cells in confluent control and calpain-6KD 143B cells. Scale bars: 400 μm. (I and J) Quantification of SA-β-Gal+ cells in control and calpain-6KD 143B cells (I) and K7M2 cells (J). Data are the mean ± SD of 3 cultures evaluated by 2-tailed Student’s t test. ***P < 0.001.
Figure 7
Figure 7. Calpain-6 mediates the hypoxia-dependent prevention of senescence entry.
(A) Western blot analysis of GATA4 in 143B cells in the absence or presence of bafilomycin A1. (B) Western blot analysis of GATA4 in control and calpain-6KD 143B cells. (C) Quantification of the Western blots. Data are the mean ± SD from 3 independent blots. Actin was used as a loading control. (D) Representative immunofluorescence images of GFP and GATA4 in Calp6-P-GFP 143B cells. White and green arrows indicate GFP and GFP+ cells, respectively. (E) Quantification of GATA4 labeling. Data are the mean ± SD compared by 2-tailed Student’s t test. ***P < 0.001.
Figure 8
Figure 8. Calpain-6 controls autophagy in sarcoma stem cells.
(A) Representative immunofluorescence of GFP and LC3 in Calp6-P-GFP 143B cells. White and green arrows indicate GFP and GFP+ cells, respectively. (B) Quantification of LC3 puncta in 143B cells. Data are the mean ± SD evaluated by 1-way ANOVA. (C) Flow cytometry of LC3 in 143B cells. (D) Quantification of LC3 accumulation in the presence of bafilomycin (ΔLC3). n = 25,000 GFP cells and 3,800 GFP+ cells. (E) ΔLC3 quantification in control and calpain-6KD 143B cells. n = 50,000 cells. (F) ΔLC3 quantification in control and calpain-6–overexpressing cells. n = 50,000 cells. Data are the mean ± SD compared by 2-tailed Student’s t test. Calpain-6 overexpression was checked by Western blot. (G) Schematic representation of calpain-6 contribution to CSC maintenance in hypoxic condition. ***P < 0.001.

References

    1. Doyle LA. Sarcoma classification: an update based on the 2013 World Health Organization Classification of Tumors of Soft Tissue and Bone. Cancer. 2014;120(12):1763–1774. doi: 10.1002/cncr.28657. - DOI - PubMed
    1. Allemani C, et al. Global surveillance of cancer survival 1995-2009: analysis of individual data for 25,676,887 patients from 279 population-based registries in 67 countries (CONCORD-2) Lancet. 2015;385(9972):977–1010. doi: 10.1016/S0140-6736(14)62038-9. - DOI - PMC - PubMed
    1. Eide CA, Druker BJ. Understanding cancer from the stem cells up. Nat Med. 2017;23(6):656–657. doi: 10.1038/nm.4353. - DOI - PubMed
    1. Valent P, et al. Cancer stem cell definitions and terminology: the devil is in the details. Nat Rev Cancer. 2012;12(11):767–775. doi: 10.1038/nrc3368. - DOI - PubMed
    1. Zaidi SK, et al. Bivalent Epigenetic Control of Oncofetal Gene Expression in Cancer. Mol Cell Biol. 2017;37(23):e00352–17. - PMC - PubMed

Publication types

MeSH terms