. 2018 Sep 6;3(17):e122011.
doi: 10.1172/jci.insight.122011.

Polygenic risk score for predicting weight loss after bariatric surgery

Affiliations

Polygenic risk score for predicting weight loss after bariatric surgery

Juan de Toro-Martín et al. JCI Insight. .

Abstract

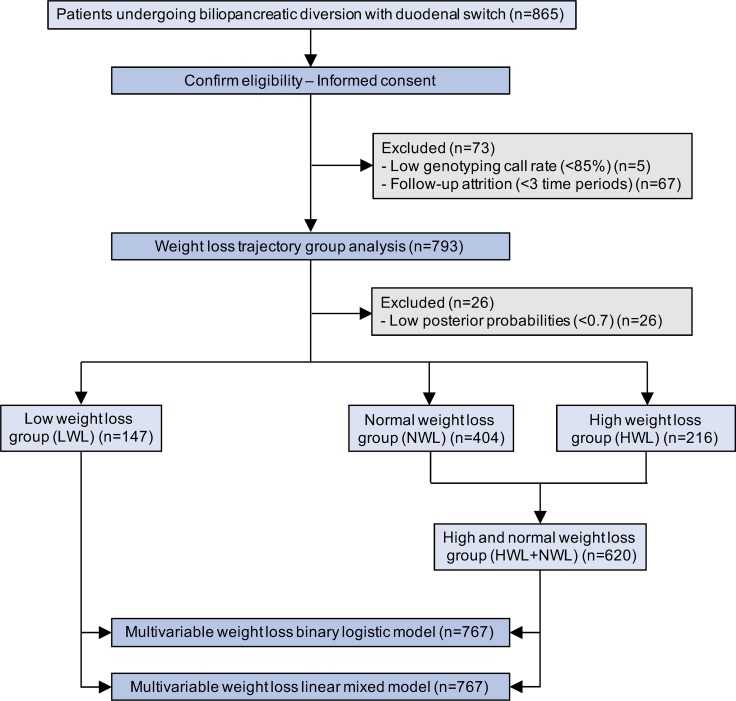
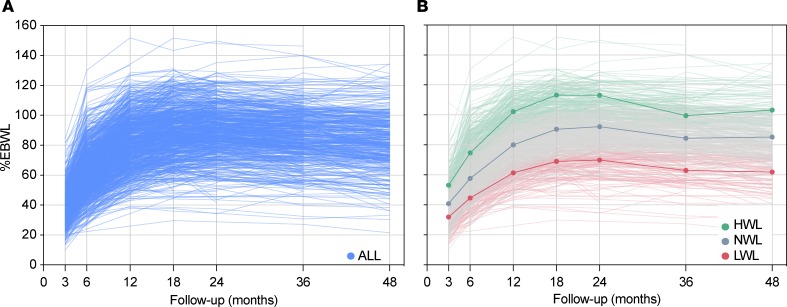
Background: The extent of weight loss among patients undergoing bariatric surgery is highly variable. Herein, we tested the contribution of genetic background to such interindividual variability after biliopancreatic diversion with duodenal switch.

Methods: Percentage of excess body weight loss (%EBWL) was monitored in 865 patients over a period of 48 months after bariatric surgery, and two polygenic risk scores were constructed with 186 and 11 (PRS186 and PRS11) single nucleotide polymorphisms previously associated with body mass index (BMI).

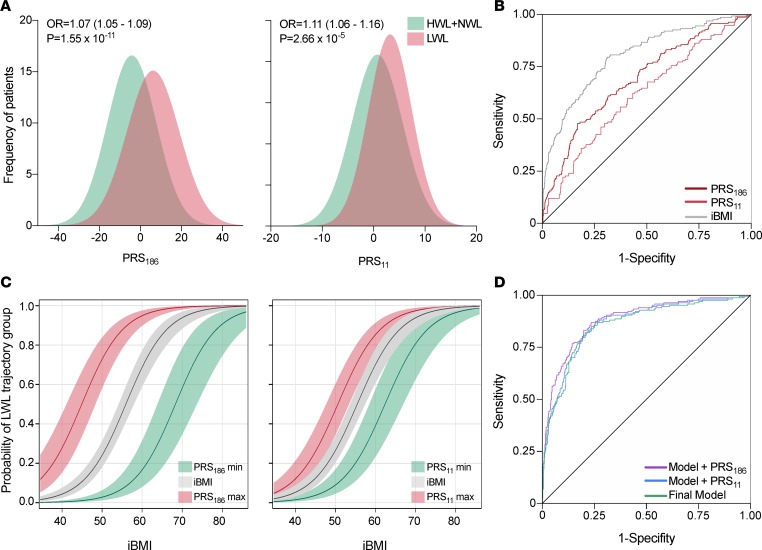
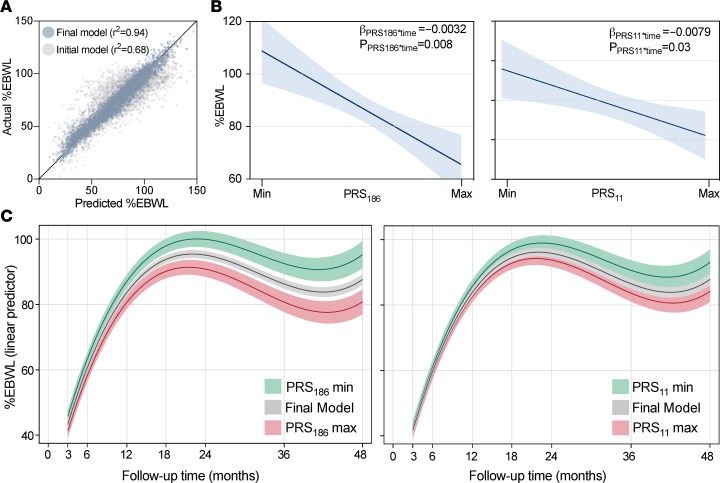
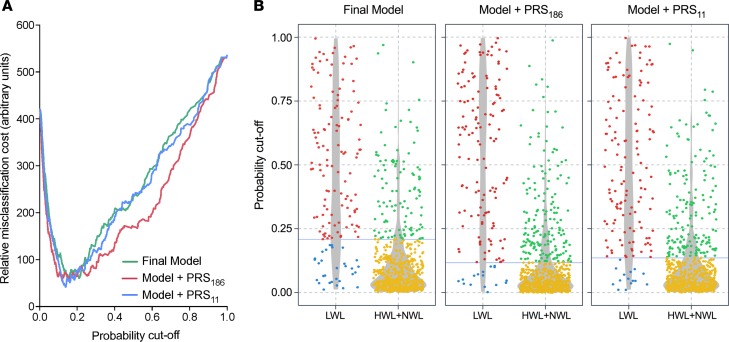
Results: The accuracy of the %EBWL logistic prediction model - including initial BMI, age, sex, and surgery modality, and assessed as the area under the receiver operating characteristics (ROC) curve adjusted for optimism (AUCadj = 0.867) - significantly increased after the inclusion of PRS186 (ΔAUCadj = 0.021; 95% CI of the difference [95% CIdiff] = 0.005-0.038) but not PRS11 (ΔAUCadj= 0.008; 95% CIdiff= -0.003-0.019). The overall fit of the longitudinal linear mixed model for %EBWL showed a significant increase after addition of PRS186 (-2 log-likelihood = 12.3; P = 0.002) and PRS11 (-2 log-likelihood = 9.9; P = 0.007). A significant interaction with postsurgery time was found for PRS186 (β = -0.003; P = 0.008) and PRS11 (β = -0.008; P = 0.03). The inclusion of PRS186 and PRS11 in the model improved the cost-effectiveness of bariatric surgery by reducing the percentage of false negatives from 20.4% to 10.9% and 10.2%, respectively.

Conclusion: These results revealed that genetic background has a significant impact on weight loss after biliopancreatic diversion with duodenal switch. Likewise, the improvement in weight loss prediction after addition of polygenic risk scores is cost-effective, suggesting that genetic testing could potentially be used in the presurgical assessment of patients with severe obesity.

Funding: Heart and Stroke Foundation of Canada (G-17-0016627) and Canada Research Chair in Genomics Applied to Nutrition and Metabolic Health (no. 950-231-580).

Keywords: Genetics; Obesity; Surgery.


Conflict of interest statement

Conflict of interest: André Tchernof receives research funding from Johnson & Johnson Medical companies, Pfizer, and Medtronic for studies on bariatric surgery.

Figures

Figure 1
Figure 1. Flow diagram of study participants.
Figure 2
Figure 2. Postsurgery weight loss trajectory analysis.
(A) Spaghetti plot showing the percentage of excess body weight loss (%EBWL) of the 767 bariatric patients studied (ALL) over the first 4 years postsurgery (6, 12, 18, 24, 36, and 48 months). (B) Trajectory groups of %EBWL estimated by latent class growth analysis. Weight loss data from the follow-up period of 48 months were used to create groups depending on %EBWL. The 3 resulting trajectory groups were high weight loss (HWL; green lines), representing 28.2% of subjects; normal weight-loss (NWL, gray lines), composed of 52.7% of subjects; and low weight-loss (LWL, red lines), which encompassed 19.2% of subjects.
Figure 3
Figure 3. Effect of polygenic risk scores on weight loss trajectory groups.
(A) Histograms displaying the different distribution of polygenic risk scores PRS186 and PRS11 in patients assigned to LWL or HWL+NWL trajectory groups. As shown, increasing values of PRS186 and PRS11 are significantly associated with a greater probability of being in the LWL group. Odds ratios (OR) and P values are for the linear trend test in the multivariable binary logistic model. HWL, NWL, and HWL: high-, normal-, and low-weight-loss trajectory groups. (B) Graphical representation of the area under the ROC curve (AUC) for PRS186 and PRS11. The AUC for initial BMI (iBMI) is also shown. (C) Impact of maximum (red lines) and minimum (green lines) values of PRS186 and PRS11 on the probability of being in the LWL group as a function of iBMI (gray lines). Gray, red, and green shaded areas represent 95% confidence intervals. (D) The AUC of the final logistic prediction models, including all the demographic and clinical predictors before (Final Model: sex, age, type of surgery, and iBMI) and after the inclusion of polygenic risk scores (Model + PRS186 and Model + PRS11) are shown.
Figure 4
Figure 4. Effect of polygenic risk scores on weight loss evolution over time.
(A) Predicted versus actual longitudinal percentage of excess body weight loss (%EBWL) according to an initial model considering only fixed effects (postsurgery cubic time, age, sex, initial BMI, and surgery modality) and the final multivariable linear mixed model considering fixed and random effects (intercept and postsurgery cubic time terms). (B) Graphical representation of the quantitative impact of the extreme values (Min and Max) of polygenic risk scores PRS186 and PRS11 on %EBWL at the end of the follow-up period (48 months). Estimates are calculated for the standard patient, defined as a 42-year-old woman with a mean initial BMI of 50 undergoing laparoscopic surgery. β Estimates and P values of time interaction are shown. Blue shaded areas are 95% confidence intervals. (C) Gray lines show the linear predictor of %EBWL inferred from the final model (fixed effects: postsurgery cubic time, age, sex, initial BMI, and surgery modality; random effects: intercept and postsurgery cubic time terms). Green and red lines show the linear predictor of %EBWL estimated for the maximum and minimum PRS186 and PRS11 values. Gray, red, and green shaded areas are 95% CIs.
Figure 5
Figure 5. Cost-effectiveness analysis of polygenic risk scores.
(A) Cost curves of the final logistic prediction model including all the demographic and clinical predictors (Final Model: sex, age, type of surgery, and initial BMI), Model + PRS186, and Model + PRS11 are shown. Minimal misclassification cost was obtained by estimating a false negative (FN) decision (actual LWL patients assigned to HWL+NWL group) to be 5 times as costly as a false positive (FP) decision (actual HWL+NWL assigned to LWL group). (B) Confusion matrix of each model showing the different distribution of correctly (true positives, TP, and true negatives, TN) and incorrectly (FN and FP) assigned observations. Blue lines indicate the probability cutoff with minimal misclassification cost for each model (final model = 0.21, model + PRS186 = 0.12, and model + PRS11 = 0.14). Red and blue points represent TN and FN; green and yellow points, TP and FP, respectively. Gray shaded areas are violin plots representing the density of observations across probability cutoffs. HWL, NWL, and LWL: high-, normal-, and low-weight-loss groups.

References

    1. Terranova L, Busetto L, Vestri A, Zappa MA. Bariatric surgery: cost-effectiveness and budget impact. Obes Surg. 2012;22(4):646–653. doi: 10.1007/s11695-012-0608-1. - DOI - PubMed
    1. Courcoulas AP, et al. Seven-year weight trajectories and health outcomes in the Longitudinal Assessment of Bariatric Surgery (LABS) study. JAMA Surg. 2018;153(5):427–434. doi: 10.1001/jamasurg.2017.5025. - DOI - PMC - PubMed
    1. Wood GC, et al. Evaluation of the association between preoperative clinical factors and long-term weight loss after Roux-en-Y gastric bypass. JAMA Surg. 2016;151(11):1056–1062. doi: 10.1001/jamasurg.2016.2334. - DOI - PubMed
    1. Rojo-Tirado MA, Benito PJ, Atienza D, Rincón E, Calderón FJ. Effects of age, sex, and treatment on weight-loss dynamics in overweight people. Appl Physiol Nutr Metab. 2013;38(9):967–976. doi: 10.1139/apnm-2012-0441. - DOI - PubMed
    1. Dallal RM, Quebbemann BB, Hunt LH, Braitman LE. Analysis of weight loss after bariatric surgery using mixed-effects linear modeling. Obes Surg. 2009;19(6):732–737. doi: 10.1007/s11695-009-9816-8. - DOI - PubMed

Publication types