. 2018 Sep 6;3(17):e122490.
doi: 10.1172/jci.insight.122490.

MEG3 is increased in idiopathic pulmonary fibrosis and regulates epithelial cell differentiation

Affiliations

MEG3 is increased in idiopathic pulmonary fibrosis and regulates epithelial cell differentiation

Jason J Gokey et al. JCI Insight. .

Abstract

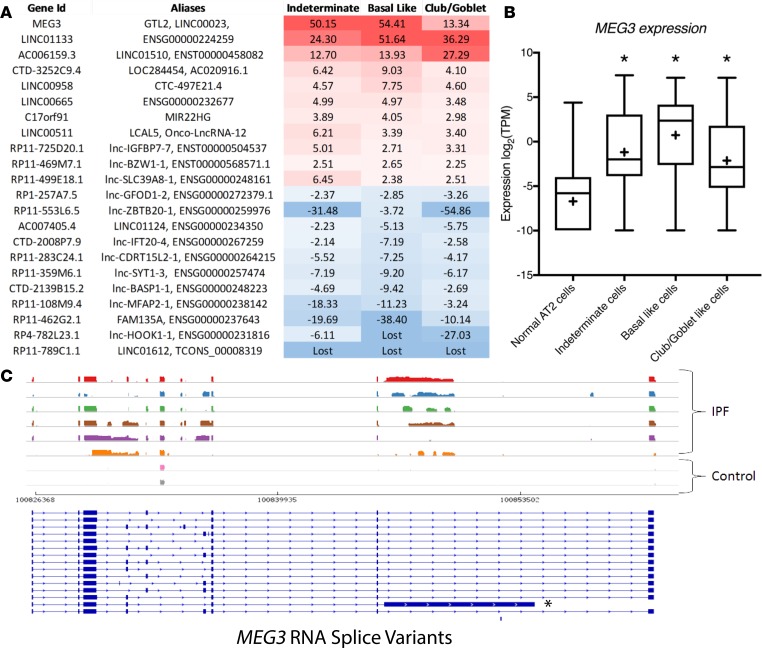
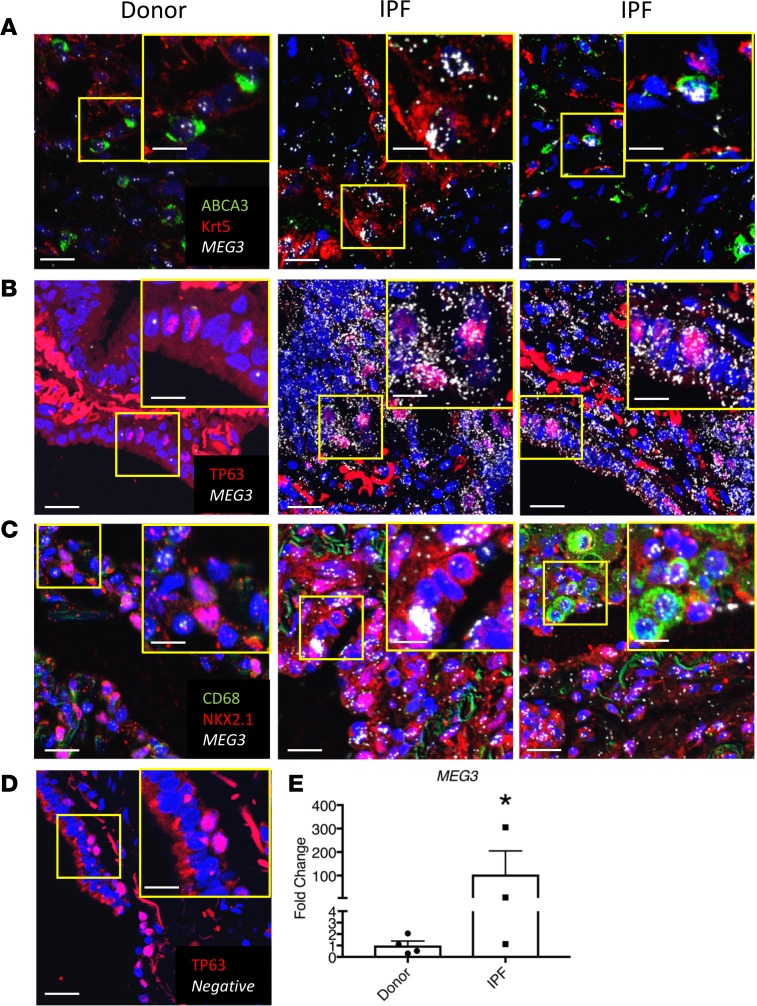
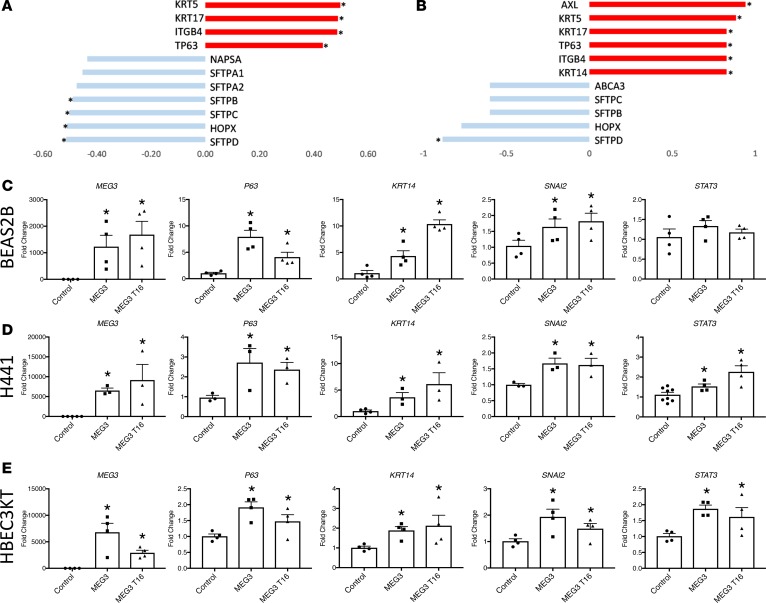
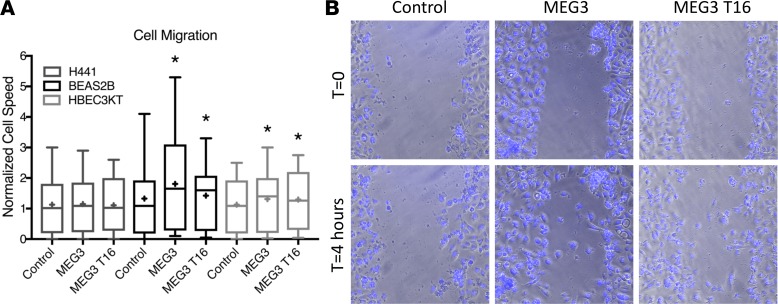
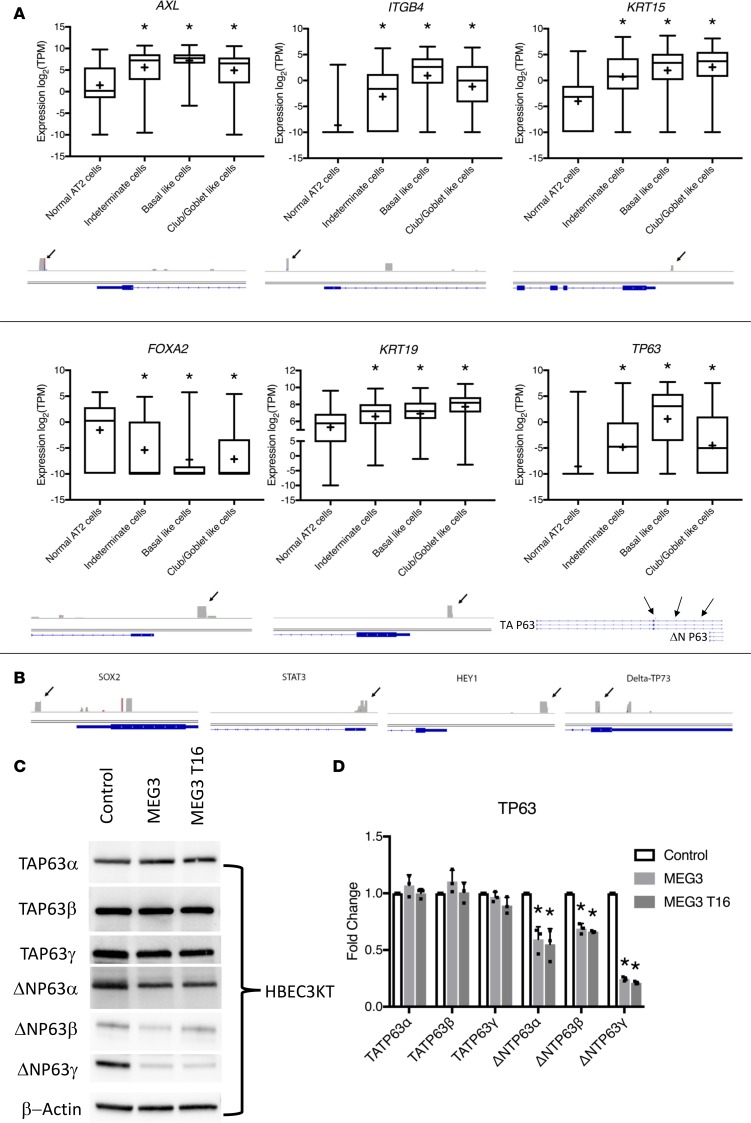
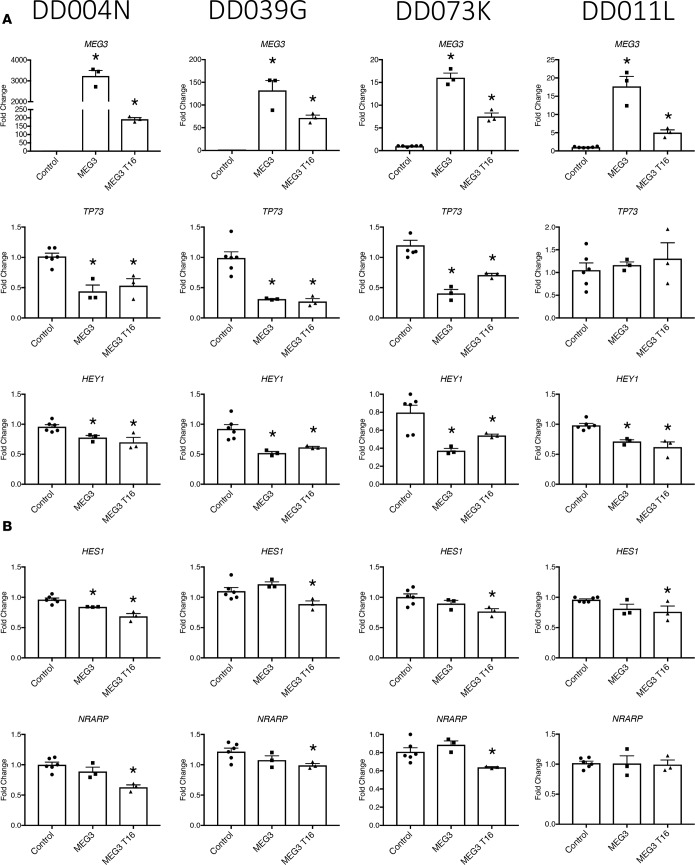
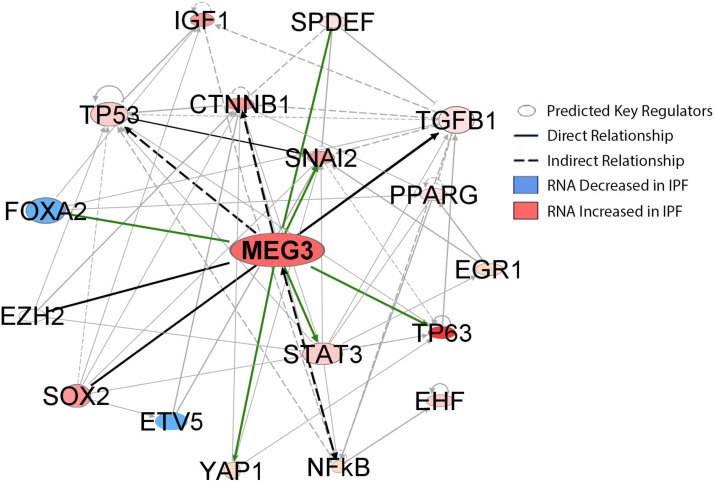
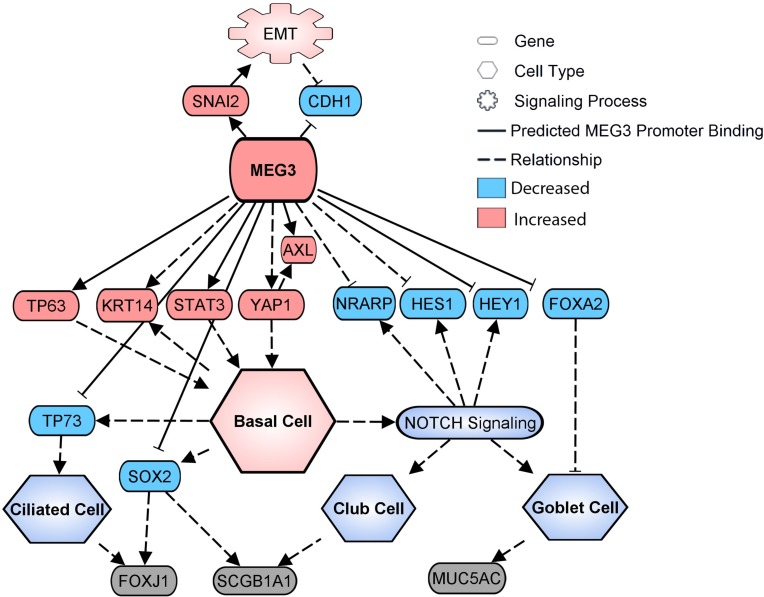
Idiopathic pulmonary fibrosis (IPF) is a chronic interstitial lung disease causing fibrotic remodeling of the peripheral lung, leading to respiratory failure. Peripheral pulmonary epithelial cells lose normal alveolar epithelial gene expression patterns and variably express genes associated with diverse conducting airway epithelial cells, including basal cells. Single-cell RNA sequencing of pulmonary epithelial cells isolated from IPF lung tissue demonstrated altered expression of LncRNAs, including increased MEG3. MEG3 RNA was highly expressed in subsets of the atypical IPF epithelial cells and correlated with conducting airway epithelial gene expression patterns. Expression of MEG3 in human pulmonary epithelial cell lines increased basal cell-associated RNAs, including TP63, KRT14, STAT3, and YAP1, and enhanced cell migration, consistent with a role for MEG3 in regulating basal cell identity. MEG3 reduced expression of TP73, SOX2, and Notch-associated RNAs HES1 and HEY1, in primary human bronchial epithelial cells, demonstrating a role for MEG3 in the inhibition of genes influencing basal cell differentiation into club, ciliated, or goblet cells. MEG3 induced basal cell genes and suppressed genes associated with terminal differentiation of airway cells, supporting a role for MEG3 in regulation of basal progenitor cell functions, which may contribute to tissue remodeling in IPF.

Keywords: Fibrosis; Noncoding RNAs; Pulmonology.


Conflict of interest statement

Conflict of interest: The authors have declared that no conflict of interest exists.

Figures

Figure 1
Figure 1. Altered LncRNA expression in IPF epithelial cells.
(A) Differentially expressed LncRNAs (n = 21) were identified in single-cell RNA sequences from normal donor and IPF epithelial cells by a custom LncRNA screen (GEO GSE86618). The heatmap indicates fold changes of RNA expression in each IPF cell type. Significance was determined by ANOVA followed by Holm-Bonferroni post hoc test. P < 0.05. (B) MEG3 RNA was most increased in indeterminate and basal-like IPF epithelial cells. Significance was determined by ANOVA followed by Holm-Bonferroni post hoc test. Box-and-whisker plots represent the first and third quartile (box), median (line), mean (+), and minimum and maximum of the data (whiskers); *P < 0.01. TPM values are represented on a log2 scale. (C) Sashimi plots were generated by Integrative Genomics Viewer software to map reads of all known MEG3 exons in IPF cells expressing MEG3 RNA > 100 TPM and in 2 random control cells. All MEG3 RNA splicing exon variants were identified in IPF epithelial cells.
Figure 2
Figure 2. Colocalization of MEG3 RNA with basal epithelial cell markers.
MEG3 RNA was identified by proximity ligated in situ hybridization (PLISH) and costained with immunofluorescence markers in normal and IPF lung tissue. (A) MEG3 (white) is shown with the AT2 cell marker ABCA3 (green) and the basal cell marker KRT5 (red). MEG3 RNA was colocalized in the atypical AT2 cells and KRT5+ basal cells in IPF. (B) MEG3 (white) colocalized with the basal cell marker, TP63 (red). (C) Low levels of MEG3 RNA (white) were detected in epithelial cells expressing NKX2.1 (red) and in CD68+ macrophages (green). (D) A bacteria Bacillus subtilis gene mgsA target probe was used as a negative control for PLISH (white) and TP63 (red). Images are representative of n = 6 donors and n = 8 IPF patient samples. (E) Quantification of MEG3 RNA from CD326+-sorted epithelial cells isolated from IPF (n = 3) and healthy donor (n = 4). A 1-tailed Mann-Whitney t test was used to determine significance of increased MEG3 RNA expression. *P < 0.05. Images were obtained at ×60 magnification.
Figure 3
Figure 3. MEG3 RNA is correlated with RNAs associated with basal cells.
(A) Correlation of MEG3 RNA (Spearman correlation) with all genes identified in CD326+-sorted single-cell RNA sequencing from normal donor and IPF epithelial cells (GEO GSE86618) was performed using R software’s correlation function. A selection of the top 50 positive and negative Spearman correlation coefficients was visualized in graphical format. MEG3 was correlated with basal cell markers (KRT5, KRT17, ITGB4, and TP63) and was negatively correlated with normal alveoli markers (NAPSA, SFTPA1, SFTPA2, SFTPB, SFTPC, SFTPD, and HOPX). (B) Spearman correlation was performed on RNA from FACS-sorted AT2 cells from IPF and control lungs (GEO GSE94555). MEG3 correlated with basal cell markers, i.e., KRT5 and TP63, and negatively correlated with markers of differentiated alveolar epithelial cells, SFTPC and HOPX. (CE) MEG3 cDNA was expressed in (C) BEAS2B, (D) H441, and (E) HBEC3KT cells. MEG3 induced basal cell–associated genes (TP63, KRT14, and STAT3) and EMT-associated gene SNAI2. *P < 0.05, as determined by ANOVA; n = 3–4 wells transfected and n = 4 transfections for each cell line.
Figure 4
Figure 4. MEG3 expression increases cell migration.
MEG3 cDNA was expressed in HBEC3KT, H441, and BEAS2B cells. (A) Cell migration was assessed by scratch assay in HBEC3KT, H441, and BEAS2B cell lines transfected with MEG3 cDNA. MEG3 increased cell migration in HBEC3KT and BEAS2B cells. Cell migration is presented as cell speed normalized to empty vector–transfected control for each cell line. (B) Representative images of HBEC3KT cells transfected with MEG3 at 0 and 4 hours following scratch assay. Differences were determined by an ANOVA. *P < 0.05, n = 3–4 wells transfected and n = 3 transfections for each cell line. Average cell speed was calculated by Imaris cell tracking software. Over 10,000 cells were tracked for each transfection. Graphs represent an average of 3 separate experiments. Box-and-whisker plots represent the first and third quartile (Box), median (line), and minimum and maximum (whiskers) of each data set. Images were obtained at ×10 magnification.
Figure 5
Figure 5. MEG3-binding sites in the promoters of genes associated with basal cell differentiation.
ChOP-sequencing data of MEG3-binding sites in BT-549 cells (14) were analyzed using Homer’s Annotate Peak and visualized using integrated genomics viewer to reveal MEG3-binding sites in gene promoters and compared with differentially expressed genes identified by analyzing single-cell RNA sequencing of IPF and control lungs, as described in the Methods. MEG3-binding sites within promoters (arrows) were identified in genes (blue) associated with basal cells, including AXL, ITGB4, KRT15, KRT19, and FOXA2, which are altered in IPF. MEG3-binding sites were detected in the promoters of SOX2, STAT3, and HEY1 and in the TA/ΔN splicing region of TP63 and TP73, as shown as gray peaks with arrows in the gene maps. (A) Expression of basal cell–associated genes in IPF epithelial cell types from single-cell sequencing (5) and location of MEG3-binding sites curated from ChOP data (14). Box-and-whisker plots represent the first and third quartile (box), median (line), mean (+), and minimum and maximum of the data (whiskers). TPM expression values are represented on a log2 scale. (B) Location of MEG3-binding sites in the promoters of STAT3, SOX2, and HEY1 and before the ΔN TP63 and TP73 start sites. Peaks were visualized using Integrative Genomics Viewer software. (C) Western blots of MEG3-transfected HBEC3KT cells were used to assess TP63 splice variants. (D) MEG3 transfection inhibited levels of all ΔNTP63 isoforms and did not alter TAP63 isoforms in HBEC3KT cells. Differences in RNA expressions were determined by ANOVA followed by Holm-Bonferroni post hoc test. *P < 0.01.
Figure 6
Figure 6. MEG3 inhibits TP73, HES1, HEY1, and NRARP in primary HBEC cells.
MEG3 cDNA was transfected into primary donor human bronchial epithelial (HBEC) cells (donor identifiers, DD04N, DD039G, DD073K, and DD011L). RNA was collected 48 hours after transfection. (A) TP73 and the Notch target HEY1 were inhibited by the expression of MEG3 cDNA. (B) Notch targets HES1 and NRARP were inhibited by MEG3 transcript 16. Differences in RNA expression were determined by ANOVA. *P < 0.05; n = 3 wells transfected for each expression construct and n = 4 donors are shown.
Figure 7
Figure 7. MEG3 is predicted to interact within a regulatory network in IPF.
MEG3 was integrated into a previously generated IPF network of predicted key regulators active in CD326/HTII-280 FACS-sorted IPF and control epithelial cells using Ingenuity Pathway Analysis (IPA) software suite’s Path Designer and Genomatix (5). Black and gray lines represent relationships determined by IPA Ingenuity knowledge base literature mining or Genomatix. Green lines indicate interactions presently reported.
Figure 8
Figure 8. Proposed mechanism by which MEG3 regulates basal cell differentiation.
MEG3 regulates genes that promote basal cell specification and renewal, while preventing basal cell differentiation. In vitro, expression of MEG3 induces known basal cell markers (KRT14) and genes that promote basal cell self-renewal, TP63, YAP1, and STAT3, while genes associated with basal cell differentiation into ciliated (FOXJ1), club (SCGB1A1), or goblet cells (MUC5AC) are not changed. SOX2, Notch signaling, and TP73 are known to play an active role in basal cell differentiation. In primary HBEC cells TP73, SOX2, and Notch signaling targets HES1 and HEY1 are inhibited by MEG3 expression, predicting inhibition of basal cell differentiation by MEG3. Relationships are based on presently reported RNA changes induced by MEG3 expression in vitro.

References

    1. Kropski JA, Blackwell TS, Loyd JE. The genetic basis of idiopathic pulmonary fibrosis. Eur Respir J. 2015;45(6):1717–1727. doi: 10.1183/09031936.00163814. - DOI - PMC - PubMed
    1. Plantier L, et al. Ectopic respiratory epithelial cell differentiation in bronchiolised distal airspaces in idiopathic pulmonary fibrosis. Thorax. 2011;66(8):651–657. doi: 10.1136/thx.2010.151555. - DOI - PubMed
    1. Seibold MA, et al. The idiopathic pulmonary fibrosis honeycomb cyst contains a mucocilary pseudostratified epithelium. PLoS ONE. 2013;8(3):e58658. doi: 10.1371/journal.pone.0058658. - DOI - PMC - PubMed
    1. Wolters PJ, et al. Time for a change: is idiopathic pulmonary fibrosis still idiopathic and only fibrotic? Lancet Respir Med. 2018;6(2):154–160. doi: 10.1016/S2213-2600(18)30007-9. - DOI - PMC - PubMed
    1. Xu Y, et al. Single-cell RNA sequencing identifies diverse roles of epithelial cells in idiopathic pulmonary fibrosis. JCI Insight. 2016;1(20):e90558. - PMC - PubMed

Publication types

MeSH terms