. 2018 Sep 5;9(1):3598.
doi: 10.1038/s41467-018-05696-2.

Combining discovery and targeted proteomics reveals a prognostic signature in oral cancer

Affiliations

Combining discovery and targeted proteomics reveals a prognostic signature in oral cancer

Carolina Moretto Carnielli et al. Nat Commun. .

Abstract

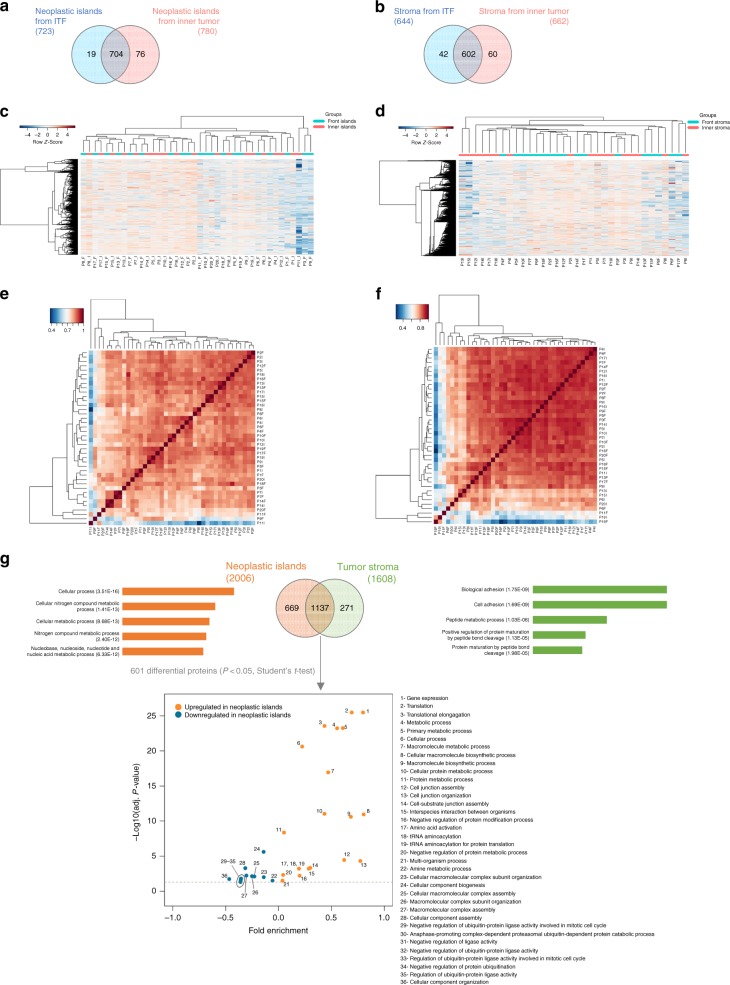
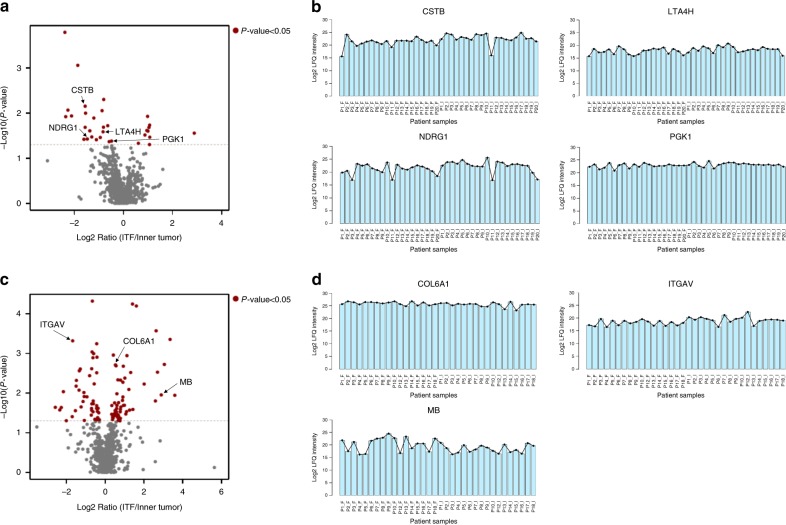
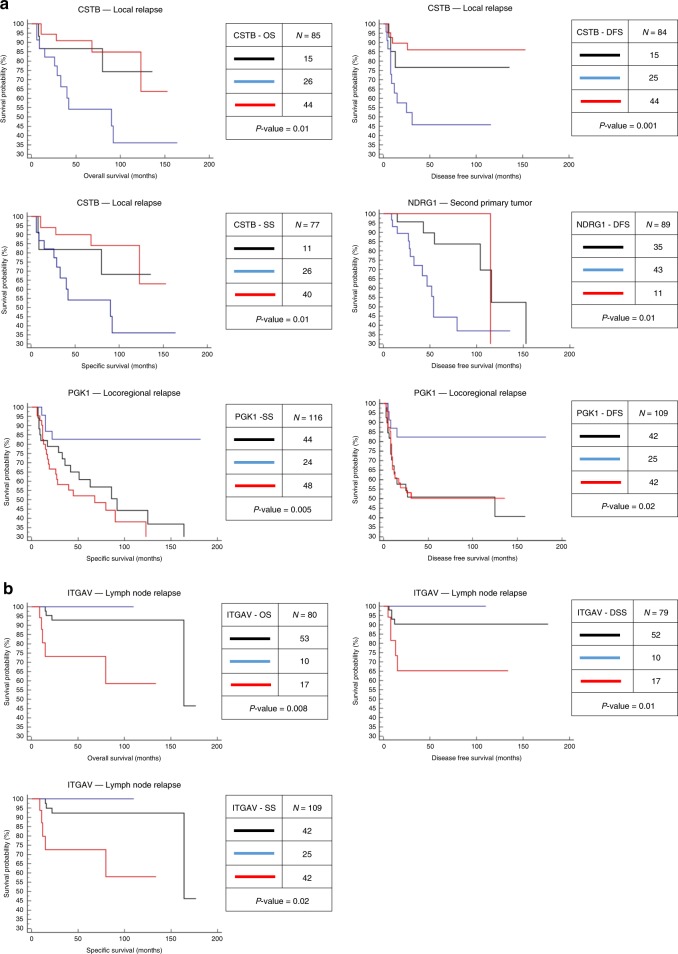
Different regions of oral squamous cell carcinoma (OSCC) have particular histopathological and molecular characteristics limiting the standard tumor-node-metastasis prognosis classification. Therefore, defining biological signatures that allow assessing the prognostic outcomes for OSCC patients would be of great clinical significance. Using histopathology-guided discovery proteomics, we analyze neoplastic islands and stroma from the invasive tumor front (ITF) and inner tumor to identify differentially expressed proteins. Potential signature proteins are prioritized and further investigated by immunohistochemistry (IHC) and targeted proteomics. IHC indicates low expression of cystatin-B in neoplastic islands from the ITF as an independent marker for local recurrence. Targeted proteomics analysis of the prioritized proteins in saliva, combined with machine-learning methods, highlights a peptide-based signature as the most powerful predictor to distinguish patients with and without lymph node metastasis. In summary, we identify a robust signature, which may enhance prognostic decisions in OSCC and better guide treatment to reduce tumor recurrence or lymph node metastasis.


Conflict of interest statement

The authors declare no competing interests.

Figures

Fig. 1
Fig. 1
Experimental design. a The ITF was delimited as a 1 mm depth from the edge of the tumor slice, and the inner tumor was defined as up to 1 mm from the epithelial tumor tissue origin. In more detail, the ITF and inner tumor with small and large neoplastic islands (arrows) are surrounded by the tumor stroma (dashed lines) (scale bars, 200 μm). b Laser microdissection of the six regions of interest. c, d Protein extraction from microdissected tissues and trypsin digestion. The peptide mixture was desalted in stage tips and analyzed by liquid chromatography coupled with tandem mass spectrometry (LC-MS/MS). e To select protein targets, MaxQuant and the Perseus package were used to identify and quantify proteins, and R software was used for statistical analysis of the clinicopathological parameters and for analysis of the proteins with positive staining for OSCC tissues in The Human Protein Atlas. f Targeted proteins were evaluated following two different strategies by immunohistochemistry in OSCC tissues and by SRM of saliva samples from OSCC patients with (N+) or without (N0) lymph node metastasis
Fig. 2
Fig. 2
Quantitative proteome analysis indicates spatially distinct protein signatures. a, b Venn diagram of common and “exclusive” proteins identified for a neoplastic islands or b tumor stroma from the ITF and the inner tumor. c, d Clustering analysis of proteins identified in the ITF and the inner tumor of c neoplastic islands (n = 20 samples) and d tumor stroma (n = 17 samples). Values for each protein (rows) and for each microdissected sample (columns) are colored based on the protein abundance, in which high (red) and low (blue) values (Z-scored log2 LFQ intensity values) are indicated based in the color scale bar shown in the top left of the figure. The colored bars shown on the top of the figure indicate samples from the ITF (blue) or from inner tumor (pink). Hierarchical clustering was performed in the R environment using the Euclidean distance with complete ligation for neoplastic island data and the Euclidean distance with average ligation for stromal data. e, f Heat map of Pearson correlation coefficients derived from pairwise comparison of the 20-patient samples for e neoplastic island samples and for the f tumor stroma samples analyzed by discovery proteomics. Log2 LFQ intensity values of the protein dataset after filtering reverse and “only by site” entries were used to calculate the correlation coefficient using Perseus software, and the heat map was constructed using R language with the function heatmap.3. The dendrogram was built using Euclidean distance with complete ligation. Samples with low correlation values and low number of quantified proteins from tumor stroma dataset were removed, as shown in Supplementary Figure 2. g The five most enriched GO terms that distinguished neoplastic islands from tumor stroma are represented. GO terms for cellular metabolic processes are overrepresented for neoplastic island proteins, whereas cellular adhesion and protein cleavage processes are overrepresented for tumor stromal proteins. The statistically significant proteins between neoplastic islands compared with tumor stroma (two-sided Student’s t test, P value < 0.05) also indicate, among other overrepresented processes, metabolic processes for proteins upregulated in neoplastic islands
Fig. 3
Fig. 3
Abundance profile of proteins selected for verification steps. a Differentially regulated proteins between the ITF and inner tumor for neoplastic islands, as determined by plotting Student’s t test (P value < 0.05, two-sided) P values versus the log2 ratio of the LFQ intensity (ITF/Inner tumor), are represented on volcano plots. Significant proteins are indicated by red dots. b Line plots depicting the abundance profiles (log2 of the LFQ intensity) of the proteins selected for the verification step. Shown are the abundances across all MS runs from discovery proteomics analysis of neoplastic island samples. Samples from the ITF are denoted by “F”, and samples from inner tumor are denoted by “I”. c Differentially regulated proteins between the ITF and inner tumor for tumor stroma (see panel a for plot details). d Protein abundance profiles for tumor stroma samples (see panel b for plot details)
Fig. 4
Fig. 4
Immunohistochemical staining of targeted proteins. Oral SCC tissue samples from a set of 125 cases were used to verify the abundance of a CSTB, LTA4H, NDRG1, and PGK1 neoplastic island proteins, and 96 cases were used to verify the abundance of b COL6A1, ITGAV, and MB tumor stroma proteins. Among the cases, it was possible to analyze 114 cases for CSTB, 118 cases for LTA4H, 119 cases for NDRG1, 118 cases for PGK1, 93 cases for COL6A1, 80 cases for ITGAV, and 86 cases for MB. The scores that represent the sum of the intensities and percentage of protein staining in the ITF or the inner tumor are shown as a heat map. Differential staining in ITF and inner tumor in both neoplastic islands and tumor stroma was identified, in agreement with the MS discovery analysis however, we also identified negative cases for each protein and cases with gradual staining according to the color key shown at the top right. For proteins selected in neoplastic island, increased CSTB and NDRG1 expression was identified in the inner tumor, according to the MS results, with staining only inside neoplastic cells of OSCC. However, LTA4H and PGK1 presented peripheral staining in neoplastic cells and were also detected in cells from tumor stroma, such as inflammatory cells. For proteins selected in tumor stroma, greater COL6A1 and MB expression was identified in the ITF area, which demonstrates the preferential localization in OSCC regions compared with that observed in the MS discovery analysis. COL6A1, ITGAV, and MB proteins were preferentially present in tumor stroma (Histological images obtained using a ×40 objective, scale bars, 200 μm)
Fig. 5
Fig. 5
Kaplan−Meier survival analysis of IHC and clinical outcomes. Overall survival (OS), disease-free survival (DFS) and specific survival (SS) were available in relation to a second primary tumor, local, locoregional or lymph node relapse. a Patients with lower CSTB expression in the ITF had a higher risk of local relapse and worse survival (P value < 0.05, log-rank test). In addition, a lower NDRG1 expression in the ITF was associated with a higher risk of the patient presenting a second primary tumor and a worse DFS (P value < 0.05, log-rank test). Equal expression between the ITF and the inner tumor or higher CSTB and NDRG1 expression in the ITF did not influence the local relapse or second primary tumor. Patients with higher PGK1 expression in the ITF had a worse survival and early locoregional recurrence (P value < 0.05, log-rank test). b Patients with higher expression of ITGAV in the ITF have a greater risk to present lymph node metastasis relapse and poor survival (P value < 0.05, log-rank test)
Fig. 6
Fig. 6
Targeted proteomics of saliva proteins. a, b Volcano analyses show log2 ratio of N+/N0 of a proteins and b peptides according to the adjusted P value. Proteins that met the indicated statistical cut-off criteria (Mann−Whitney U test, with P values adjusted for multiple comparisons using the Benjamini−Hochberg FDR method, adjusted P value < 0.05) are colored in red. c The graph demonstrates individually the L/H intensity ratio (not log transformed) of six differentially expressed proteins CSTB, COL6A1, ITGAV, LTA4H, PGK1, and NDRG1 between N+ and N0 saliva samples. *P value < 0.05, Mann−Whitney U test. d Peptide relative quantification (log2 L/H ratio) between N+ and N0 saliva samples. For each protein, 2−3 proteotypic peptides were monitored, with exception for NDRG1, only one proteotypic peptide was monitored. The light peptide (corresponding to the endogenous peptide present in saliva) and the heavy peptide (which corresponds to the synthetic peptide spiked-in saliva) were monitored, and the light/heavy ratio for each of the 14 peptides was obtained by Skyline. Box plots represent the median and interquartile range, whiskers represent the 1–99 percentile, and outliers are represented by empty circles. e Bar plots represent the relationship between MS Discovery analysis of tissue and SRM-MS of saliva in the identification of potential prognostic signatures. The log2 N+/N0 ratio for saliva samples and log2 ITF/inner ratio for neoplastic islands and tumor stroma from microdissected tissues are represented in the graph. f Representative figure illustrates the gradient dynamics of the protein abundance between tissue (ITF and inner tumor) and saliva (N+ and N0), which indicates that the abundance of proteins in saliva and its association with prognosis (N+ and N0) is not necessarily associated with the proximity of the altered oral epithelium. Other components, such as water, electrolytes, DNA, RNA, and microorganisms, were not included. Images in f were adapted from files provided by Servier Medical Art (https://smart.servier.com/, licensed under a Creative Commons Attribution 3.0 Unported License)
Fig. 7
Fig. 7
Prognostic signature in saliva distinguishes OSCC patients. a Workflow for machine-learning approach to measure the predictive power of peptides and proteins. b, c The predictive relevance of individual proteins and peptides to distinguish N0 from N+ patients is represented by a bar chart indicating their cross-validation ROC AUC (100 repetitions of stratified tenfold cross-validation). The most relevant protein and peptide ordered by the AUC is LTA4H and Pep8_LTA4H, respectively. When only the AUCs of the individual signatures (size 1) are considered, the three highest areas at the protein level are LTA4H (73.9%), COL6A1 (62.1%), and ITGAV (60.5%) and at the peptide level are Pep12_CSTB (73.5%), Pep8_LTA4H (72.8%), and Pep9_COL6A1 (71.0%). d Cross-validation estimated ROC curves of the best protein and peptide signatures. e Box plots representing the AUC of all possibilities of signatures for both imbalanced and balanced (SMOTE) cross-validation. At the peptide level, 1024 signatures were tested. At the protein level, 63 signatures were tested. Signatures formed by peptides from different proteins S1 {Pep8, Pep12} and S2 {Pep8, Pep9, Pep12} have approximately 10.5% higher AUC than the peptide signature formed by LTA4H (S4). S2 peptide signature outperformed both S1 and S4 signatures. The candidate signatures are indicated by labels: S1, S2, S3, and S4. Peptide sequences: Pep1_MB: HGATVLTALGGILK; Pep2_MB: YLEFISECIIQVLQSK; Pep3_PGK1: VLNNMEIGTSLFDEEGAK; Pep4_PGK1: VLPGVDALSNI; Pep5_ITGAV: LQEVGQVSVSLQR; Pep6_ITGAV: STGLNAVPSQILEGQWAAR; Pep7_LTA4H: LTYTAEVSVPK; Pep8_LTA4H: DLSSHQLNEFLAQTLQR; Pep9_COL6A1: GLEQLLVGGSHLK; Pep10_COL6A1: TAEYDVAYGESHLFR; Pep11_NDRG1: EMQDVDLAEVKPLVEK; Pep12_CSTB: HDELTYF; Pep13_CSTB: SQVVAGTNYFIK; and Pep14_CSTB: VHVGDEDFVHLR. Four peptides were not included in the training model because they did not pass the filtering step (step 2 from Part 2 of Fig. 7a; P value < 0.1, Mann−Whitney U test). Box plots represent the median and interquartile range, whiskers represent the 1–99 percentile, and outliers are represented by “+”

References

    1. Ferlay J, et al. Cancer incidence and mortality worldwide: sources, methods and major patterns in GLOBOCAN 2012. Int. J. Cancer. 2015;136:E359–E386. doi: 10.1002/ijc.29210. - DOI - PubMed
    1. Edge SB, Compton CC. The American Joint Committee on Cancer: the 7th edition of the AJCC cancer staging manual and the future of TNM. Ann. Surg. Oncol. 2010;17:1471–1474. doi: 10.1245/s10434-010-0985-4. - DOI - PubMed
    1. Scully C, Bagan J. Oral squamous cell carcinoma overview. Oral Oncol. 2009;45:301–308. doi: 10.1016/j.oraloncology.2009.01.004. - DOI - PubMed
    1. Almangush A, et al. A simple novel prognostic model for early stage oral tongue cancer. Int. J. Oral Maxillofac. Surg. 2015;44:143–150. doi: 10.1016/j.ijom.2014.10.004. - DOI - PubMed
    1. da Silva SD, Hier M, Mlynarek A, Kowalski LP, Alaoui-Jamali MA. Recurrent oral cancer: current and emerging therapeutic approaches. Front. Pharmacol. 2012;3:149. doi: 10.3389/fphar.2012.00149. - DOI - PMC - PubMed

Publication types

MeSH terms