. 2018 Sep;561(7723):331-337.
doi: 10.1038/s41586-018-0499-y. Epub 2018 Sep 5.

A homing system targets therapeutic T cells to brain cancer

Affiliations

A homing system targets therapeutic T cells to brain cancer

Heba Samaha et al. Nature. 2018 Sep.

Retraction in

  • Retraction Note: A homing system targets therapeutic T cells to brain cancer.
    Samaha H, Pignata A, Fousek K, Ren J, Lam FW, Stossi F, Dubrulle J, Salsman VS, Krishnan S, Hong SH, Baker ML, Shree A, Gad AZ, Shum T, Fukumura D, Byrd TT, Mukherjee M, Marrelli SP, Orange JS, Joseph SK, Sorensen PH, Taylor MD, Hegde M, Mamonkin M, Jain RK, El-Naggar S, Ahmed N. Samaha H, et al. Nature. 2019 Mar;567(7746):132. doi: 10.1038/s41586-019-0967-z. Nature. 2019. PMID: 30787441 Free PMC article.

Abstract

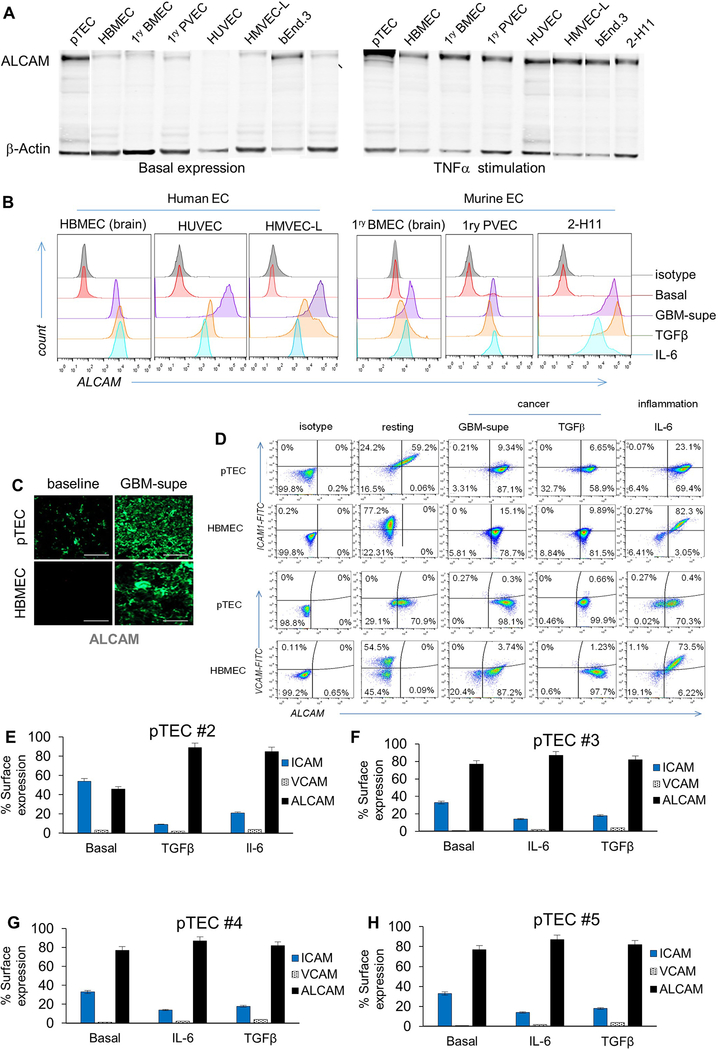
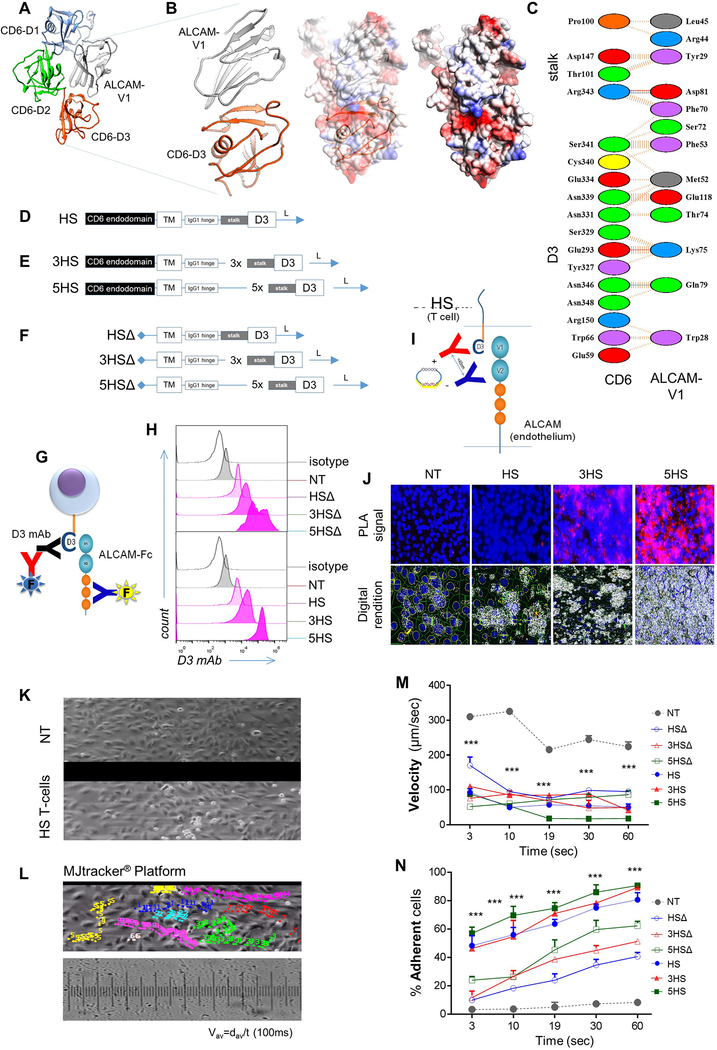
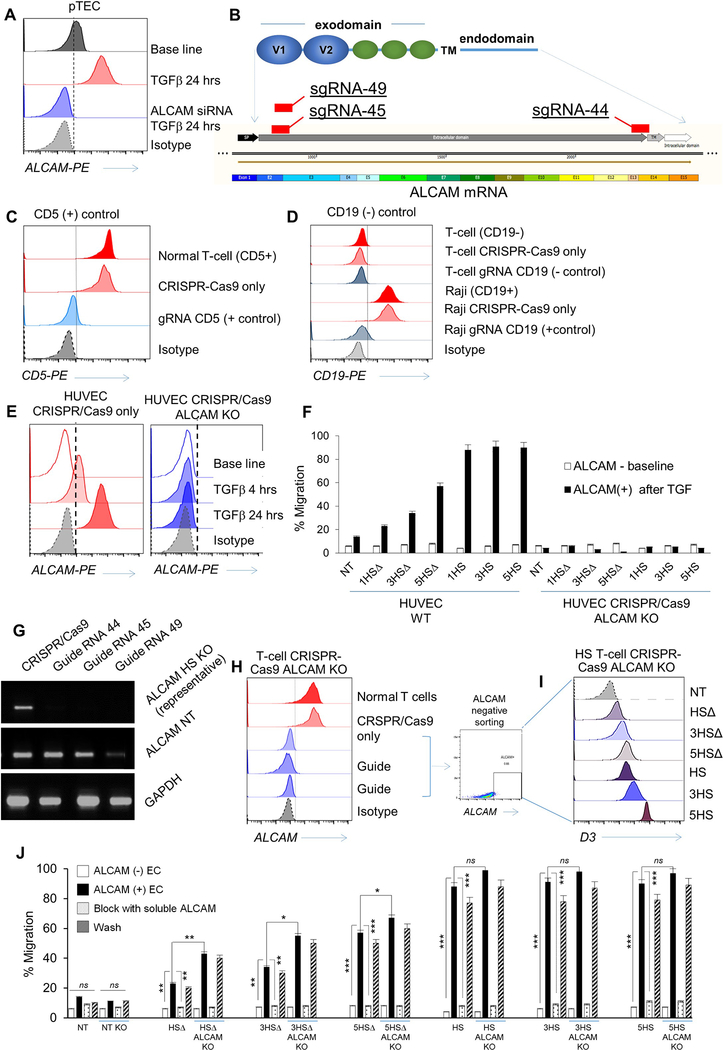
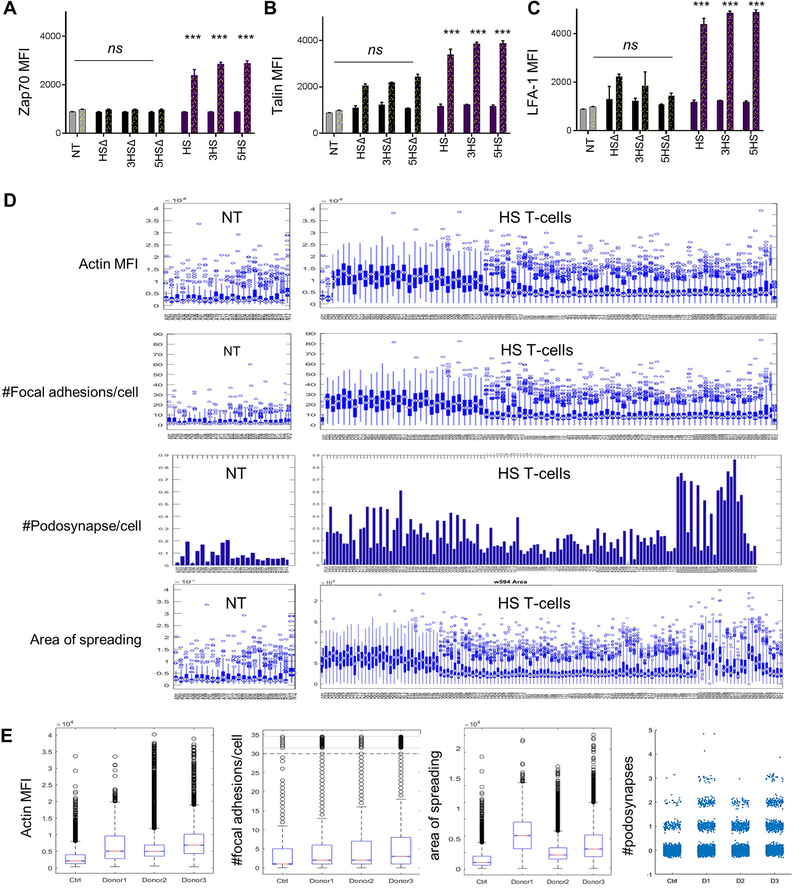
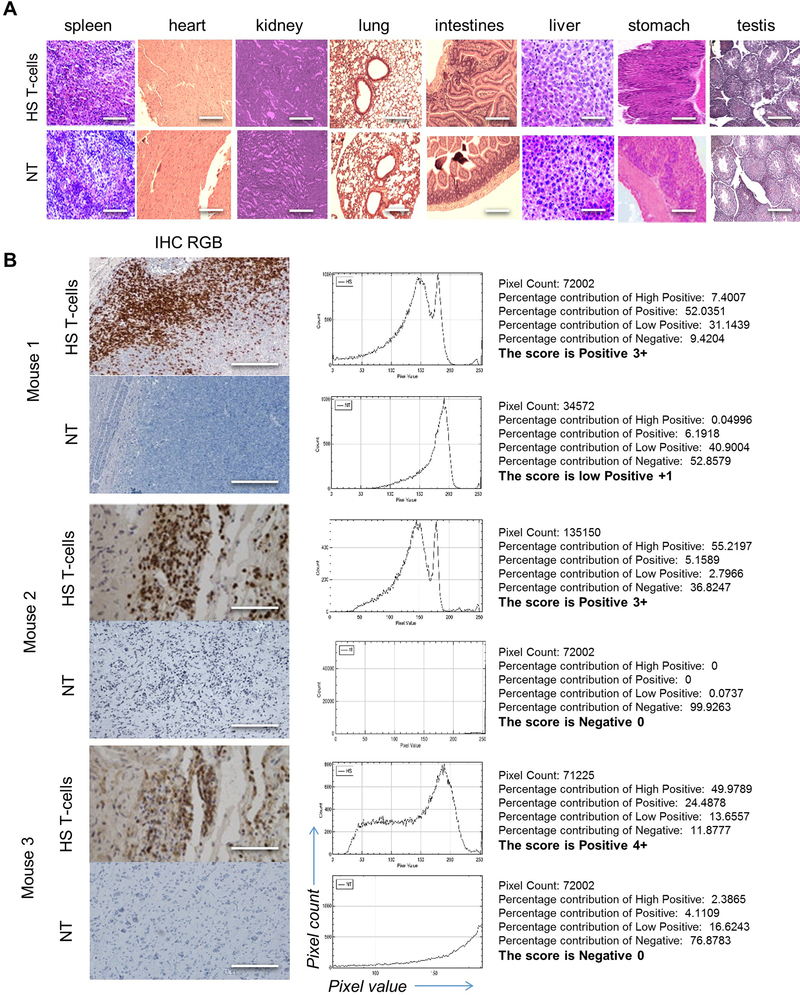
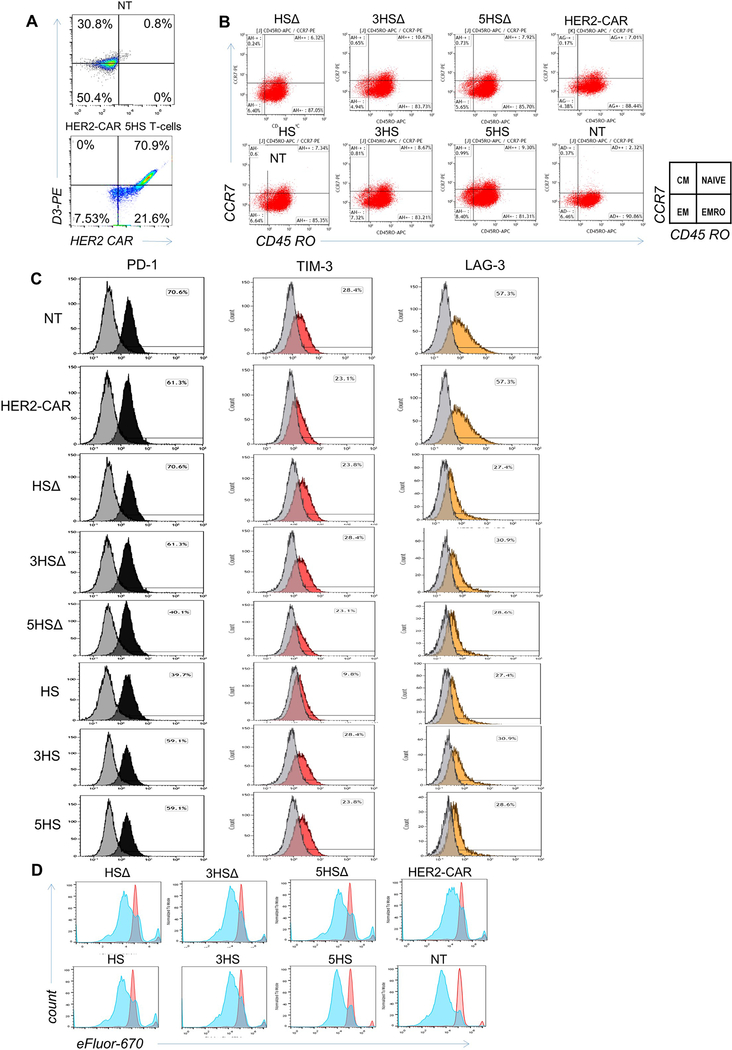
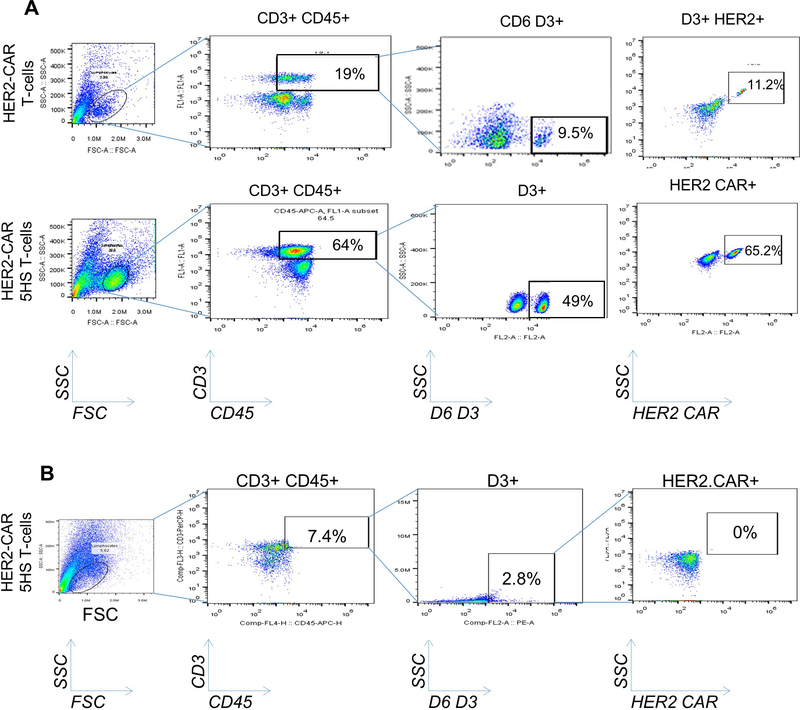
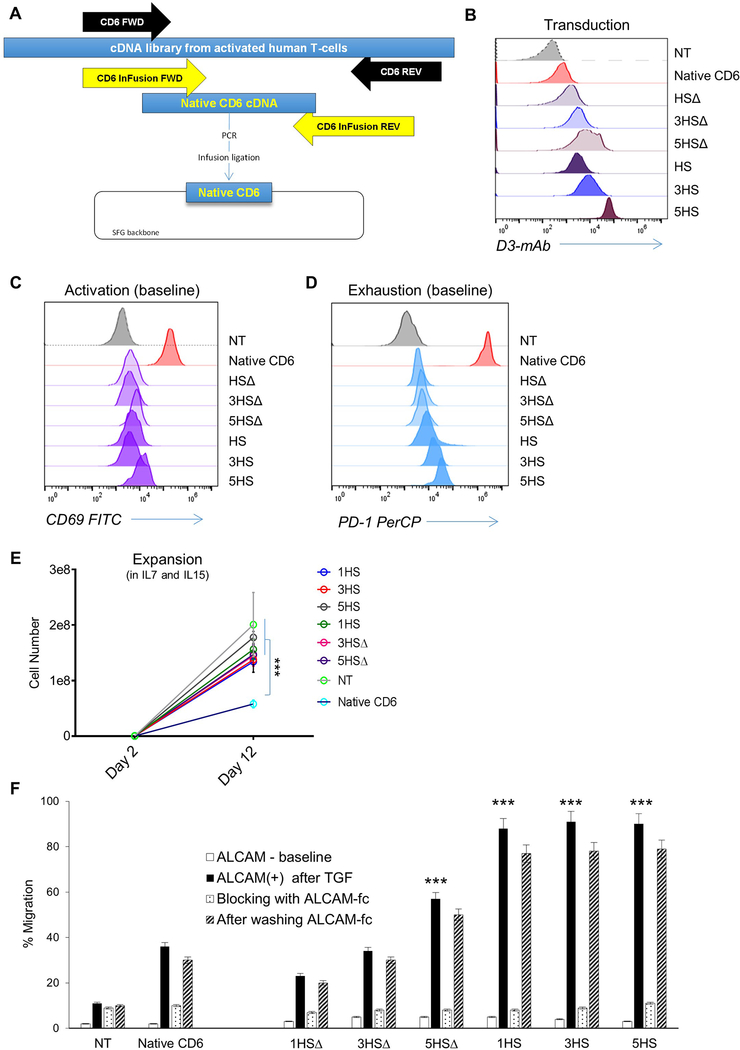
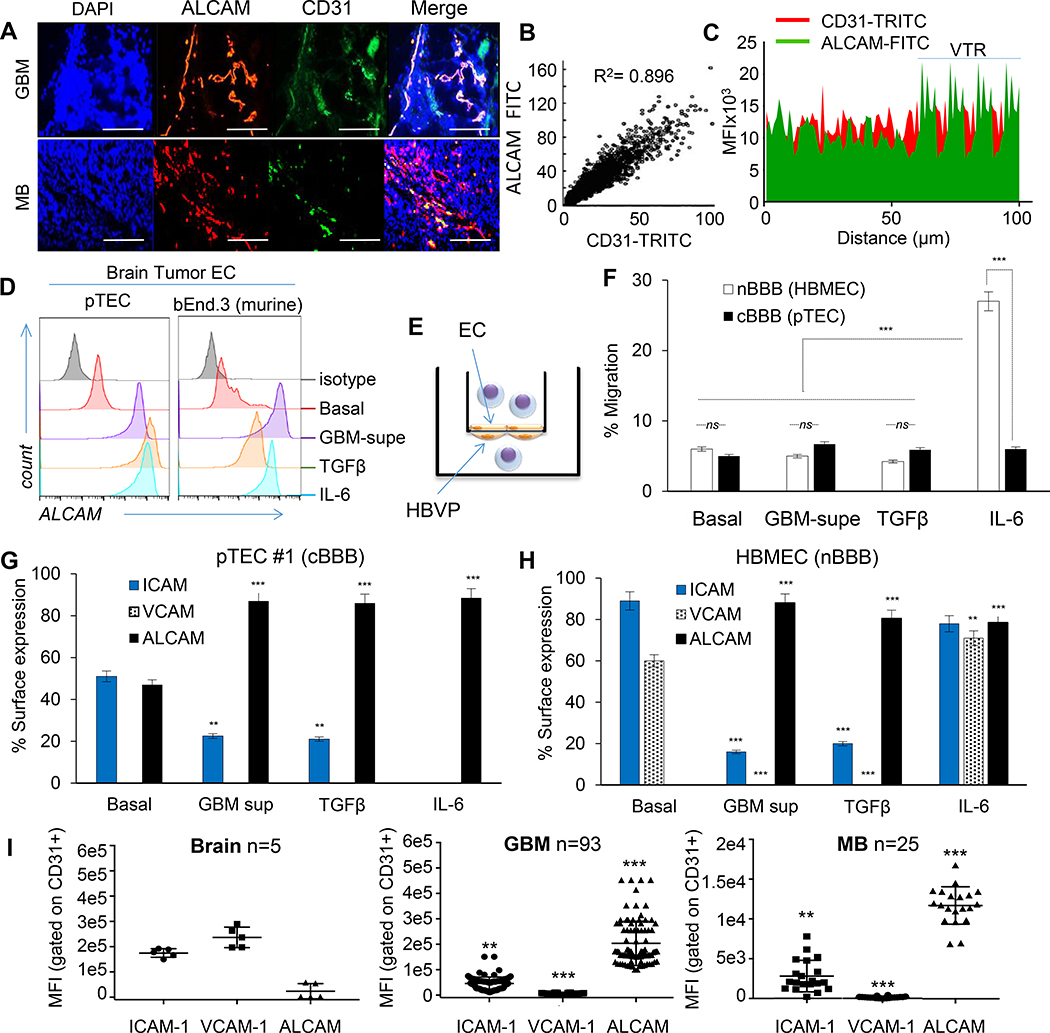
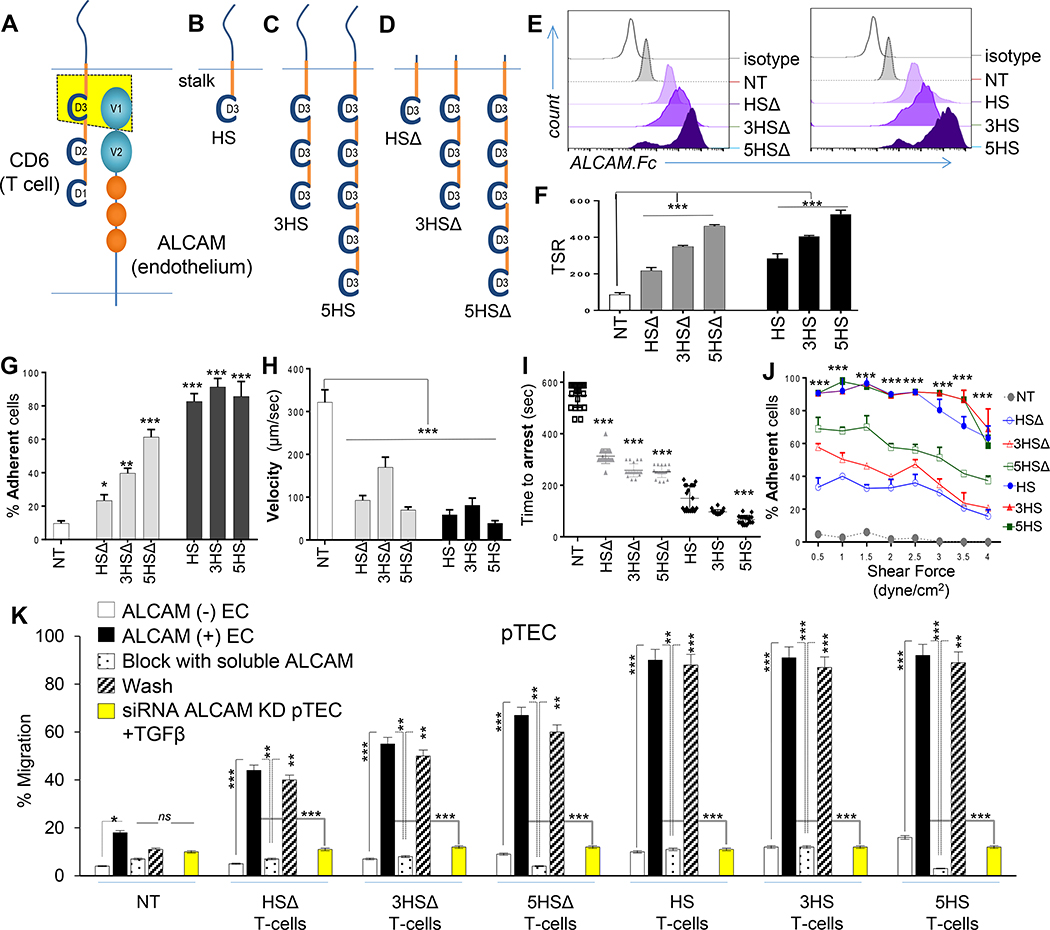
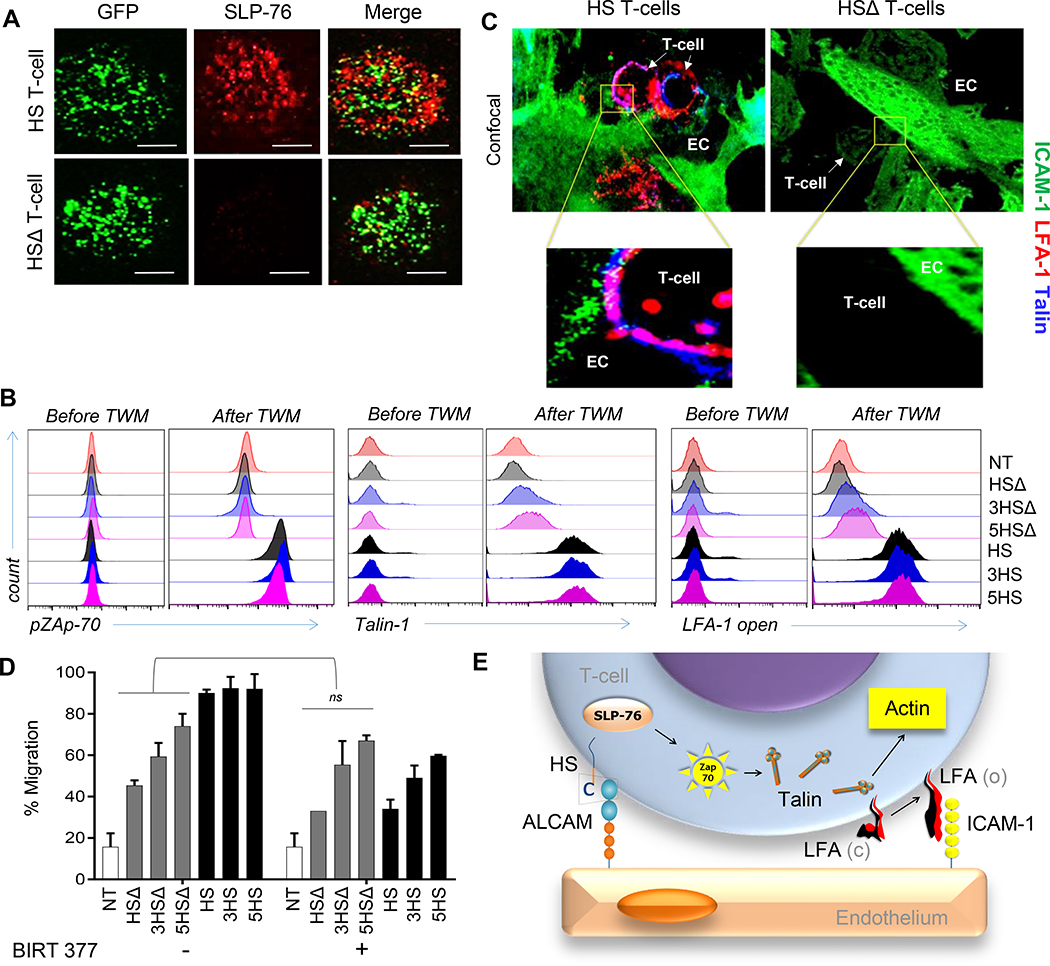
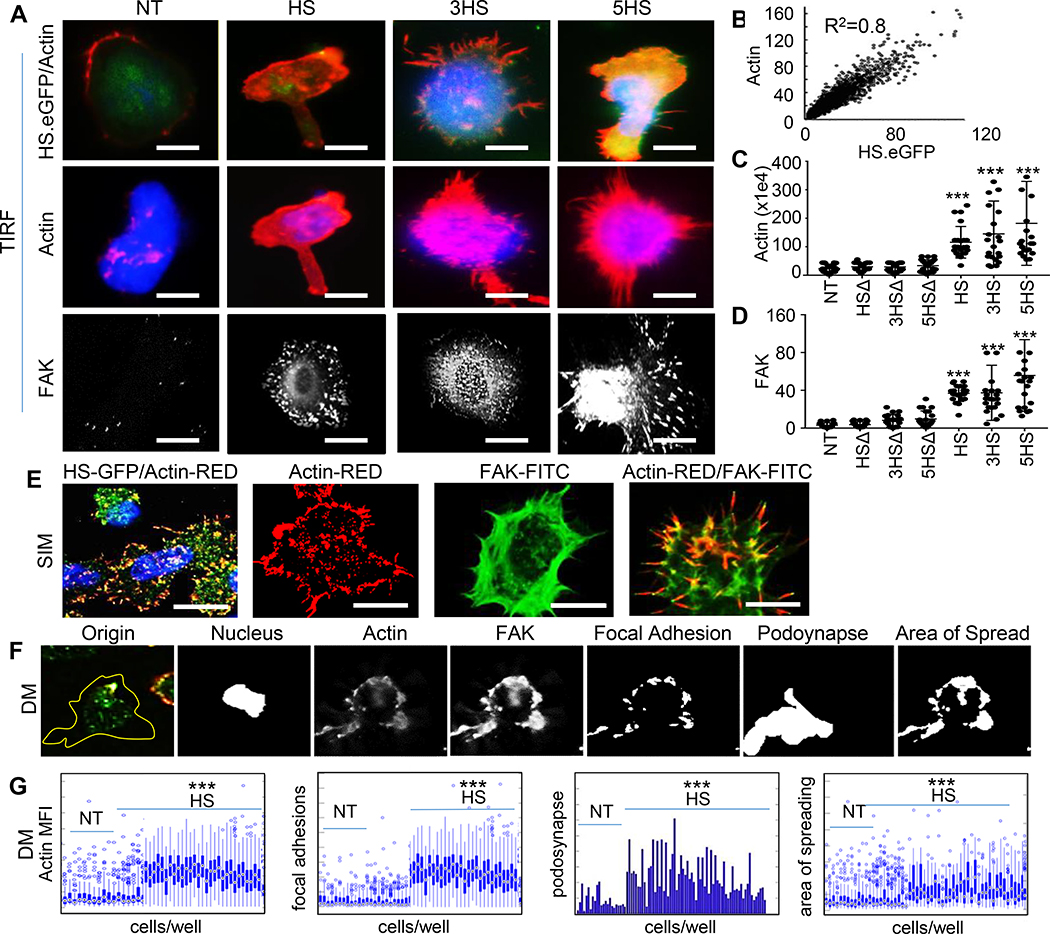
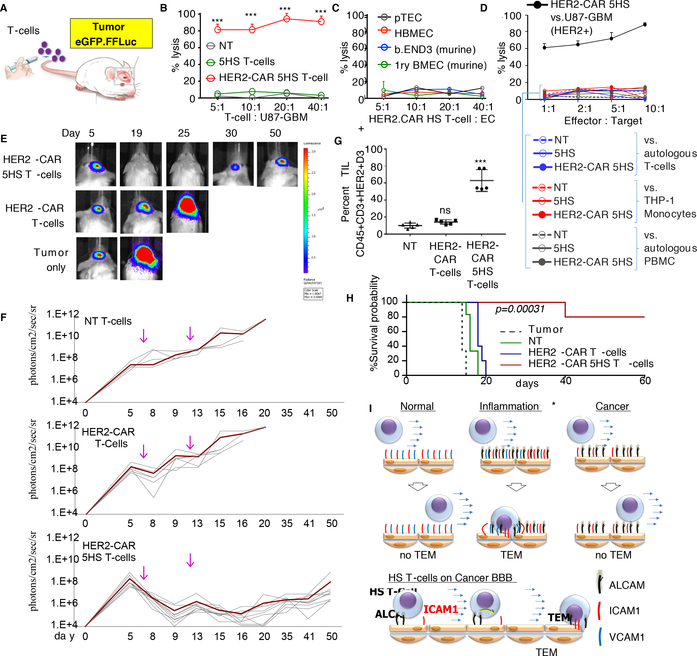
Successful T cell immunotherapy for brain cancer requires that the T cells can access tumour tissues, but this has been difficult to achieve. Here we show that, in contrast to inflammatory brain diseases such as multiple sclerosis, where endothelial cells upregulate ICAM1 and VCAM1 to guide the extravasation of pro-inflammatory cells, cancer endothelium downregulates these molecules to evade immune recognition. By contrast, we found that cancer endothelium upregulates activated leukocyte cell adhesion molecule (ALCAM), which allowed us to overcome this immune-evasion mechanism by creating an ALCAM-restricted homing system (HS). We re-engineered the natural ligand of ALCAM, CD6, in a manner that triggers initial anchorage of T cells to ALCAM and conditionally mediates a secondary wave of adhesion by sensitizing T cells to low-level ICAM1 on the cancer endothelium, thereby creating the adhesion forces necessary to capture T cells from the bloodstream. Cytotoxic HS T cells robustly infiltrated brain cancers after intravenous injection and exhibited potent antitumour activity. We have therefore developed a molecule that targets the delivery of T cells to brain cancer.


Conflict of interest statement

Competing Interest Declaration: None identified that pertains to this work.

Figures

ED-Figure 1 │
ED-Figure 1 │. Analysis of CAM expression in primary brain tumors.
(A) High-throughput IFC analysis routine of the endothelial adhesion molecules; ICAM1, VCAM1, and ALCAM in primary 93 GBM, 25 MB and 5 normal brain. MATLAB segmentation and masking analysis algorithm of the co-immunofluorescence (co-IFC) of ICAM1 or VCAM (acquired on 647 channel), CD31 (acquired on 594 channel) and ALCAM (acquired on 488 channel), DAPI (acquired on blue/cyan channel). (B) Isolation and characterization of pTEC. Flow-cytometry sorting gating strategy of pTEC from freshly excised glioblastoma (GBM; n=5) based on CD31 positivity. GBM EC isolated also expressed the endothelial markers VE-cadherin, von Willebrand Factor (vWF) and ALCAM. Isotype shown in lighter grey and test shown in darker grey in individual histograms. n=5 surgical samples each interrogated at least twice. 100,000 or more events were acquired per condition.
ED-Figure 2 │
ED-Figure 2 │. ALCAM expression in a panel of human and murine endothelial-cells and their reactivity to inflammatory and cancerous conditioning.
(A) Western Blot for ALCAM in a panel of human and murine EC lines: pTEC (primary Tumor EC from GBM surgical excision), HBMEC (Human Brain Microvascular Endothelial-cells), 1ry BMEC (Primary Brain Microvascular Endothelial-cells), 1ry PVEC (Primary Pulmonary Vein Endothelial-cells), HUVEC (Human Umbilical Cord Vascular EC), HMVEC-L (Human Microvascular EC of the Lung), bEnd.3 (murine brain tumor EC) and 2-H11 (murine SV40-transformed axillary lymph node vascular endothelium). The left panel shows basal ALCAM expression except in tumor EC (pTEC and 2-H11). Right panel shows the induction of ALCAM in all endothelial-cells after incubation with TNFα for 6 hours. (B) Expression of ALCAM at baseline and after 6 hours of conditioning in GBM-supe, TGFβ or IL6. Only tumorous-EC expressed ALCAM at baseline while normal-EC did not. C) IFC for ALCAM in 5×10⁴ pTECs and HBMEC in the in vitro BBB-model at baseline and after culture in GBM-supe. Scale-bar=50μm. (D) Differential expression of key adhesion molecules at baseline and under the influence of cancer and inflammation in pTEC and HBMEC. Flow-cytometry dot plots detailing of baseline expression of ALCAM, VCAM1 and ICAM1 on 1×10⁴ pTEC and HBMEC and conditioned expression after culture in GBM-supe, TGFβ or IL6. (E-H) Expression of adhesion molecules at baseline and under the influence of cancer and inflammation in pTEC (n=4) acquired from surgical resection samples (pTEC #1 is shown in Figure 1G).
ED-Figure 3 │
ED-Figure 3 │. In silico design of the prototype and derivative Homing System (HS) molecules, their forced-expression and detection on T-cells, and studies of their in vitro dynamic interaction with EC under shear-stress.
(A) The potential interaction between ALCAM V1 (grey ribbon) and CD6 from computational docking. D1 of CD6 is colored blue, D2 is colored green and D3 is colored orange. (B) Details of the potential interaction interface between ALCAM V1 (grey ribbon) and CD6 D3 (orange ribbon) is shown. A rendering of the electrostatic surface of the ALCAM V1 (grey ribbon) with the D3 domain of CD6 (orange ribbon) in the same orientation. Potential interacting residues are highlighted in the models and (C) in a diagram generated from PDBe PISA and PDBSum. A small region of positively-charged residues in ALCAM V1 appears to interact with a negatively-charged patch of residues on CD6 D3. (D) Structure of the prototype HS-molecule. (E) HS-multimers 3HS and 5HS. (F) HS molecules with non-signaling endodomains, HSΔ, 3HSΔ and 5HSΔ. (G) Cartoon depicting the strategy used for surface detection of the HS-exodomain using a D3-specific antibody and specific binding of HS-exodomain to soluble ALCAM. (H) Flow-cytometry confirming HS surface expression (D3 mAB) on T-cells. (I) Cartoon depicting the design of the HS/ALCAM PLA experiment and (J) the digital rendition using ImageTool®. The ALCAM probe (–) binds to the D3 probe (+) to trigger the polymerase chain (PCR) reaction generating the red fluorescent signal that is quantified as total signal per region (TSR) in Fig. 2F. (K and L) Dynamic microfluidic studies showing (K) still image from the Supplementary Video 1 of Bioflux® channels with non-transduced control (NT) T-cells (top) vs. 1×10⁶ HS T-cells interrogated under shear force over an ALCAM-expressing endothelium and (L) still image from MJtracker® demonstrating various T-cells under interrogation for various TEM dynamic measures, the standard grid used and the equation used for calculations (bottom). (M) Dynamic adhesion of T-cells to EC per field of view and (N) average dynamic rolling velocity against time; *p<0.05, **p<0.01, ***p <0.001. Two way ANOVA then Tukey for multiple-comparisons (compared to NT).
ED-Figure 4 │
ED-Figure 4 │. Functional effects of elimination of ALCAM on endothelial-cells and knock out of the human ALCAM gene using CRISPR-Cas9 technology and its effect on T-cell BBB migration.
(A) Flow-cytometry of ALCAM expression on 1×10⁶ wild-type pTEC at base-line, after TGFβ induction of ALCAM then after being transfected with 25nM ALCAM siRNA for 48 hours to knockdown (KD) ALCAM. Transmigration assay using pTECs to simulate a cancerous BBB showing percentage of migrant T-cells vs ALCAM-KD is shown in Figure 2K. (B) Highest 3 scoring guide RNA designs (sgRNA 44, sgRNA45 and sgRNA49) as seen on the SnapGene® software intended to disrupt ALCAM exons for the extracellular and transmembrane moiety. (C) CD5-KO and (D) CD19-KO were used as positive and negative experimental controls, respectively. (E) Flow-cytometry of ALCAM expression on wild-type human umbilical vein endothelial-cells (HUVEC) and HUVEC-ALCAM-KO using CRISPR/Cas9 (using the guide sgRNA 45) assessed at baseline and after TGFβ incubation. Isotype was used as control. (F) Transmigration assay showing percentage of 2×10⁶ migrating T-cells on wild-type HUVEC before and after ALCAM induction compared to ALCAM-KO HUVEC. Both experiments were done at base line then after ALCAM induction was confirmed. Error bars are Mean±SD (n≥3 experiments; donor T-cells n=3), **p<0.01, ***p <0.001. Tukey Test (compared to wild type pTEC). (G) Real-time polymerase chain reaction (RT-PCR) analysis of representative of 1×10⁶ ALCAM-KO HS T-cells in comparison to wild type normal T-cells. GAPDH is used as an internal control. (H) Flow-cytometry showing >90% knockout efficiency of the 3 sgRNA on 1×10⁵ T-cells in comparison to wild-type normal T-cells; CRISPR-Cas9 only and isotype were used as experimental controls. (I) Sorted ALCAM negative KO T-cells were then successfully transduced with the 6 HS constructs. (J) Transmigration assay showing percentage of 2×10⁵ migrating T-cells on a cancerous blood brain barrier (cBBB) model to compare wild type vs. ALCAM-KO T-cells in 4 conditions (ALCAM-, ALCAM+ conditioned with TGFβ, after blocking ALCAM, after washing the blocking away). Error bars in panels F and J are mean ±SD (n≥3 experiments; donors n=3), *p<0.05, **p <0.01. Tukey’s Test (compared to ALCAM+ T-cells).
ED-Figure 5 │
ED-Figure 5 │. Flow-cytometry quantification of nodes downstream of CD6 signaling endodomains and high-throughput analysis of super-resolution imaging using deconvolution microscopy (DM).
Quantification of the flow cytometric data for (A) LFA-1 open configuration, (B) pZap70 and (C) Talin before (solid bars) and after (dotted bars) TWM of 1×10⁵ T-cells. *** p<0.001. (D) Characterization of migrant T cells cellular features using collective quantification of Actin MFI, focal adhesions at HS/ALCAM interface, area of spreading, and podosynapse formation by high throughput microscopy in 3 donors. n=200–800 cells. (E) Box plot summary representing single cell data distributions of all replicates between all three donors expressing HS vs. NT controls.
ED-Figure 6 │
ED-Figure 6 │. Assessment of TILs in GBM explants.
(A) Flow-cytometry of 1×10⁴ TILs; all HS T-cell designs vs. NT control gated on CD3+CD45+ then D3+ fractions in GBM explants 24 hours after iv infusion. Representative plots shown. n=5 animals per group. (B) Cranial window on a live mouse bearing U87-GBM tumor (black arrow in inset).
ED-Figure 7 │
ED-Figure 7 │. Analysis of T-cell infiltrates in vital organs and normal brain after infusion of HS T-cells.
(A) CD3 immunohistochemistry (IHC) staining of normal vital tissues from animals receiving HS T-cells vs. NT control. n=3 mice/group. Scale bar=40μm (B) IHC showing HS T-cell infiltrate in micro-dissected GBM xenograft. Scoring of CD3 positive DAB signal was analyzed using IHC-Profiler® plugin in ImageJ®. Respective image analysis output and the score assigned using IHC-Profiler is also shown for each image. Total percentage of CD3+ DAB signal was more 66% in all mice brain with HS T-cells (score from 3 to 4) while percentage in control mice were less than 20% (score were 0–1). Scale bar=50μm. n=3 mice/group
ED-Figure 8 │
ED-Figure 8 │. Characterization of therapeutic T-cells after transmigration through an in vitro BBB-model.
(A) Flow-cytometry assessing the HER2-CAR- and the HS-molecule expression in HS HER2 CAR T-cells. (B-D) 1×10⁵ T-cells were collected from the bottom chamber after transmigration on ALCAM-expressing endothelium and analyzed for (B) CD45RO and CCR7 to assess their centrality, (C) expression of the exhaustion markers, PD-1 (black), TIM-3 (red) and LAG3 (orange); before transmigration is shown in grey, and (D) for their proliferative capacity before (red) and after (blue) transmigration, using efLuor 670.
ED-Figure 9 │
ED-Figure 9 │. Analysis of TIL isolated from tumor xenografts and normal brain for HER2-CAR HS T-cells.
(A) Flow-cytometry of TIL isolated from orthotopic tumor xenografts 24 hours after intravenous-injection of HS T-cell products, HER2-CAR T-cells and NT control T-cells. Xenografts were micro-dissected and TIL were isolated and enriched on percoll/ficoll gradient. Cells were gated on D3+ subset inside a gate of D3+CD45+. A subset of HER2-CAR inside a gate of CD3+CD45+ 3+ to detect the HER2-CAR HS T-cell specifically. n=5 mice/group, representative data shown. (B) Flow-cytometry following the same gating strategy indicating the absence of HS T-cells in the contralateral lobe to the tumor xenograft; data representative of 3 mice.
ED-Figure 10 │
ED-Figure 10 │. Overexpression of whole-length native CD6 and its phenotypic and functional effects on T-cells.
(A) Cartoon depicting the cloning strategy of native CD6 in an SFG retroviral backbone. (B) Flow-cytometry showing the transduction of 1×10⁵ native CD6 relative to HS constructs on T-cells. (C) Flow-cytometry of the activation marker CD69 on day 8 transduction without additional stimulation, and (D) of the activation and exhaustion marker PD-1 stained with PD-1 PerCP on day 8 transduction at basal level without additional stimulation. (E) Expansion plot T-cells expressing the native CD6 relative to NT and various HS T-cells; cells were grown in Il-7/15 and collected at day 2 and day 12 post transduction. (F) Transmigration 2×10⁵ T-cells through a cancerous BBB-model showing the percentage of migrant T-cells expressing native CD6 relative to various HS T-cells and the response of blocking ALCAM and its restitution. Error bars are mean ±SD (n≥3 experiments; donor T-cells n=3) ***p <0.001 compared to migration of CD6 through ALCAM+ BBB. ANOVA with Tukey’s post-hoc analysis.
Figure 1 │
Figure 1 │. Adhesion-molecule expression and permeability of cancerous endothelium.
(A) Representative confocal co-immunofluorescence (IFC) of ALCAM and CD31 in 93 GBM and 25 MB, performed twice with similar results. Nuclei DAPI-counterstained. Bar=100μm. (B) Pearson correlation of CD31:ALCAM pixel-mean fluorescence intensity (MFI). (C) Topographic co-localization of CD31:ALCAM over vascular segments (15 high-power fields [hpf] per tumor averaged; representative from n=3 with similar results). VTR, validation tandem-repeat. (D) ALCAM expression in human GBM pTEC (representative of n=5) and murine brain tumor endothelium (bEND.3) at baseline and after conditioning. (E) Cartoon depicting the BBB-model. HBVP, Human Brain Vascular Pericytes. (F) Transmigration of T-cells through BBB-model. Data represented as Mean±SD; Student’s t-test and One-way ANOVA with Tukey’s correction. *** P<0.001; ns, not significant. All experiments done using human T-cells; validated for 3 donors in ≥3 independent experiments. (G) CAM expression in pTEC#1 (n=5 pTECs) and (H) HBMEC at baseline and after conditioning. (I) High-throughput CAM quantification in 5 normal brains, 93 GBM, and 25 MB, each examined twice. Each data-point is an average of MFI acquired from 15 confocal CD31(+)-gated vascular-patterned hpf and segmented by channel-specific intensity thresholding per tumor. Data represented in G-I as Mean±SD; ANOVA with Tukey’s correction; **P<0.01, ***P<0.001.
Figure 2 │
Figure 2 │. Rational-engineering of the Homing System (HS).
(A) Cartoon outlining the ALCAM binding-region on CD6, (B) prototype HS-molecule, (C) multimerized exodomains and (D) tailless HSΔ-molecules lacking signaling-domains. (E) Specific binding to soluble ALCAM; assessed independently 10x with similar results. (F) PLA identifying D3/ALCAM heterodimers in T-cell/endothelium-conjugates. 83–103 cell-conjugates analyzed per condition; repeated 3x independently with similar results. TSR=Total Signals-per-Region. (G-J) TEM kinetics of 1×10⁶ cells/condition in microfluidic channels under 1–3dyne/cm2 shear over ALCAM+ pTEC. (K) Transmigration of 2×10⁵ T-cells per well through pTEC cBBB and the effect of soluble ALCAM blockade and washing. Yellow bars show the effect of ALCAM-siRNA knockdown on the permissivity of EC. Three experiments independently performed in triplicates with similar results. All data represented as Mean±SD. P-values represented as *P<0.05, **P<0.01, ***P<0.001. One-way ANOVA then Dunnett’s test for multiple-comparisons (compared to NT).
Figure 3 │
Figure 3 │. Signaling events downstream of HS-molecules.
(A) Confocal-IFC images after 5×10⁴ T-cells land on an ALCAM-coated glass-surface, showing micro-clusters of SLP-76 (red) and eGFP-tagged HS and HSΔ T-cells (green). Scale-bar=50μm. (B-C) Intracellular flow-cytometry for (B) pZAP70, Talin-1 and surface staining for unfolded LFA-1 using KIM127, monoclonal-antibodies that bind exclusively to the extended β2-chain (CD18), before and after transmigration of 2×10⁵ T-cells through an ALCAM+ cBBB-model. (D) Confocal-images of the transmigratory-cup at the HS T-cell/ EC interface co-stained for Talin-1 (blue), ICAM1 (green) and unfolded LFA-1 (red). Data represented as Mean ±SD, 4 independent experiments with similar results. P=0.774. Man-Whitney test; ns, not significant. (E) Cartoon depicting the HS-signaling events culminating in unfolding of LFA-1.
Figure 4 │
Figure 4 │. Cytoskeletal changes mediated by HS-signaling.
(A) Representative TIRF-micrographs of HS.eGFP T-cells upon landing on an ALCAM-coated glass surface, correlated with Actin in (B), Pearson coefficient=0.8. Scale-bar=10μm. Comparison of (C) Actin- and (D) FAK- MFI among HS- and HSΔ- T-cells. (E) Representative SIM-images depicting HS T-cell membrane ruffles. (F) The MATLAB® script used to analyze DM data of podosynaptic protrusions and their spread in 2×10⁶ HS T-cells. (G) Characterization of migrating T-cells through collective quantification of Actin-MFI, focal adhesions, area of spreading, and podosynapse formation by high-throughput DM at HS/ALCAM interface in a representative donor (n=200–800 cells/condition). All assessments independently repeated 3 times with similar results. Data represented as Mean ±SD, ***P<0.001. Tukey’s test used in panels C and D; Student’s t-test used in panel G.
Figure 5 │
Figure 5 │. Homing of HS T-cells to brain tumors.
(A) eGFP-labeled T-cells were injected intravenously in orthotopic tumor bearing mice. (B) Flow-cytometry analyzing TILs in GBM-explants (n=5 mice/group). (C) BLI of T-cells after intravenous-injection in GBM (quantified in D) and MB (E, quantified in F). Data represented as Mean±SD (n=5 mice/group) **P=0.001, ***P<0.0001. ANOVA with Tukey’s correction. (G) Iso-surface 3D-rendering of tumor-explant confocal-images showing eGFP.HS T-cells relative to ALCAM+ vessels (red). Cryo-sections imaged at 40x, 50μm z-stacks, bar =50μm. (H) Quantification of GFP+ T-cells in and around the ALCAM+ (red) signal indicating perivascular and intravascular locations, respectively. Error bars mean±SD (n=4 explants) **p=0.0015, ***p <0.0001. 2-tailed t-test. Dynamics of T-cell homing: (I) Snapshot image taken at 15 seconds of Supplemental Video-M2 showing rolling (arrow), adherent (dashed-arrow) 5HS T-cells inside the blood vessels, and a 5HS T-cell extravasating (arrow-head) into a U87-GBM tumor. Green, T-cells; Red, TAMRA-dextran (blood vessels). Scale-bar 100μm. (J and K) Quantification of rolling or adherent T-cells in U87-GBM vasculature. n=3 mice/group. Data represent mean ±SEM. *p< 0.05, 2-tailed t-test. P= 0.0219 and 0.0033. (L) Time-lapse 3D-reconstructed images showing extravasation of T-cells. Green, T-cells; Red, TAMRA-dextran (blood vessels). Scale bar 100μm
Figure 6 │
Figure 6 │. Anti-tumor activity of cytotoxic HS T-cells.
(A) Cartoon depicting experiment. (B) 51Cr-cytotoxicity assessing the cytolytic activity of HS T-cells at indicated E:T ratio against 5×10³ targets; (B) HER2+ U87-GBM, (C) human- and murine-ECs, and (D) ALCAM-expressing leukocytes. THP-1, human monocytic cells. PMBC, peripheral blood mononuclear cells. Mean of triplicate ±SD; ***P=<0.001, one-way ANOVA with posthoc-Tukey’s. Three experiments from 3 donors done with similar results. (E) BLI of tumors (n=5–10 mice/group) after intravenous injection of T-cells indicated by arrow; quantified in (F). (G) Flow-cytometry quantifying TILs in explants. Error-bars are Mean±SD. Four experiments done with similar results, P<0.001. Tukey’s test. (H) Kaplan–Meier survival probability analyzed by Log-Rank test, ***P=0.00034. (I) Cartoon summarizing how the HS-platform transforms the obstructive cancer-endothelium into a selectively permissive inflammatory-like one, allowing for enhanced targeted-delivery of T-cells.

Comment in

References

    1. Davenport MP, Grimm MC, and Lloyd AR, A homing selection hypothesis for T-cell trafficking. Immunology Today. 21(7): p. 315–317. - PubMed
    1. Krummel MF, Bartumeus F, and Gerard A, T-cell migration, search strategies and mechanisms. Nat Rev Immunol, 2016. 16(3): p. 193–201. - PMC - PubMed
    1. Carrithers MD, et al. , Differential adhesion molecule requirements for immune surveillance and inflammatory recruitment. Brain, 2000. 123 ( Pt 6): p. 1092–101. - PubMed
    1. Arima Y, et al. , Regulation of Immune Cell Infiltration into the CNS by Regional Neural Inputs Explained by the Gate Theory. Mediators of Inflammation, 2013. 2013: p. 8. - PMC - PubMed
    1. Sackstein R, Schatton T, and Barthel SR, T-lymphocyte homing: an underappreciated yet critical hurdle for successful cancer immunotherapy. Lab Invest, 2017. 97(6): p. 669–697. - PMC - PubMed

Publication types