. 2018 Sep;561(7723):338-342.
doi: 10.1038/s41586-018-0492-5. Epub 2018 Sep 5.

Extensive sex differences at the initiation of genetic recombination

Affiliations

Extensive sex differences at the initiation of genetic recombination

Kevin Brick et al. Nature. 2018 Sep.

Abstract

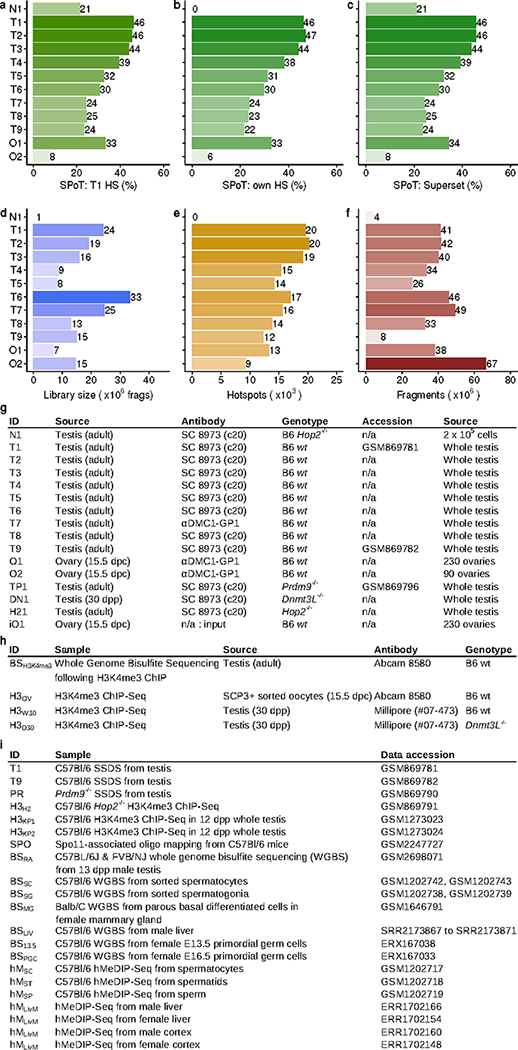
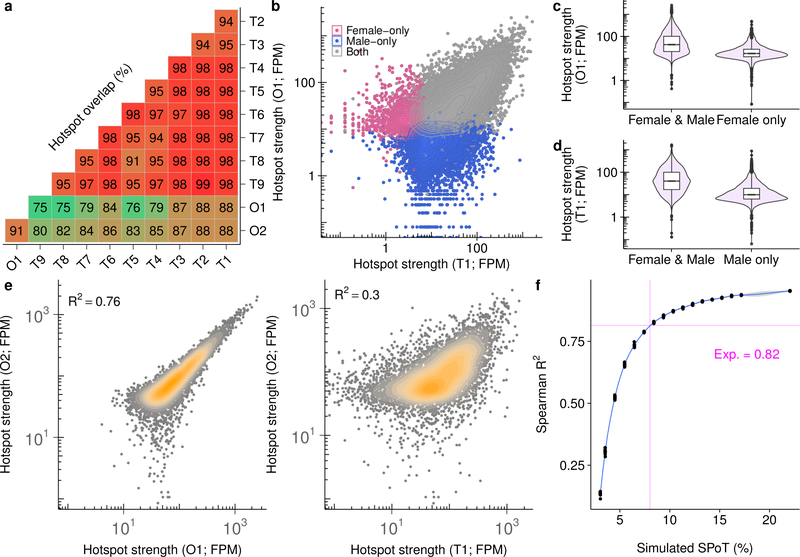
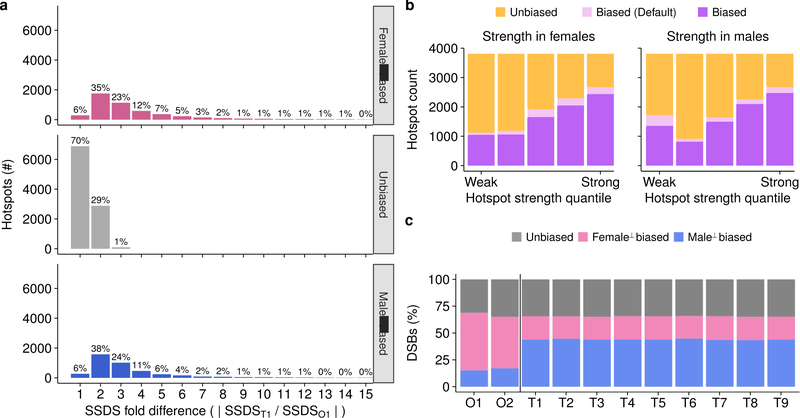
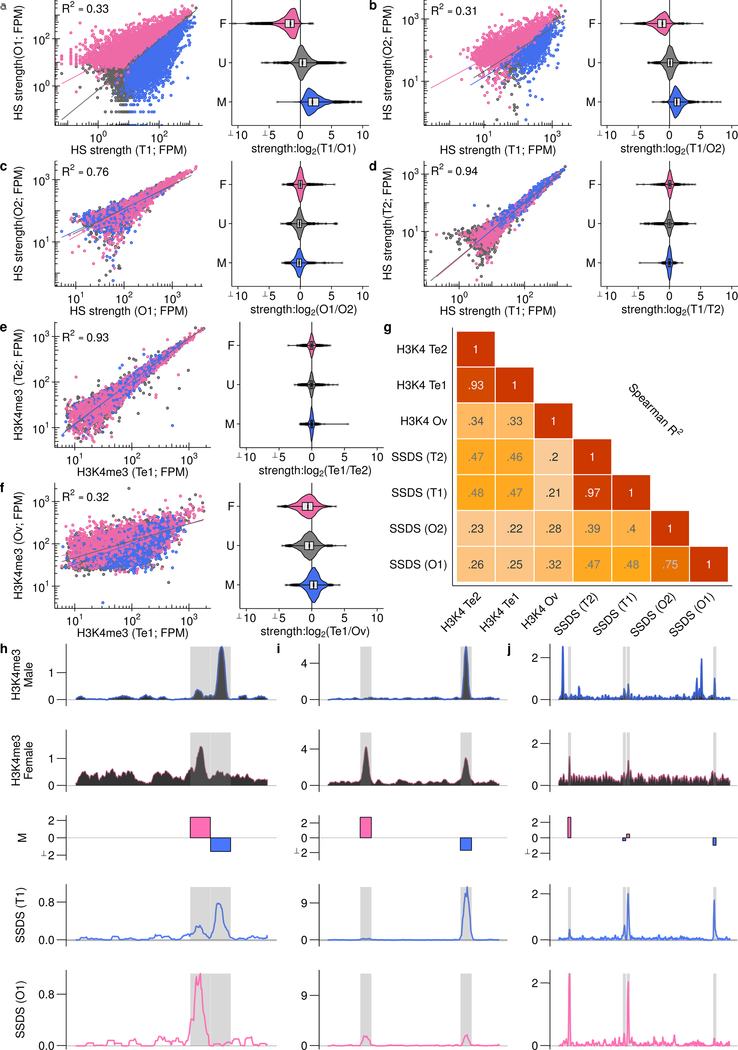
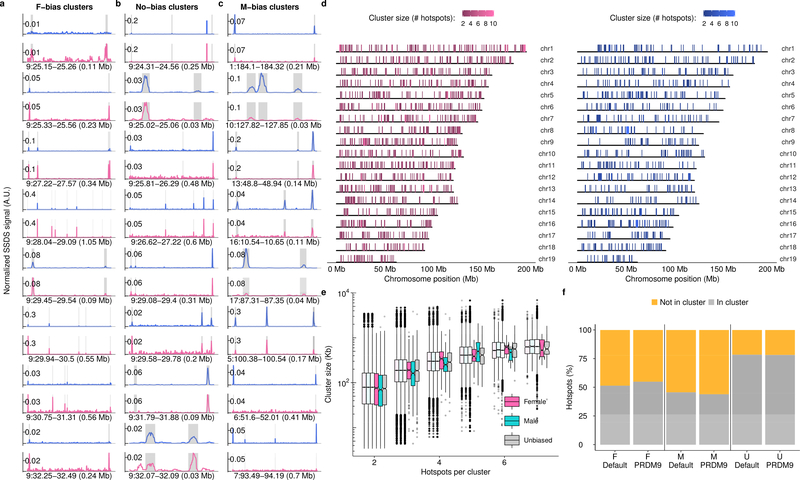
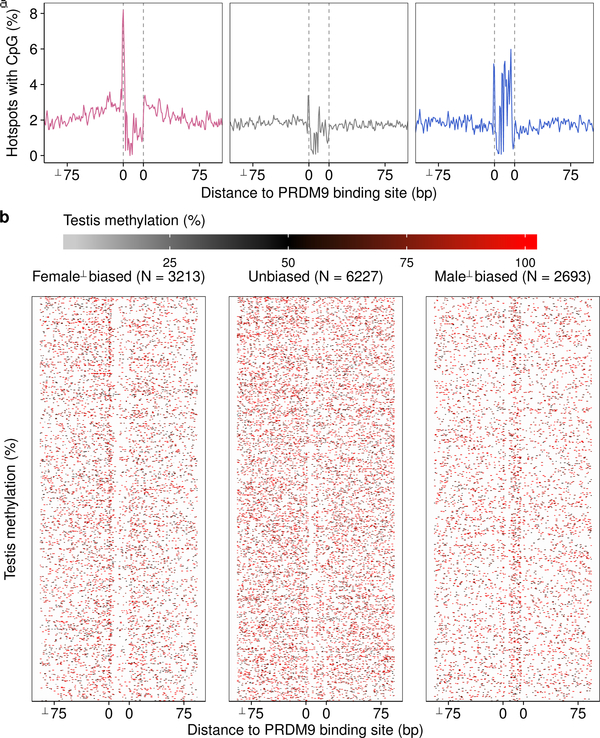
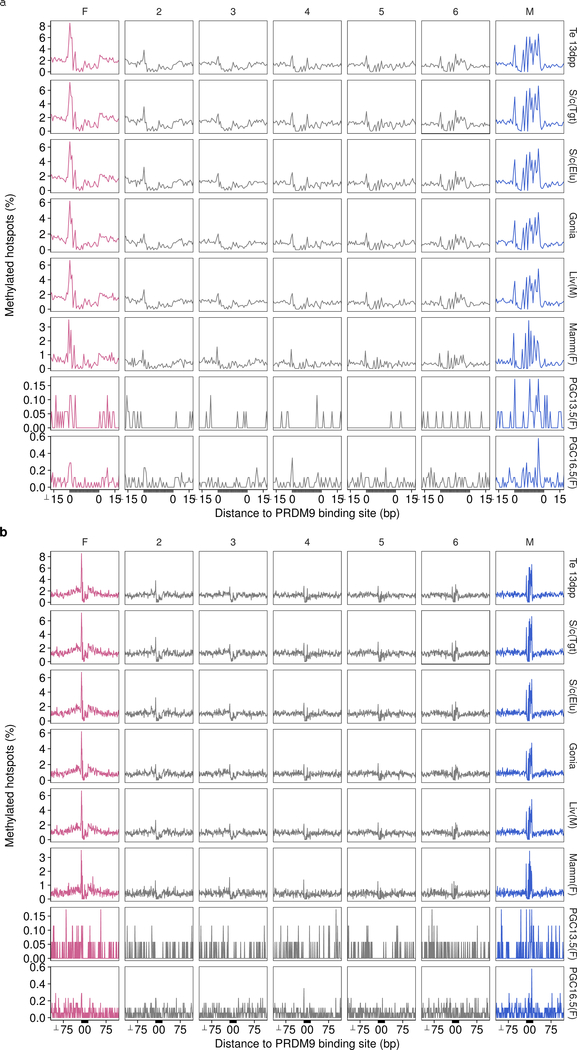
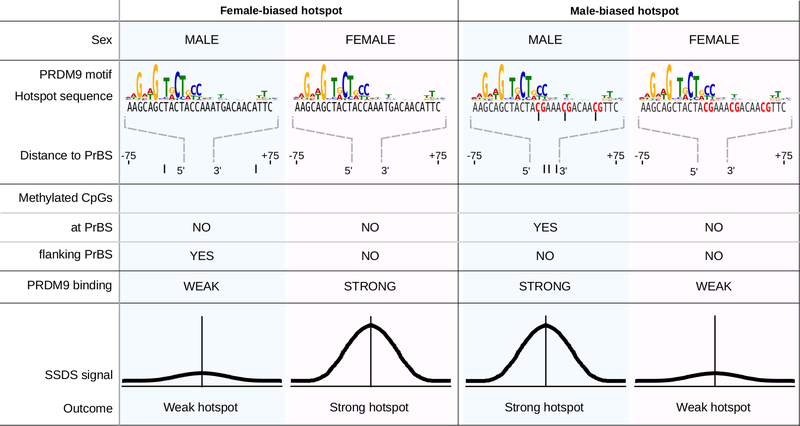
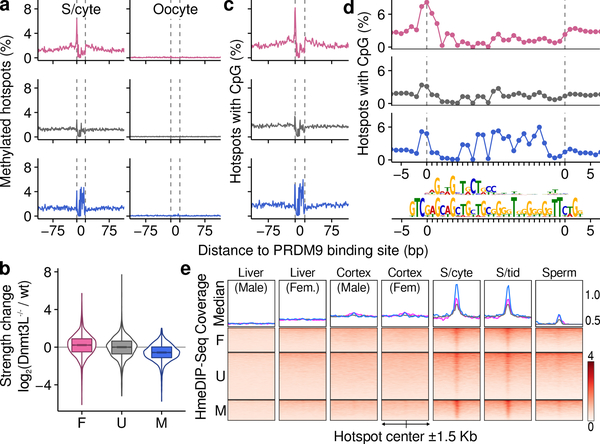
Meiotic recombination differs between males and females; however, when and how these differences are established is unknown. Here we identify extensive sex differences at the initiation of recombination by mapping hotspots of meiotic DNA double-strand breaks in male and female mice. Contrary to past findings in humans, few hotspots are used uniquely in either sex. Instead, grossly different recombination landscapes result from up to fifteen-fold differences in hotspot usage between males and females. Indeed, most recombination occurs at sex-biased hotspots. Sex-biased hotspots seem to be partly determined by chromosome structure, and DNA methylation, which is absent in females at the onset of meiosis, has a substantial role. Sex differences are also evident later in meiosis as the rate at which meiotic breaks are repaired as crossovers differs between males and females in distal regions. The suppression of distal crossovers may help to minimize age-related aneuploidy that arises owing to cohesion loss during dictyate arrest in females.


Conflict of interest statement

The authors declare no conflicts of interest.

Figures

Extended Data Fig 1:
Extended Data Fig 1:. Sample details and quality metrics for DSB maps
The fraction of reads in peaks is calculated for all samples at a, hotspots identified in the T1 sample. Sample identifiers are in panel g. b, Hotspots identified in each respective sample or c, hotspots in the combined T1/O1 superset. Peak calling was not performed for N1 (see Methods). d, The estimated library size (x) was inferred using bisection root finding for f(x) = (1-NNR/x)-exp(NTOT/x), 104 <= x <= 1012; NNR = # unique fragments; NTOT = # total fragments. e, The number of hotspots identified in each sample. f, The number of ssDNA fragments sequenced for each sample. g, Details of SSDS samples. Sample N1 was generated from Hop2−/− mice using 2 × 10⁵ cells. This sample was run in single-end mode, and not processed through the ssDNA pipeline. Previously published samples are referenced by GEO accession number. Note that the use of the SC8973 (c20) and αDMC1-GP1 antibodies gave indistinguishable SSDS results in males (Figure 2C, Extended Data Figure 2A). h, Details of samples from H3K4me3 ChIP-Seq. i, Details of publicly available datasets used.
Extended Data Fig 2:
Extended Data Fig 2:. Most DSB hotspots are used in both male and female meiosis
a, The maximum reciprocal overlap between hotspots in each sample was calculated using the central ± 200 bp of hotspots. b, Hotspots exclusively found in either sex are weak. Hotspots were split into those found in both O1 and T1 (both; grey), O1 but not T1 (Female-only; pink) and T1 but not O1 (Male-only; blue). c, Female-only hotspots are weak in females, relative to shared hotspots. d, Male-only hotspots are weak in males, relative to shared hotspots. e, The O2 SSDS correlates better with hotspot strength in ovary (O1) than in testis (T1). Only hotspots that are detected in both samples are shown for each comparison. Note that the correlation between hotspot strength in ovary samples (Spearman R2O2O1 = 0.76) is not as high as that between replicates of SSDS in males (minimum R2 ≥0.9; Fig 2). f, Noise in SSDS estimates can fully explain this diminished correlation between ovary-derived SSDS maps. We generated a series of down-sampled O1 SSDS datasets to test if reducing the SPoT would reduce the maximum possible R2. For each simulated dataset, signal reads were randomly chosen from the uniquely mapping in-hotspot ssDNA fragments of the O1 DMC1 SSDS sample. Background fragments were randomly chosen from all uniquely mapping ssDNA fragments of the O1 input DNA SSDS sample. Samples at different SPoTs were then generated by varying the number of signal and background-derived reads (SPoT = signal/(signal+background)). The number of fragments was matched to the number of uniquely mapping fragments in O2. 10 replicate samples were generated for each SPoT, and the correlation coefficient (Spearman R2) with the original O1 SSDS sample was calculated. The magenta lines indicate the expected maximum R2 for a sample with a SPoT matching that of O2. The expected maximum R2 is very close to the observed R2. Thus, noise in SSDS estimates can reduce the R2 to within the observed range for a sample of this quality.
Extended Data Fig 3:
Extended Data Fig 3:. SSDS signal at hotspots is narrower in ovaries than in spermatocytes
a, SSDS coverage is a measure of DMC1-bound ssDNA either side of each meiotic DSB. In a population of meiocytes, DSBs will occur in a several hundred nucleotide window around the hotspot center (orange rectangle). To assess coverage, we first convert the position of each SSDS fragment into the distance along ssDNA from the hotspot center. Merging the top and bottom strand fragments in this way increases coverage two-fold and minimizes the influence of asymmetric gaps and fluctuations in coverage. Coverage at each hotspot was normalized by the maximum value at the hotspot to prevent strong hotspots from dominating the average profile. The average normalized coverage across all hotspots was then calculated. DSB hotspots identified in b, females (ovary sample O1) and c, males (testis sample T1) were each split into three bins by strength. Coverage was calculated for all nine male and two female samples for each set. The SSDS signal is narrower for all female samples compared to male samples. The difference is particularly pronounced at stronger hotspots, where coverage estimates are most accurate. At the widest point, the mean male and female profiles diverge by ~0.4 Kb. d, We also examined the MACS-determined hotspot boundaries to further negate the possibility that the average profiles in B-C are not a reflection of the population. By this metric, the mean hotspot width estimated from male samples (1,759 ± 73 bp; mean (solid blue line) ± SEM (dashed blue lines); n = 9) is significantly wider the mean width of hotspots in female samples (1,490 ± 89 bp; mean (solid pink line) ± SEM (dashed pink lines); n = 2) (t-test; P = 0.0007). Sequencing quality and sample SPoT can affect width estimates, therefore, we processed each sample as follows; we reduced the SPoT of each sample to that of the lowest quality sample (O2; see Methods), considering only uniquely mapping and high quality (Q >30) ssDNA type 1 fragments. We then reduced all samples to have the same number of fragments as the smallest. On these datasets, we performed peak calling and retained only DSB hotspots that were called in all samples (N = 1,975). e, Potential mechanistic explanations for the difference in SSDS signal between males and females. These differences may manifest in all meiocytes or in sub-populations. Importantly, we see no evidence of shape differences at hotspots in sub-populations of spermatocytes (data not shown).
Extended Data Fig 4:
Extended Data Fig 4:. Most meiotic DSBs occur at sex-biased hotspots
a, Quantification of SSDS fold change at sex biased and unbiased hotspots. The percentages show the percentage of hotspots in each category with a given absolute fold-change. b, The hotspots in the testis/ovary super set were split into quintiles by strength in either females (left panel) or males (right panel). In both sexes, over 60% of the strongest hotspot subset exhibit sex-biased DSB formation. This is a proxy for the true amount of sex-biased DSB formation. In progressively weaker hotspot sets, fewer biased hotspots are detected. One outlier is the set of weak male hotspots. This set contains many female-biased default hotspots that form independently of PRDM9. c, We quantified the total in-hotspot SSDS signal at female-biased, unbiased and male-biased hotspots in the two ovary-derived samples and in the nine testis samples. In all cases, over half of the in-hotspot sequencing tags (referred to as total DSBs) occur at sex-biased hotspots. Hotspots biased towards usage in females are enriched in ovary samples, while those biased towards male usage are enriched in testis-derived samples.
Extended Data Fig 5:
Extended Data Fig 5:. Sex biased hotspots are consistent across replicates and are defined before DSB formation
Hotspot strength was calculated at all autosomal hotspots from the merged O1/T1 DSB maps. The strength of hotspots was re-calculated in two testis (T1, T2) and two ovary (O1, O2) maps. Female-biased (pink), unbiased (grey) and male-biased hotspots (blue) were determined by comparing the T1 and O1 maps. These hotspots are colored the same in all panels. a, Sex-biased hotspots are distributed as expected when comparing the O1 and T1 DSB maps. These data are also plotted in Fig. 2d,e. b, Sex-biased hotspots exhibit the same sex-biases in the O2 sample. c,d, Sex-biased hotspots exhibit no biased usage between samples derived from mice of the same sex. e-g, Sex biases that precede DSB formation were studied by performing H3K4me3 ChIP-Seq in fluorescence assisted cell sorting (FACS)-purified fetal oocytes at 15.5 dpc (see Methods). The H3K4me3 signal at hotspots was quantified and compared to existing maps of H3K4me3 in juvenile mouse testis68. e, The H3K4me3 signal at hotspots is tightly correlated in replicate samples from mouse testis (H3KP1, H3KP2; (Extended Data Fig 1i). f, Akin to what we observe when examining the SSDS signal at DSB hotspots, there is extensive variation in the H3K4me3 signal at hotspots between male and female meiosis. This implies that sex biases are established before DSB formation. Sex biases determined using SSDS remain broadly conserved when we compare H3K4me3 in females to males. g, H3K4me3 at hotspots is better correlated with SSDS from the respective sex. h-j, Sex biases in H3K4me3 ChIP-Seq parallel differences in SSDS signal. H3K4me3 ChIP-Seq coverage is shown in upper panels; Testis (H3KP1; blue) and Ovary (H3OV; pink). The middle panel shows the log2 fold difference (M) between the SSDS signal in testis (T1) and ovary (O1). SSDS coverage for these samples is shown in the lower panels. Grey boxes represent DSB hotspot positions. To allow for quantitative cross comparison, the coverage in each sample is normalized by median signal strength at DSB hotspots in that sample. The genomic coordinates of each window are given underneath.
Extended Data Fig 6:
Extended Data Fig 6:. Clustering of sex-biased hotspots
a,b,c, SSDS coverage at a subset of biased hotspot clusters. The a, female-biased and b, unbiased clusters are those shown in Fig 3a. c, Since no male-biased clusters are depicted in Fig 3a, eight clusters were randomly chosen. Testis (T1; blue) and ovary (O1; pink) SSDS coverage are shown for each cluster. To allow for quantitative cross comparison, coverage in each sample is normalized by the median hotspot strength. Grey boxes represent DSB hotspot positions. d, Genomic patterning of sex-biased DSB hotspots. Female-biased (left; pink) and Male-biased (right; blue) hotspot clusters on all autosomes. Biased hotspots do not exhibit particular spatial patterning, aside from a slight enrichment of female-biased hotspots at the q-Arm telomere. e, The physical size of hotspot clusters scales with the number of hotspots per cluster. It therefore seems unlikely that clustering results from a physical size constraint imposed by sex-specific chromatin structure. Importantly however, the presence of such a size constraint may be masked by the presence of a large number of clusters that occur by chance. Semi-transparent boxplots show the expected size distribution for randomly distributed clusters (n = 1,000 bootstraps). Clusters of three male-biased hotspots are marginally smaller than expected. There are no significant differences for clusters of other sizes. f, Similar proportions of PRDM9-defined and default hotspots occur in clusters. Hotspots in clusters of ≥ 2 consecutive hotspots of the same type were counted.
Extended Data Fig 7:
Extended Data Fig 7:. Differing patterns of DNA methylation at sex-biased hotspots
a, Mean DNA methylation at the putative PrBS (grey bar) of female-biased (pink), unbiased (grey) and male-biased (blue) hotspots. Note that this panel is also shown in Fig 4a. b, Heatmap rows depict methylation at individual hotspots. Note that the density of methylation appears higher at unbiased hotspots because rows are more densely spaced.
Extended Data Fig 8:
Extended Data Fig 8:. DNA methylation at PrBSs is present across tissues and absent in the female germ line
The pattern of DNA methylation is very similar across cell types and between the sexes. Hotspots are split by the magnitude of sex bias (SSDSO1/SSDST1) into seven sets. Sets are ranked from most female-biased (pink; left) to most male-biased (blue; right) by fold-change. Methylation signal is binarized such that methylation > 0% is considered methylated. Thus, the proportion of all hotspots with methylated cytosine at each position is shown. Variations in the magnitude of the signal may be expected for technical reasons. Plots are anchored by the C57Bl6 PrBS (grey area). Only hotspots with a single PRDM9 binding site are used (see Methods). a, Plot of ± 100 bp to show methylation flanking the PrBS for female-biased hotspots. b, Plot of ± 15 bp to show methylation at the PrBS for male-biased hotspots. Methylation data are from whole genome bisulfite sequencing (WGBS) in tissue derived from whole testis in 13dpp mice (Te 13 dpp), from WGBS following H3K4me3 CHiP-Seq in whole adult testis (S/c(Tgt)); Extended Data Fig 1h), from WGBS in elutriated spermatocytes (S/c(Elu)), from WGBS in spermatogonia (Gonia), from WGBS in tissue from male liver (Liv(M)), from WGBS in tissue from female parous basal differentiated mammary gland cells (Mamm(F)) and from WGBS in sorted primordial germ cells at 13.5 dpc (PGC13.5(F)) and at 16.5 dpc (PGC16.5(F)). WGBS in female PGCs captures the methylation status of the genome in oocytes during meiosis. 13.5 dpc and 16.5 dpc likely represent earlier and later meiotic prophase I populations, respectively.
Extended Data Fig 9:
Extended Data Fig 9:. Dual role of DNA methylation at hotspots in defining sex biases
DNA methylation has a dual role in modulating sex-biased DSB formation. (Left panels) At female-biased hotspots, DNA methylation in the region flanking the PrBS can suppress PRDM9 binding. Thus, in males, the use of these PrBS is reduced, resulting in a female-biased hotpsot. Methylated CpG dinucleotides (in males) are schematically shown as filled black circles. (Right panels) At male-biased hotspots, DNA methylation at CpGs appears to favor PRDM9 binding and DSB formation. This results in a relatively strong DSB hotspot in males, but a relatively weak hotspot in females, where DNA methylation at these sites is absent.
Extended Data Fig 10:
Extended Data Fig 10:. Hotspot strength variation in Dnmt3L−/− mice
(A,B) CpG methylation is partly reduced at PRDM9 binding sites in mice lacking functional DNMT3L. We compared WGBS data from Dnmt3LA/A (A/A) and matched wild-type (wt) mice. The ± 100-bp region around the PRDM9 binding sites was examined. Hotspots were split either by (A,C,E) sex-bias (female-biased, F, pink; unbiased, U, grey; male-biased, M, blue) or (B,D,F) into quintiles by the fold change between the O1 and T1 SSDS samples (most female-biased, F on left to most male-biased, M on right). The percentage decrease in the mean DNA methylation signal in Dnmt3LA/A mice for each set is given in the sub-panel title. DNA methylation is reduced 5–7%. (C-F) The usage of sex-biased hotspots is altered in mice where DNA methylation is reduced (Dnmt3L−/−). (C) The log2 fold change between the tags per million normalized signal at hotspots in Dnmt3L−/− and wt (T1) male mice is shown (left panels). To control for spermatocyte population changes resulting from meiotic arrest, in the right-hand panels, we compare to experiments in Hop2−/− males instead of wt. HOP2 is essential for stabilizing recombination intermediates and mice lacking functional HOP2 exhibit spermatogenic arrest after DSB formation. Hotspots overlapping gene promoters or default hotspots are excluded as the non-PRDM9 derived H3K4me3 signal would confound these analyses. Furthermore, only hotspots detected in all samples being compared were analysed to remove spurious potential background correlation (C-F; Nhotspots = 9,137). P-values for all comparisons are shown above the data (Wilcoxon test). (C) The SSDS signal at female-biased hotspots is significantly increased in Dnmt3L−/− mice compared to male-biased hotspots or unbiased hotspots. The strength of male-biased hotspots is relatively decreased. (D) This is also seen when we simply split hotspots by fold change. (E) H3K4me3 at female-biased hotspots is significantly increased in Dnmt3L−/− mice compared to male-biased hotspots. H3K4me3 signal at each hotspot was calculated as the sum of overlapping H3K4me3 peak strengths. This is a proxy for DSB hotspot strength, because PRDM9 trimethylates histone H4 lysine 3 before DSB formation. (F) This is more apparent when we split hotspots into quintiles by sex-bias, likely because H3K4me3 at hotspots is a weak signal.
Fig 1.
Fig 1.
Detectable meiotic DSB hotspots in females. a, Ovary(pink) and testis(blue) DSB maps. b, SSDS coverage (3’ distance to center) at hotspots (HS) is narrower in females (maximum difference (X) is ~400 bp). c,d, PAR SSDS signal (green) is enriched in males, but not females. c, Coverage normalized by total chrX SSDS. d, Fold-change = PAR SSDS / (mean SSDS of chrX 50 Kb intervals). The PAR SSDS signal is elevated (3–5×) in controls (Input & IgG) because of unassembled repetitive DNA. e,f, Hotspots on chrX (orange) appear stronger in males (grey = autosomal). FPM = SSDS fragments per million.
Fig 2.
Fig 2.
Extensive sex differences in DSB hotspot usage. a-c, Hotspot strength is consistent between replicates from the same sex, c,d, but differs between males and females. a-c, Only hotspots called in both maps are considered. d, Strength differs between males and females (female-biased (pink), unbiased (grey) and male-biased hotspots (blue)). e, Sex biases are consistent in replicate ovary maps. Curves show LOESS smoothing for each sample. f, Default hotspots are used more frequently in females (O1 = pink, O2 = red, T1–9 = blue). Overlaps counted in 250-hotspot bins. g, More DSBs occur at default hotspots in females.
Fig 3.
Fig 3.
Large-scale influences on sex-biased recombination. a,b, Sex-biased hotspots cluster more than expected (empirical P <0.001 (*); see Methods; error bars = ± 99.9% bootstrapped CI) b, Grey = median of 10,000 bootstraps; error bars: ± 99.9% CI; Obs = Observed. c, Clusters of female-biased hotspots (horizontal lines below hotspots). d, SSDS decreases in males (blue) relative to females (pink) adjacent to the q-arm telomere. e, COs increase in males in this region. f, Sex dimorphism in the CO:SSDS ratio. Profiles use 1 Mb non-overlapping windows. We focus on the q-arm because unassembled centromeric DNA abuts the p-arm telomere in mice.
Fig 4.
Fig 4.
Sex-dimorphic DNA methylation at sex-biased hotspots. Female-biased (pink), unbiased (grey) and male-biased (blue). a, Average per base methylation from 13 dpp testis (spermatocytes (S/cyte); left) or 16.5 dpc primordial germ cells (oocyte; right). b, Sex-biased hotspots are altered in Dnmt3L−/− males. Female-biased hotspots strengthen (P = 10−123, Wilcoxon test) and male-biased hotspots weaken (P = 10−28, Wilcoxon test) relative to unbiased hotspots. c, DNA methylation mirrors CpG content. d, CpG density at inferred PrBS (upper motif). In silico predicted PrBS shown below. e, hMeDIP-Seq at DSB hotspots; data from liver & cortex, spermatocytes (S/cyte), spermatids (S/tids) and sperm.

References

    1. Lenormand T, Engelstädter J, Johnston SE, Wijnker E & Haag CR Evolutionary mysteries in meiosis. Philos. Trans. R. Soc. Lond. B Biol. Sci 371, 20160001 (2016). - PMC - PubMed
    1. Tortereau F et al. A high density recombination map of the pig reveals a correlation between sex-specific recombination and GC content. BMC Genomics 13, 586 (2012). - PMC - PubMed
    1. Khil PP, Smagulova F, Brick KM, Camerini-Otero RD & Petukhova GV Sensitive mapping of recombination hotspots using sequencing-based detection of ssDNA. Genome Res. 22, 957–965 (2012). - PMC - PubMed
    1. Brick K, Smagulova F, Khil P, Camerini-Otero RD & Petukhova GV Genetic recombination is directed away from functional genomic elements in mice. Nature 485, 642–645 (2012). - PMC - PubMed
    1. Smagulova F, Brick K, Pu Y, Camerini-Otero RD & Petukhova GV The evolutionary turnover of recombination hot spots contributes to speciation in mice. Genes Dev. 30, 266–280 (2016). - PMC - PubMed

Publication types