. 2018 Sep;561(7723):401-405.
doi: 10.1038/s41586-018-0479-2. Epub 2018 Sep 5.

A fluid-to-solid jamming transition underlies vertebrate body axis elongation

Affiliations

A fluid-to-solid jamming transition underlies vertebrate body axis elongation

Alessandro Mongera et al. Nature. 2018 Sep.

Abstract

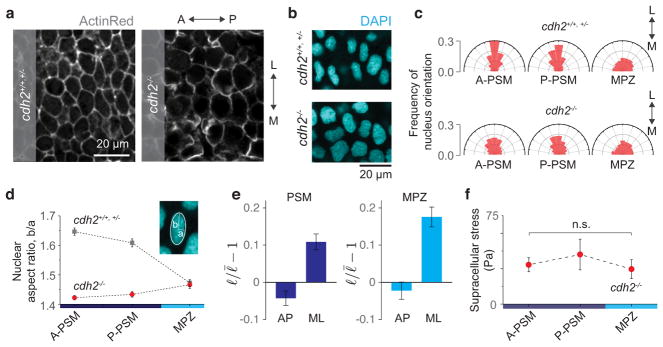
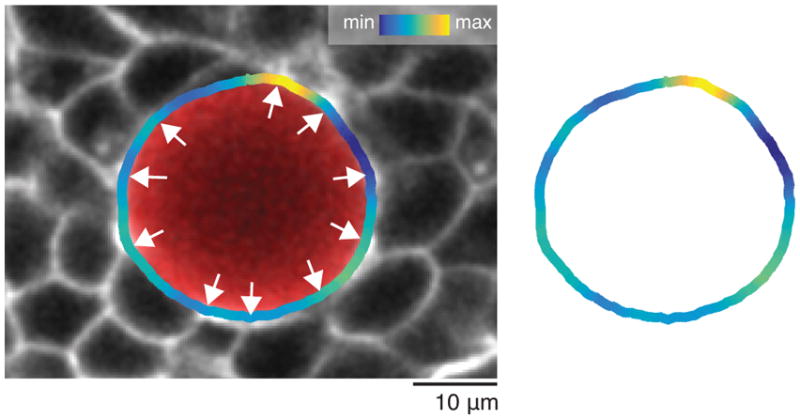
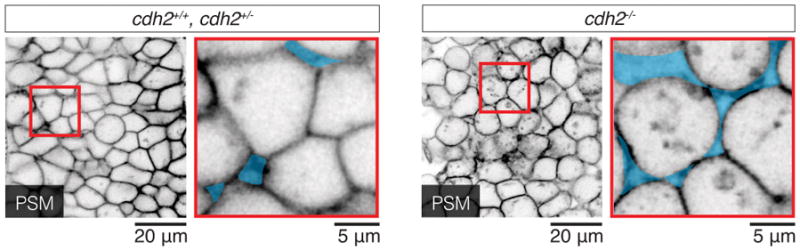
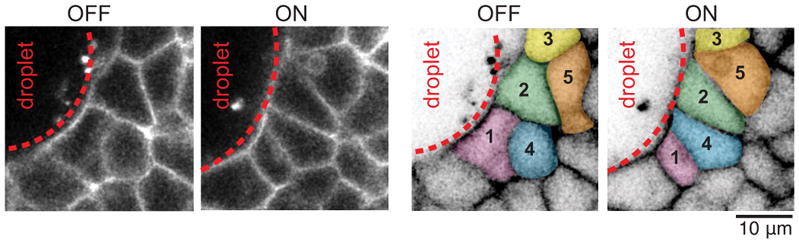
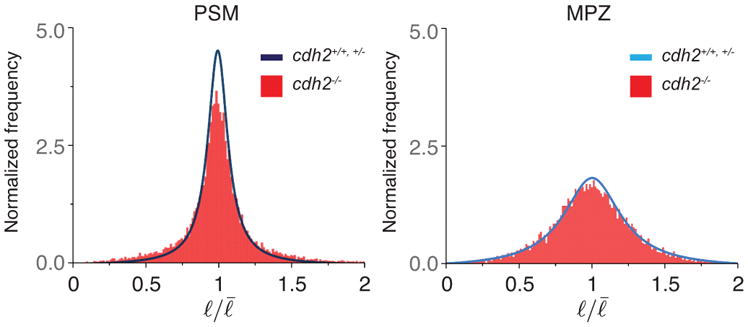
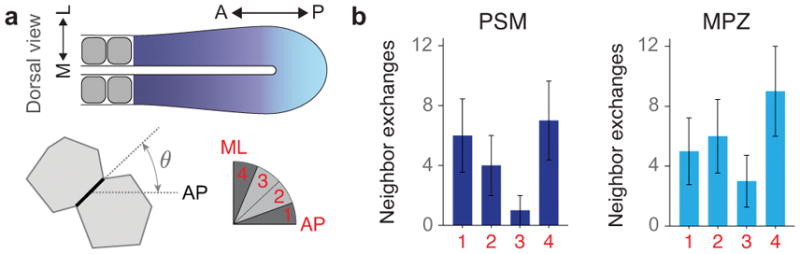
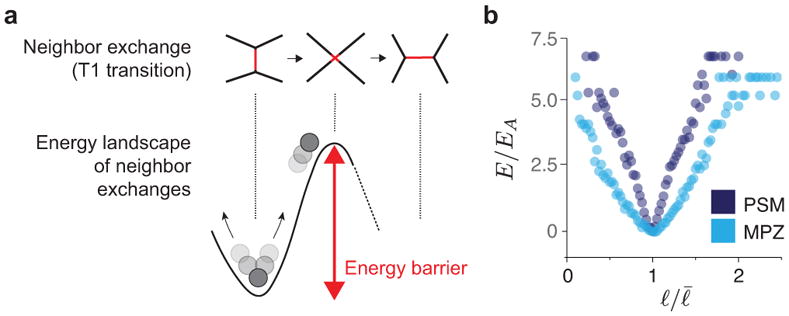
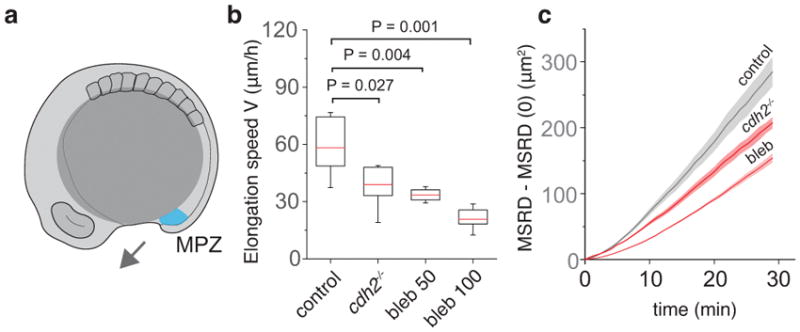
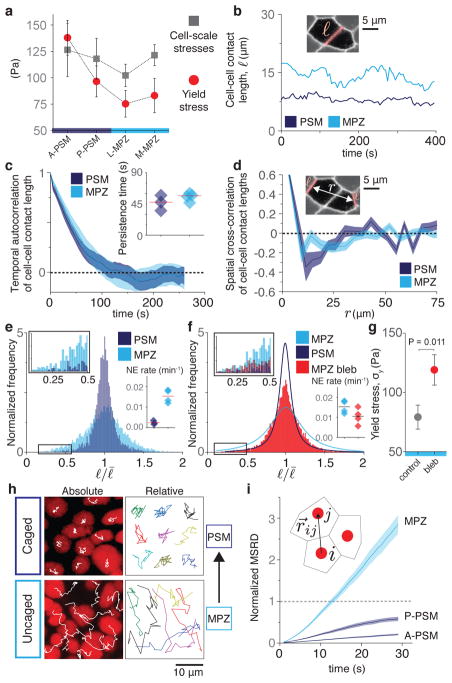
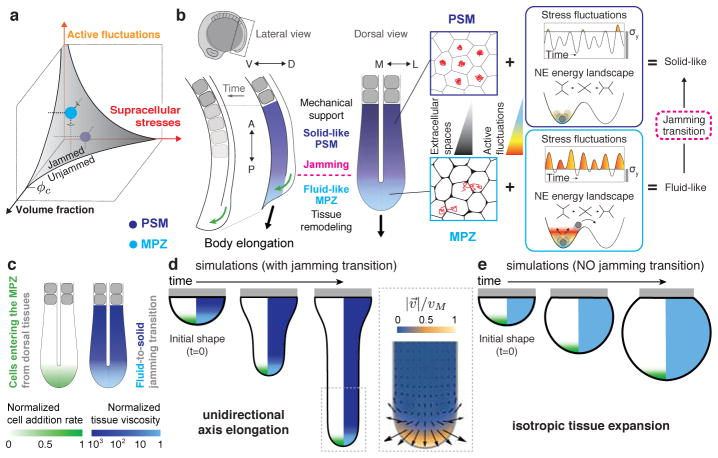
Just as in clay moulding or glass blowing, physically sculpting biological structures requires the constituent material to locally flow like a fluid while maintaining overall mechanical integrity like a solid. Disordered soft materials, such as foams, emulsions and colloidal suspensions, switch from fluid-like to solid-like behaviours at a jamming transition1-4. Similarly, cell collectives have been shown to display glassy dynamics in 2D and 3D5,6 and jamming in cultured epithelial monolayers7,8, behaviours recently predicted theoretically9-11 and proposed to influence asthma pathobiology8 and tumour progression12. However, little is known about whether these seemingly universal behaviours occur in vivo13 and, specifically, whether they play any functional part during embryonic morphogenesis. Here, by combining direct in vivo measurements of tissue mechanics with analysis of cellular dynamics, we show that during vertebrate body axis elongation, posterior tissues undergo a jamming transition from a fluid-like behaviour at the extending end, the mesodermal progenitor zone, to a solid-like behaviour in the presomitic mesoderm. We uncover an anteroposterior, N-cadherin-dependent gradient in yield stress that provides increasing mechanical integrity to the presomitic mesoderm, consistent with the tissue transiting from a wetter to a dryer foam-like architecture. Our results show that cell-scale stresses fluctuate rapidly (within about 1 min), enabling cell rearrangements and effectively 'melting' the tissue at the growing end. Persistent (more than 0.5 h) stresses at supracellular scales, rather than cell-scale stresses, guide morphogenetic flows in fluid-like tissue regions. Unidirectional axis extension is sustained by the reported rigidification of the presomitic mesoderm, which mechanically supports posterior, fluid-like tissues during remodelling before their maturation. The spatiotemporal control of fluid-like and solid-like tissue states may represent a generic physical mechanism of embryonic morphogenesis.


Conflict of interest statement

The authors declare no competing financial interests.

Figures

Extended Data Figure 1
Loss of AP gradients of supracellular stresses and cell and nuclear shape anisotropy in N-cadherin mutants. a, ActinRed staining of F-actin in the PSM of control (cdh2+/+, +/−) and mutant (cdh2−/−) embryos at the 10-somite stage. Cell shapes are visibly elongated along the mediolateral (ML) direction in control (cdh2+/+, +/−) embryos. Cell shape anisotropy is largely lost in cdh2−/− embryos. b, DAPI staining showing higher nuclear ML elongation in the PSM of control embryos compared to cdh2 mutants. c, Frequency of nuclear major axis orientations in the MPZ and PSM (A-PSM and P-PSM). In control embryos (cdh2+/+, +/−), nuclei in the PSM are elongated along the mediolateral direction, whereas nuclei are oriented randomly in the MPZ. The observed nuclear anisotropy along the ML direction in the PSM of control embryos is decreased in cdh2 mutants (cdh2−/−). For cdh2+/+, +/−: n=695 (A-PSM), n=752 (P-PSM) and n=732 (MPZ), obtained in 6 embryos per region. For cdh2−/−: n=833 in 5 embryos (A-PSM), n=538 in 6 embryos (P-PSM), n=336 in 4 embryos (MPZ). d, A posterior-to-anterior increase in the extent of nuclear elongation (quantified by the nuclear aspect ratio; see inset and Methods) is observed in control embryos (cdh2+/+, +/−). No AP gradient in the extent of nuclear elongation (aspect ratio) is observed in cdh2 mutants (cdh2−/−). For cdh2+/+, +/−: n=695 (A-PSM), n=752 (P-PSM) and n=732 (MPZ), obtained in 6 embryos per region. For cdh2−/−: n=833 in 5 embryos (A-PSM), n=538 in 6 embryos (P-PSM), n=336 in 4 embryos (MPZ). Mean ± SEM. e, Relative change of cell-cell contact length along the anterior-posterior (AP) axis and the medial-lateral (ML) axis (n=6427 and 4319 cell-cell contacts for PSM and MPZ from 5 embryos, respectively). Cell junctions are longer along the ML axis compared to the AP axis, both in the PSM and MPZ. Mean ± SEM. f, Supracellular stresses are uniform along the AP axis in cdh2 mutant embryos (n=5 for A-PSM, n=5 for P-PSM, and n=12 for MPZ). Mean ± SEM; Mann-Whitney test. The observed posterior-to-anterior increase in both supracellular stresses and nuclear elongation in control embryos (Fig. 1e and panel d), and the loss of both such gradients in cdh2 mutants (panels d and e), indicate the existence of a N-cadherin-dependent, posterior-to-anterior increase in supracellular stresses, consistent with a posterior-to-anterior increase in mediolateral constriction. Importantly, if the observed thinning of the body axis was caused by pulling forces from the MPZ on the PSM, as previously proposed, both cells and nuclei would be elongated along the AP axis.
Extended Data Figure 2
Curvature changes along the droplet contour correlate with the locations of cell-cell contacts surrounding the droplet. Confocal section of a ferrofluid droplet (red) in the MPZ of a Tg(actb2:MA-Citrine) embryo. The measured curvature values along the detected droplet contour are shown (color coded as in Fig. 1h) overlaid with the confocal image (left) and without it (right). White arrows point to locations of cell-cell contacts of cells surrounding the droplet, which correlate with maxima and minima of droplet curvature, consistent with the distance between maxima and minima being approximately the cell size (Fig. 1j).
Extended Data Figure 3
Increase of extracellular spaces and cell rounding in cdh2 mutants. 2D confocal sections (inverted) of WT and cdh2−/− Tg(actb2:MA-Citrine) embryos showing an increase in extracellular space (cyan), as well as more cell rounding, in the PSM tissue of the mutant embryos.
Extended Data Figure 4
Example of neighbor exchanges induced in the tissue upon droplet actuation with a magnetic field. Confocal section showing the spatial arrangements of cells in the neighborhood of a magnetically-responsive droplet both in the absence of magnetic field (OFF) and after applying a magnetic field (ON) for 15 minutes (left). Several cell rearrangements are observed to be induced by droplet actuation (right). Some of the cells undergoing neighbor exchanges are colored and numbered to highlight the rearrangements. Tg(actb2:MA-Citrine) embryos were used to visualize cell membranes.
Extended Data Figure 5
Distribution of cell-cell contact length fluctuations in cdh2 mutants. Normalized frequency (distribution) of cell-cell contact length fluctuations in the PSM and MPZ of cdh2 mutants (red bars) compared to the control (blue and light blue lines). For PSM and MPZ, n=13212 and 13634 cell-cell contacts obtained from 5 and 4 embryos, respectively.
Extended Data Figure 6
Orientation of neighbor exchanges in the MPZ and PSM. a, Sketch of a dorsal view of the elongating body axis, with the AP and ML directions defined (top). Sketch showing the orientation of a cell-cell contact (black thick line) before undergoing a neighbor exchange (bottom left). The angle θ corresponds to the angle between the cell-cell contact before undergoing the neighbor exchange and the AP axis (bottom). Four equal bins are defined (bin 1: 0 < θ < 22.5°; bin 2: 22.5° < θ < 45°; bin 3: 45° < θ < 67.5°; bin 4: 67.5° < θ < 90°) between the AP and ML orthogonal directions (bottom right). b, Frequency of neighbor exchanges along different angular regions (n=18 in 4 embryos for PSM and n=23 in 3 embryos for MPZ, with n being the number neighbor exchanges analyzed). Mean ± SD. Neighbor exchanges are largely randomly oriented in the MPZ. In the PSM, neighbor exchanges occur predominantly along either the mediolateral (ML) direction or along the AP axis, with neighbor exchanges occurring slightly less frequently for angles in between these orthogonal orientations. The more frequent occurrence of neighbor exchanges along the AP and ML axes in the PSM is consistent with the measured directions and extent of ellipsoidal droplet deformation (Fig. 1f), as the persistent and larger supracellular stresses in the PSM may bias neighbor exchanges in these directions. Since neighbor exchanges occur equally frequently along the ML and AP directions in the PSM, and are uniformly oriented in the MPZ, our results indicate no systematic alignment of neighbor exchanges along a single spatial direction that could potentially contribute to the elongation of the body axis.
Extended Data Figure 7
Energy landscape of neighbor exchanges. a, Schematic of key cellular configurations throughout a neighbor exchange and associated energy landscape. Changing neighbors requires overcoming an energy barrier. Large enough, active cell-cell contact length fluctuations enable neighbor exchanges. b, Measured energy landscape, E, for PSM and MPZ regions, normalized energy scale EA associated with cell-cell contact activity or effective temperature energy scale, namely EA = kBTEff, where kB is the Boltzmann constant and TEff is the effective temperature. n = 6969, 7896 cell-cell contacts obtained from 3, 4 embryos for PSM, MPZ, respectively.
Extended Data Figure 8
Dependence of posterior axis elongation speed and relative cellular movements in the MPZ on N-cadherin and non-muscle myosin-II activity. a, Sketch of a 10-somite stage embryo highlighting the mesodermal progenitor zone (MPZ, cyan) and the direction of posterior elongation (arrow). b, Comparison of posterior body elongation speeds between WT (n=6), cdh2 mutants (n=7), and blebbistatin-treated embryos (n=6 for 50 μM and n=7 for 100 μM). Box plots representing median (red line) and second and third quartiles. Error bars indicate 95% CI. Mann-Whitney test. c, Mean square relative displacement (MRSD; Methods) of cells in the MPZ region of WT (n = 2523 analyzed cell pairs from 6 embryos), cdh2−/− (n = 1154 analyzed cell pairs from 4 embryos) and blebbistatin-treated embryos (n = 2026 analyzed cell pairs from 4 embryos).
Extended Data Figure 9
Cell density is uniform along the AP axis. a, Measured cell number density (cells per unit volume) in the MPZ, P-PSM and A-PSM. Mean ± SEM. Cell density does not vary significantly along the AP axis (within the 10% accuracy of our 3D measurements; Methods). b, 3D reconstructions of confocal stacks showing nuclei labeled with H2B::RFP, detected nuclei positions, and composition of both. Cell density was measured using 3D data of nuclear positions in the different regions (n = 7866, 7214, 11537 detected cells in 694, 694, 833 defined boxes in 5, 5, 6 embryos, respectively; Methods).
Extended Data Figure 10
Yield stress values do not depend on the extent of droplet deformation before droplet relaxation. Measured values of the yield stress plotted against the maximal droplet deformation (maximal applied strain, εM; Fig. 2a,b) before starting droplet relaxation. The measured yield stress values do not correlate with the maximal strain applied, neither in control (cdh2+/+,+/, gray dots, n=53 embryos) or mutant embryos (cdh2/, red dots, n=27 embryos). Correlation coefficient, r: r = 0.34 (cdh2+/+,+/), r = 0.04 (cdh2/).
Figure 1
Figure 1. Supracellular and cell-scale mechanical stresses during body axis elongation
a, Sketch showing lateral views of a 10-somite stage and sagittal and frontal anatomical planes. b, Confocal sections along sagittal and frontal planes of posterior extending tissues in Tg(actb2:MA-Citrine) embryos (inverted). The PSM and MPZ are divided into anterior (A-PSM) and posterior (P-PSM) regions, and lateral (L-MPZ) and medial (M-MPZ) regions, respectively. The dorsal medial (DM) zone is dorsal to the MPZ. c, Embryos with droplets (red; arrows) located in the different regions. d, Elliptical fit (white; b and a being the long and short semi-axes) of a ferrofluid oil droplet (red) in the PSM of a Tg(actb2:MA-Citrine) zebrafish embryo (no magnetic actuation). e, Magnitude of supracellular stresses along the AP axis (n= 9, 24, 25, 27; mean ± SEM). Mann-Whitney test. f, Orientation of the droplets’ long axis with respect to the AP axis (n=15, 12, 11, 13). Sketch showing the average droplet orientations along AP axis (top) and the posterior-to-anterior increase in mediolateral constriction (arrows) in the PSM. g, Time evolution of the ellipsoidal droplet deformation, (ba)/a. h, Ferrofluid droplet (red) in the MPZ of a Tg(actb2:MA-Citrine) embryo. Curvature values along the detected droplet contour (color coded), with λ being the distance between consecutive curvature maxima and minima (inset). i, Measured average and maximal cell-scale stresses along the AP axis (n=7, 8, 10, 4; mean ± SEM). j, Measured values of λ (n = 29) and cell size (n = 100 cells). Line indicates mean. k, Temporal autocorrelation of droplet shape deviations from the ellipsoidal mode (n=2062 curvature time traces obtained from 4 embryos). Average half-life is approximately 1 min (inset; n=4; line indicates mean). Unless stated otherwise, n represents number of embryos, given for each tissue region as shown in each panel.
Figure 2
Figure 2. Mechanical integrity of the extending body axis
a, Example of droplet dynamics during magnetic actuation. White lines indicate ellipse segmentation. Droplet actuation is characterized by an initial deformation or strain, ε0, a maximal strain, εM, and a final residual strain, εF (Methods). b, Temporal evolution of the droplet strain during magnetic actuation. Experimental data points (gray) and fit (black line) are shown (Methods). c, The residual droplet deformation is set by the balance between the capillary stress σc and the tissue yield stress σy. d–e, Measured yield stress (d; n=12, 12, 13, 13) and volume fraction of extracellular space ϕ (e; n=8, 6, 5) along the AP axis. Mean ± SEM; Mann-Whitney test. f, Comparison between measured (red dots) and predicted (gray line and band representing mean ± SEM) yield stress along the AP axis, relative to the A-PSM. g, Confocal sections (inverted) and 3D reconstructions (Methods) of Dextran-labeled extracellular space for WT (cdh2+/+, cdh2+/−) and cdh2−/− embryos. h–i, Measured volume fraction of extracellular space (h; n=6, 8, 7) and yield stress (i; n=5, 5, 12) along the AP axis in cdh2−/− embryos (black dots) compared to WT (red dots). Mean ± SEM; Mann-Whitney test. k, Measured (red dots) and predicted (gray line and band representing mean ± SEM) yield stress values in cdh2−/− embryos normalized to WT values in each region. In all cases, n represents number of embryos, given for each tissue region as shown in each panel.
Figure 3
Figure 3. Cell-cell contact length fluctuations and cellular movements along the AP axis
a, Comparison of yield stress (Fig. 2d) and maximal cell-scale stresses (Fig. 1i) along the AP axis. b, Examples of time traces of cell-cell contact length in the PSM and MPZ. c–d, Temporal autocorrelation of cell-cell contact length (c) and spatial cross-correlation of cell-cell contact lengths separated by a distance r (d) both in the PSM and MPZ (n=186, 54 cell-cell contacts). Correlation (persistence) timescale (c, inset; line indicates mean). e, Normalized frequency of cell-cell contact lengths in the PSM and MPZ (n=6969, 7896 cell-cell contacts). Zoomed in distribution tail (box, left inset). Neighbor exchange (NE) rates (per cell) in PSM and MPZ (right inset; n=14, 49 NE; line indicates mean). For c–e, n is given for PSM, MPZ and obtained from 3, 4 embryos, respectively. f, Normalized frequency of cell-cell contact lengths in the MPZ of embryos treated with blebbistatin 100 μM (n=13813 cell-cell contacts from 4 embryos). Zoomed in distribution tail (box, left inset). NE rate in the MPZ region of treated embryos compared to WT (right inset; n=20 NE from 3 embryos). g, Measured yield stress in the MPZ of embryos treated with blebbistatin (red; n=12 embryos) compared to WT (gray, n=26 embryos). Mean ± SEM; Mann-Whitney test. h–i, Tracks (h; absolute and relative; nuclear tracking) and normalized mean square relative displacement (MSRD, i; n=1937, 1776, 2523 analyzed cell pairs for A-PSM, P-PSM and MPZ, obtained from 5, 5, 6 embryos) of cellular movements during a 30 min time window.
Figure 4
Figure 4. Physical mechanism of vertebrate body axis elongation
a, The MPZ (fluid-like) and PSM (solid-like) tissue states are represented in the jamming phase diagram,, which organizes jammed (solid-like) and unjammed (fluid-like) phases as the volume fraction of extracellular spaces, supracellular stresses and active fluctuations (effective temperature) change. b, The higher cell-cell contact length fluctuations (high effective temperature) in the less constrained environment (more extracellular spaces) of the MPZ (light blue) drive cell rearrangements and cell mixing, effectively ‘melting’ the tissue in this region. As the paraxial mesoderm matures, the smaller extracellular spaces and low cell-cell contact fluctuations (low effective temperature) in the PSM (violet) rigidify the tissue via a jamming transition. Cells entering the MPZ from the DM region (green arrows; lateral view) cause the expansion of the fluid-like MPZ tissue, with the solid-like PSM acting as a rigid support that biases tissue expansion towards the posterior direction, thereby elongating the body axis. While persistent mediolateral supracellular stresses restrict lateral tissue expansion, the main role of non-persistent cell-scale stresses is to ‘melt’ the MPZ tissue, enabling its expansion and posterior elongation upon addition of new cells from the DM. c, Sketch of the posterior body showing the input physical fields in the simulation. d–e, Time evolution of simulated tissue shapes (black outline) in the presence (d) and absence (e) of a jamming transition along the AP axis. The color code in the right half of each shape corresponds to the spatial profile of the tissue viscosity (diverging in solid-like tissue regions), whereas the left half shows the AP profile of cell ingression rate into the MPZ from DM tissues. Gray rectangles represent a rigid boundary. (d, inset) Simulated morphogenetic flows (velocity field: direction, arrows; magnitude, color coded) in the presence of a jamming transition leading to unidirectional body elongation.

Comment in

  • Tissue 'melting' sculpts embryo.
    Lenne PF, Trivedi V. Lenne PF, et al. Nature. 2018 Sep;561(7723):315-316. doi: 10.1038/d41586-018-06108-7. Nature. 2018. PMID: 30224727 No abstract available.

References

    1. Cohen-Addad S, Höhler R, Pitois O. Flow in Foams and Flowing Foams. Annu Rev Fluid Mech. 2013;45:241–267.
    1. Liu AJ, Nagel SR. Jamming is just not cool any more. Nature. 1998;396:21–22.
    1. Bonn D, Denn MM, Berthier L, Divoux T, Manneville S. Yield stress materials in soft condensed matter. Rev Mod Phys. 2017;89:15.
    1. Trappe V, Prasad V, Cipelletti L, Segre PN, Weitz DA. Jamming phase diagram for attractive particles. Nature. 2001;411:772–775. - PubMed
    1. Angelini TE, et al. Glass-like dynamics of collective cell migration. Proc Natl Acad Sci U S A. 2011;108:4714–4719. - PMC - PubMed

Publication types