. 2018 Aug 22:12:571.
doi: 10.3389/fnins.2018.00571. eCollection 2018.

The Epigenetic Factor Landscape of Developing Neocortex Is Regulated by Transcription Factors Pax6→ Tbr2→ Tbr1

Affiliations

The Epigenetic Factor Landscape of Developing Neocortex Is Regulated by Transcription Factors Pax6→ Tbr2→ Tbr1

Gina E Elsen et al. Front Neurosci. .

Abstract

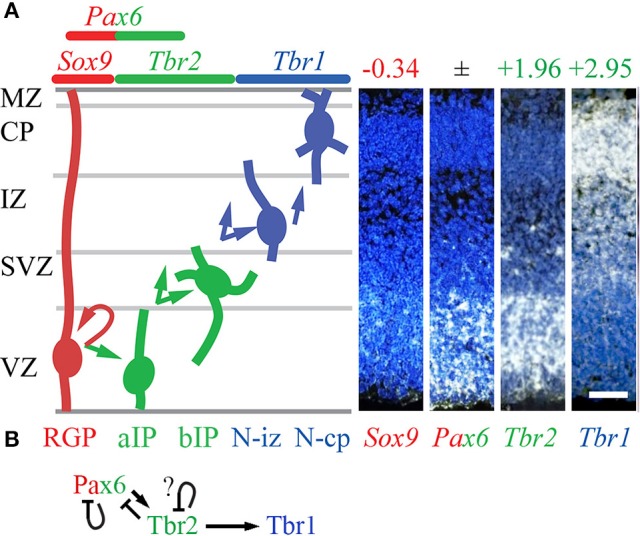
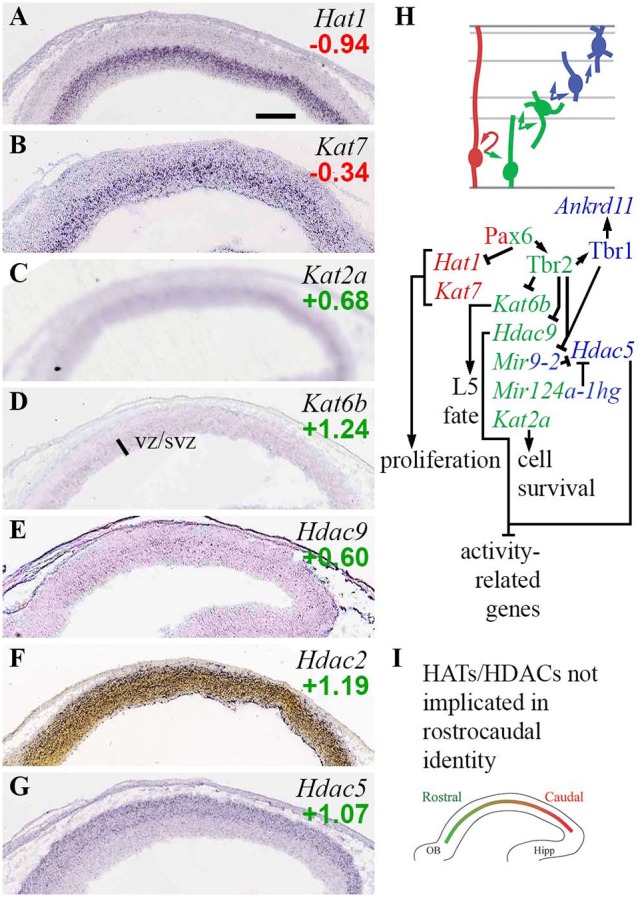
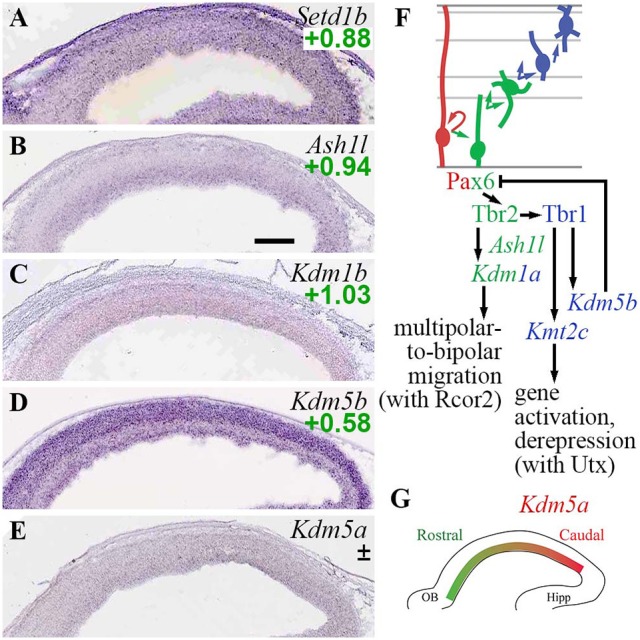
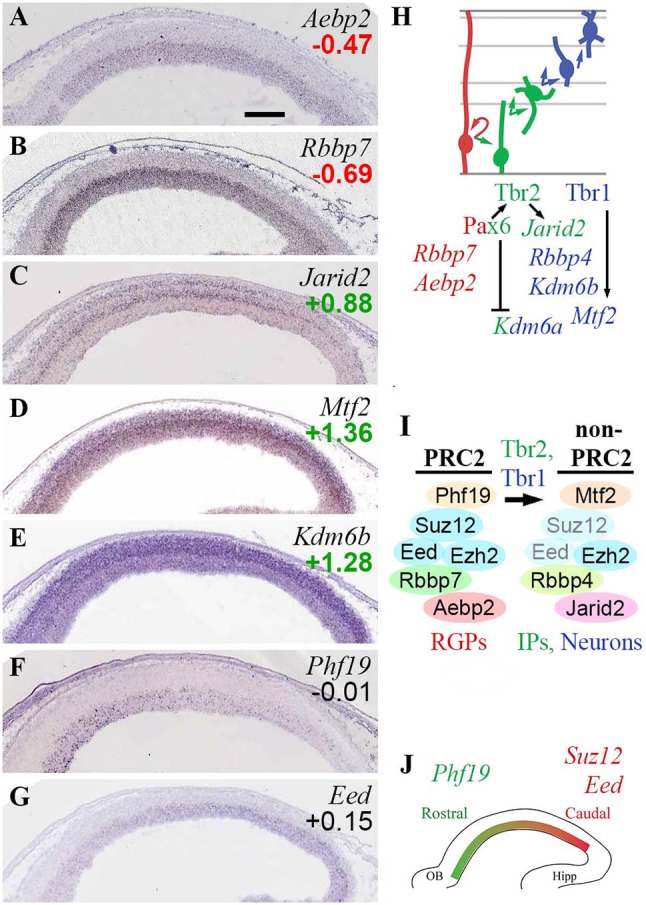
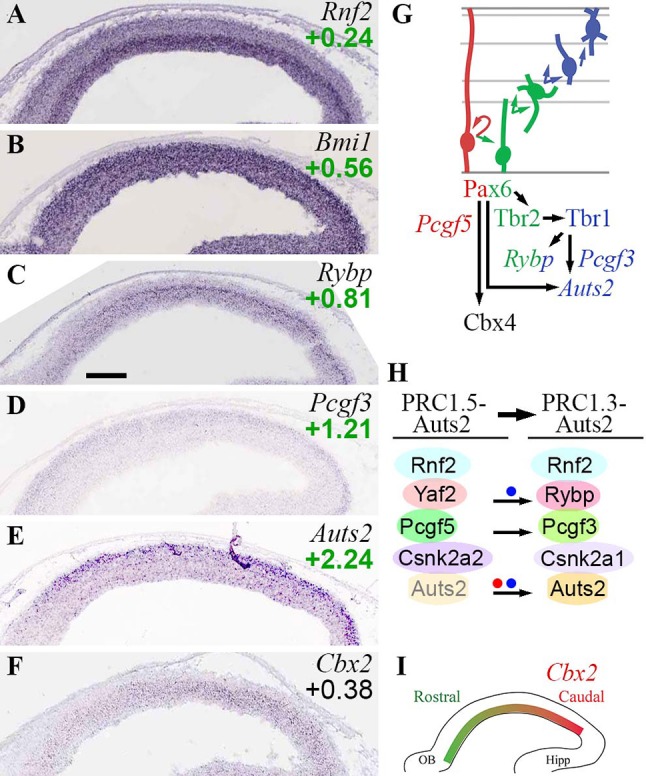
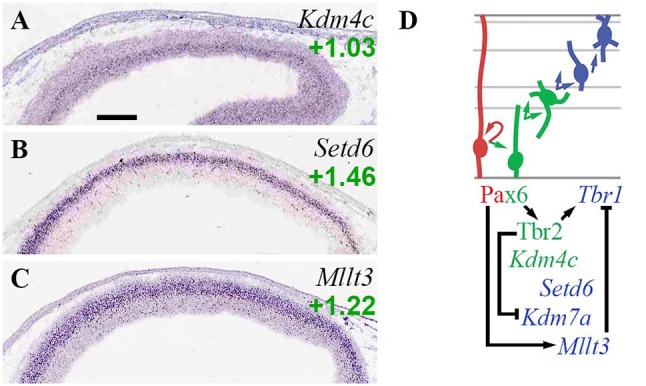
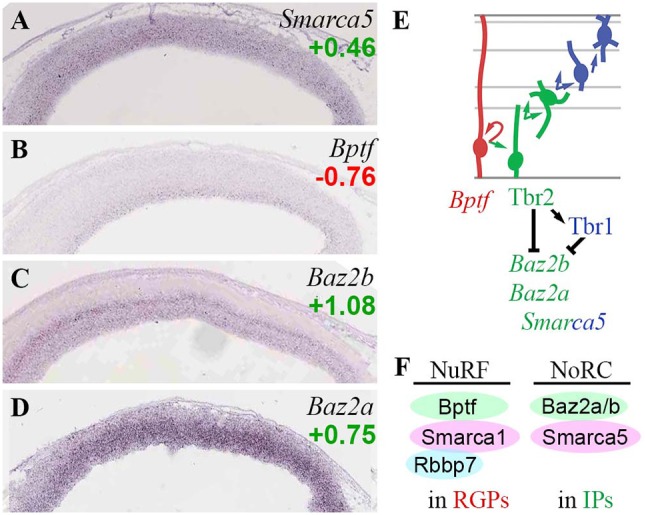
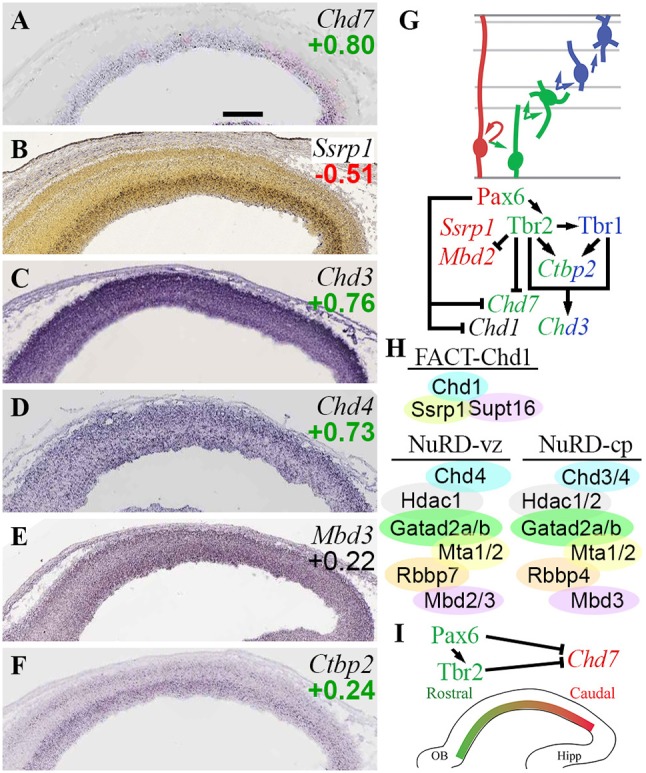
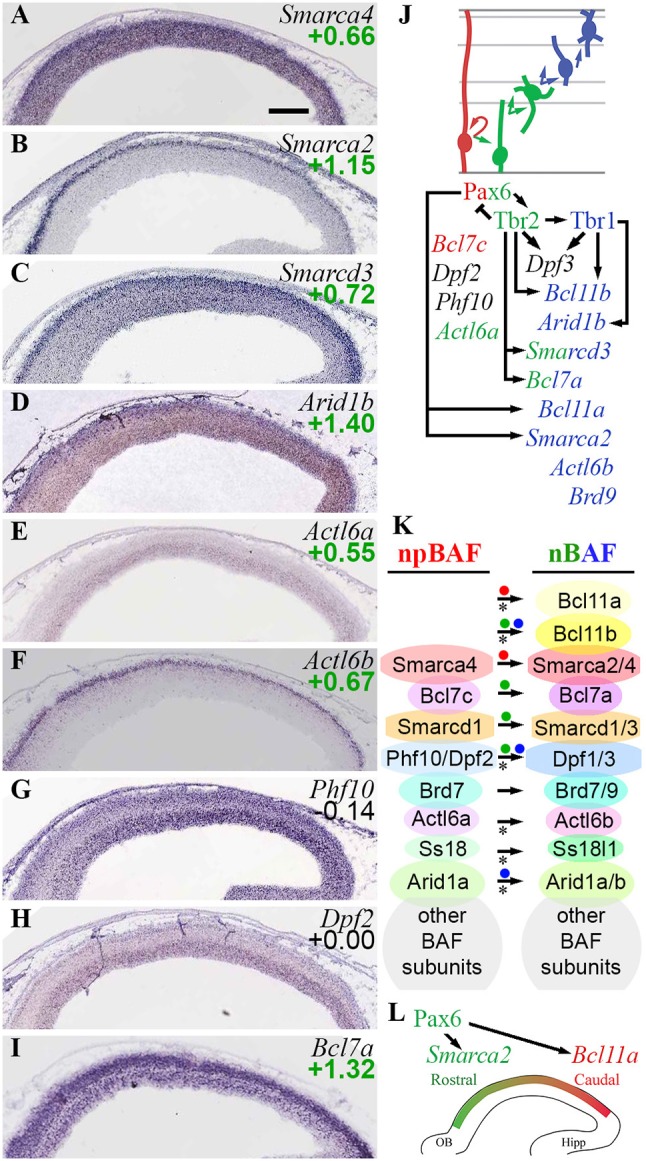
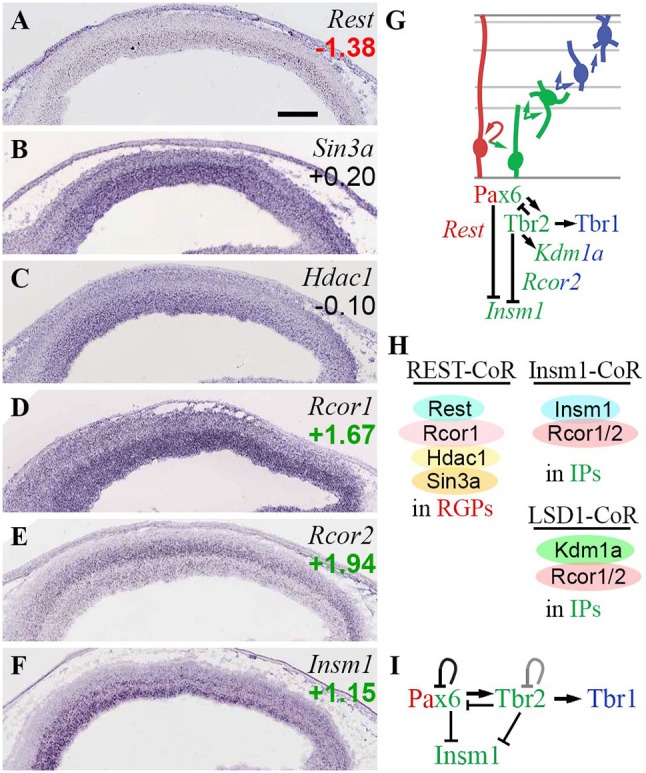
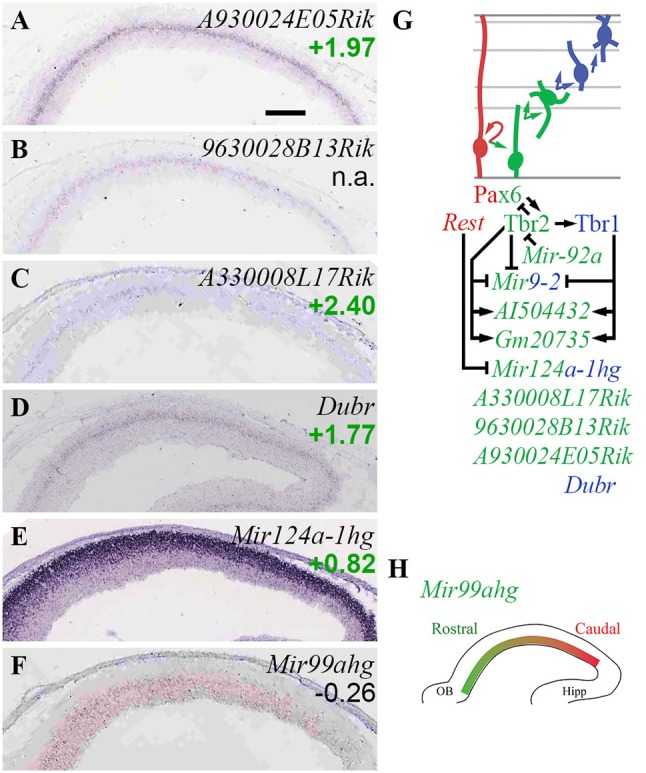
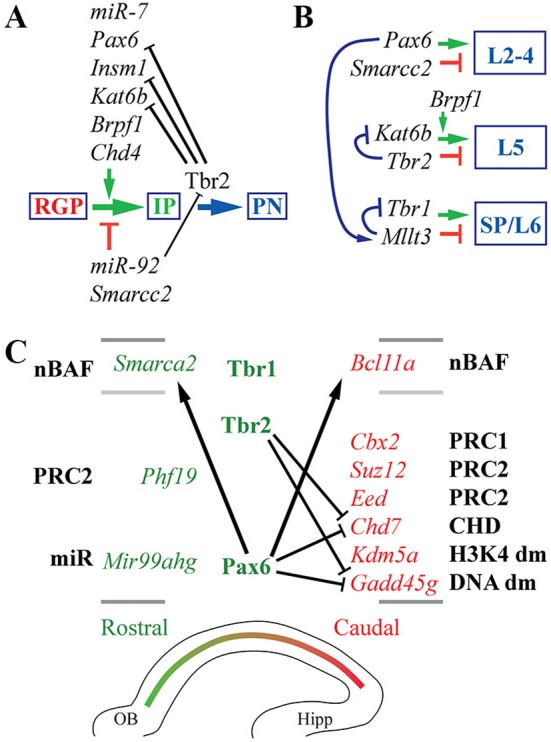
Epigenetic factors (EFs) regulate multiple aspects of cerebral cortex development, including proliferation, differentiation, laminar fate, and regional identity. The same neurodevelopmental processes are also regulated by transcription factors (TFs), notably the Pax6→ Tbr2→ Tbr1 cascade expressed sequentially in radial glial progenitors (RGPs), intermediate progenitors, and postmitotic projection neurons, respectively. Here, we studied the EF landscape and its regulation in embryonic mouse neocortex. Microarray and in situ hybridization assays revealed that many EF genes are expressed in specific cortical cell types, such as intermediate progenitors, or in rostrocaudal gradients. Furthermore, many EF genes are directly bound and transcriptionally regulated by Pax6, Tbr2, or Tbr1, as determined by chromatin immunoprecipitation-sequencing and gene expression analysis of TF mutant cortices. Our analysis demonstrated that Pax6, Tbr2, and Tbr1 form a direct feedforward genetic cascade, with direct feedback repression. Results also revealed that each TF regulates multiple EF genes that control DNA methylation, histone marks, chromatin remodeling, and non-coding RNA. For example, Tbr1 activates Rybp and Auts2 to promote the formation of non-canonical Polycomb repressive complex 1 (PRC1). Also, Pax6, Tbr2, and Tbr1 collectively drive massive changes in the subunit isoform composition of BAF chromatin remodeling complexes during differentiation: for example, a novel switch from Bcl7c (Baf40c) to Bcl7a (Baf40a), the latter directly activated by Tbr2. Of 11 subunits predominantly in neuronal BAF, 7 were transcriptionally activated by Pax6, Tbr2, or Tbr1. Using EFs, Pax6→ Tbr2→ Tbr1 effect persistent changes of gene expression in cell lineages, to propagate features such as regional and laminar identity from progenitors to neurons.

Keywords: BAF; NuRD; cortical development; histone acetylation; lncRNA; microRNA; polycomb; trithorax group.


Figures

Figure 1
Figure 1
Cell types, TF expression, and histological zones in E14.5 mouse neocortex. (A) Neurogenesis and cell-type-specific TF expression. Histological zones and cell types (left) are aligned with TF gene ISH (right; white ISH signal, blue nuclear counterstain). Arrows indicate common (but not exclusive) pathways of neurogenesis. Numbers above ISH panels indicate log2FC on Tbr2-GFP microarray (all p < 0.05). Abbreviations: see text. ISH: Allen Brain Atlas Developing Mouse Brain, E15.5 (colors inverted for figure). Scale bar: 50 μm. (B) The Pax6→ Tbr2→ Tbr1 cascade involves direct feedforward activation (arrows) and feedback repression (bars). The effect of Tbr2 binding at the Tbr2 locus could not be determined from available data (see text), but could be feedback repression.
Figure 2
Figure 2
Expression and regulation of DNA methylation/demethylation factors. (A–D) Expression of the indicated genes in E14.5 mouse neocortex. Dnmt1 (A), Dnmt3a (B), and Dnmt3b (C) were expressed in VZ, and were significantly enriched in Tbr2-GFP cells, defining them as RGP markers (Supplementary Table S2). Gadd45g (D), part of a pathway for DNA demethylation, was expressed in a high caudal gradient in the VZ, but was not significantly enriched in RGPs or IPs on microarray. (Significant log2FC values are indicated by bold text, in red or green). Sagittal sections, rostral left, ventral down (see also Supplementary Figure S1). ISH: Genepaint (A,C,D) and BGEM (B; darkfield). Scale bar: 100 μm. (E) Cell-type-specific gene expression and regulation by TFs. Arrows, direct transcriptional activation; bars, direct repression. (F) Pax6 and Tbr2 may shape the Gadd45g gradient by direct repression.
Figure 3
Figure 3
Histone acetylases (HATs) and deacetylases (HDACs). (A–G) Expression of indicated genes. Hat1 (A) and Kat7 (B) were RGP-specific. Interestingly, Hdac9 (E) and Hdac5 (G) showed complementary zonal expression in VZ/SVZ and IZ/CP, respectively. ISH: Genepaint (A–E,G) and Allen Institute (F). Scale bar: 100 μm. (H) Cell-type-specific gene expression and regulation. Tbr2, Tbr1, and Mir9-2 regulate a switch from Hdac9 in progenitors, to Hdac5 in PNs. (I) No HATs or HDACs exhibited regional expression gradients.
Figure 4
Figure 4
TrxG histone methylation/demethylation EFs. (A–E) Expression of indicated genes. The plus/minus symbol (±) indicates that different probes for the same gene, in this example Kdm5a (E), showed enrichment in both Tbr2-GFP+ and Tbr2-GFP– cells on microarray (conflicted). ISH: Genepaint. Scale bar: 100 μm. (F) Summary of gene expression and regulation. Interestingly, Tbr1 activated both H3K4 methyltransferase (Kmt2c; Mll3) and H3K4 demethylase (Kdm5b; Jarid1b) genes. (G) Expression of Kdm5a (high caudal) was not directly regulated by Pax6, Tbr2, or Tbr1.
Figure 5
Figure 5
PRC2 complexes. (A–G) Expression of indicated genes. ISH: Genepaint. Scale bar: 100 μm. (H) Summary of subunit gene expression and regulation. (I) Changes in PRC2 subunit expression were associated with PN differentiation, and were regulated by Tbr1/2. Eed and Suz12 subunits were downregulated in differentiating cells (transparent subunits), potentially leading to formation of “non-PRC2” Ezh2 complexes. (J) Graded expression of PRC2 subunits is important in cortex regionalization, but these genes are not under direct control of Pax6, Tbr2, or Tbr1.
Figure 6
Figure 6
PRC1 complexes. (A–F) Expression of indicated genes. ISH: Genepaint. Scale bar: 100 μm. (G) Summary of gene expression and regulation. (H) Changes in PRC1 subunit expression, and formation of non-canonical PRC1, were associated with PN differentiation, and were regulated by Pax6 (red dot) and Tbr1 (blue dots). Auts2 was expressed at low levels in VZ/SVZ (transparent Auts2 subunit). (I) Graded expression of Cbx2 (high caudal) was not regulated by Pax6, Tbr2, or Tbr1.
Figure 7
Figure 7
Other histone marks and EFs. (A–C) Expression of indicated genes. Interestingly, Set6d (B) was specifically and exclusively expressed by PNs in developing forebrain. ISH: Genepaint. Scale bar: 100 μm. (D) Gene expression and regulation. Notably, Pax6 activated Mllt3 to indirectly repress Tbr1.
Figure 8
Figure 8
ISWI chromatin remodeling complexes. (A–D) Expression of indicated genes. The bilaminar expression of Baz2b (C) in VZ and SVZ is typical of aIP- and bIP-specific genes (Kawaguchi et al., 2008). ISH: Genepaint. Scale bar: 100 μm. (E) Gene expression and regulation. Although Baz2b (C) is an IP marker, it was directly repressed by Tbr2 and Tbr1 (Supplementary Tables S2, S4). (F) NuRF complexes are enriched in RGPs, and NoRC complexes in IPs.
Figure 9
Figure 9
CHD chromatin remodeling complexes. (A–F) Expression of indicated genes. ISH: Genepaint (A,C–F) and Allen Brain Atlas Developing Mouse Brain (B). Scale bar: 100 μm. (G) Gene expression and regulation. Notably, Tbr1 and Tbr2 synergistically activate Chd3, a NuRD subunit. (H) CHD complexes in E14.5 neocortex include FACT-Chd1 in RGPs, and NuRD in progenitors (Chd4-containing) and neurons (Chd3/4-containing). (I) Gradient of Chd7 expression (high caudal) is shaped by Pax6 and Tbr2.
Figure 10
Figure 10
BAF chromatin remodeling complexes. (A–I) Expression of indicated genes. Remarkably, Smarca2 (Brm; B) was specifically expressed by postmitotic PNs in the CP, with a high rostral gradient. ISH: Genepaint. Scale bar: 100 μm. (J) Summary of gene expression and regulation. (K) BAF subunit switching was controlled by Pax6 (red dots), Tbr2 (green dots), and Tbr1 (blue dots). Asterisks: previously described switches in BAF subunit composition, confirmed here. (L) Smarca2 (high rostral in CP) and Bcl11a (high caudal in IZ/CP) were both directly activated by Pax6, reflecting multiple functions of Pax6 in cortical development (see text for details).
Figure 11
Figure 11
Rest and CoRest complexes. (A–F) Expression of indicated genes. While Rest (A) was specifically expressed in RGPs, CoRest genes Rcor1 (D) and Rcor2 (E) were enriched in IPs, as was Insm1 (F). ISH: Genepaint. Scale bar: 100 μm. (G) Summary of gene expression and regulation. Interestingly, Tbr2 activated Kdm1a (Lsd1) but repressed Insm1; both are CoRest (Rcor1/2) binding partners. Pax6 also repressed Insm1. (H) Rest/CoRest complexes form in RGPs, while Insm1/CoRest and Lsd1/CoRest complexes form primarily in IPs. (I) Repression of Insm1 by the Pax6→ Tbr2→ Tbr1 cascade. Like Pax6 and Tbr2, Insm1 is a key regulator of IPs (Farkas et al., 2008). The Tbr2 loop is shown in gray to reflect unknown effect of Tbr2 on its own transcription.
Figure 12
Figure 12
Non-coding RNA. (A–F) Expression of indicated genes. Remarkably, several lncRNA genes (A–D) showed similar expression patterns in bIPs and/or new neurons in SVZ/IZ. ISH: Genepaint. Scale bar: 100 μm. (G) Summary of ncRNA gene expression and regulation. (H) Expression of Mir99ahg (high rostral) was not regulated by Pax6, Tbr2, or Tbr1; but may shape the high caudal gradient of its target, Fgfr3 (not shown). See text for details.
Figure 13
Figure 13
Cortex-specific neurodevelopmental processes regulated by EFs under the control of Pax6, Tbr2, and Tbr1. (A) IP genesis is reportedly regulated by multiple EFs, as well as TFs such as Pax6 and Insm1. Tbr2 directly represses IP-genic factors. Arrows: (B) Differentiation of all cortical layers is regulated by interacting EFs and TFs. SP: subplate. (C) Rostrocaudal regionalization is extensively regulated by TFs and EFs in an expansive gene regulatory network. Pax6 and Tbr2 regulate several regionally graded EF genes (italic), which are components of several different epigenetic complexes or systems (bold). Abbreviations: dm, demethylation; others as in text. Lines indicate zonal separation of IZ/CP above, and VZ/SVZ below. Arrows indicate direct transcriptional activation; bars, repression.

Similar articles

Cited by

References

    1. Abrajano J. J., Qureshi I. A., Gokhan S., Zheng D., Bergman A., Mehler M. F. (2009). REST and CoREST modulate neuronal subtype specification, maturation and maintenance. PLoS ONE 4:e7936. 10.1371/journal.pone.0007936 - DOI - PMC - PubMed
    1. Albert M., Kalebic N., Florio M., Lakshmanaperumal N., Haffner C., Brandl H., et al. . (2017). Epigenome profiling and editing of neocortical progenitor cells during development. EMBO J. 36, 2642–2658. 10.15252/embj.201796764 - DOI - PMC - PubMed
    1. Albert M., Schmitz S. U., Kooistra S. M., Malatesta M., Morales Torres C., Rekling J. C., et al. . (2013). The histone demethylase Jarid1b ensures faithful mouse development by protecting developmental genes from aberrant H3K4me3. PLoS Genet. 9:e1003461. 10.1371/journal.pgen.1003461 - DOI - PMC - PubMed
    1. Alfano C., Magrinelli E., Harb K., Hevner R. F., Studer M. (2014). Postmitotic control of sensory area specification during neocortical development. Nat. Commun. 5:5632. 10.1038/ncomms6632 - DOI - PubMed
    1. Allis C. D., Jenuwein T. (2016). The molecular hallmarks of epigenetic control. Nat. Rev. Genet. 17, 487–500. 10.1038/nrg.2016.59 - DOI - PubMed