

Auditory Stream Segregation and Selective Attention for Cochlear Implant Listeners: Evidence From Behavioral Measures and Event-Related Potentials
- PMID: 30186105
- PMCID: PMC6110823
- DOI: 10.3389/fnins.2018.00581
Auditory Stream Segregation and Selective Attention for Cochlear Implant Listeners: Evidence From Behavioral Measures and Event-Related Potentials
Abstract
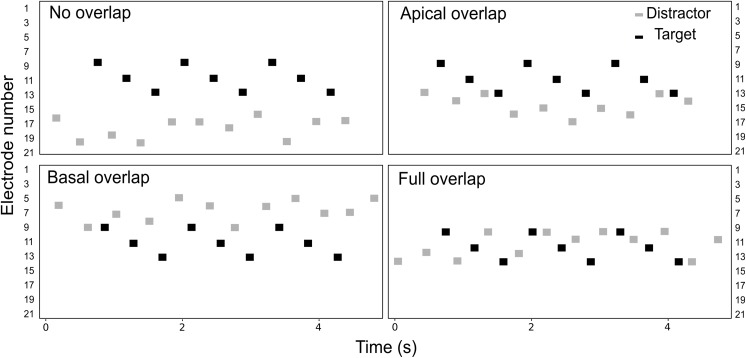
The role of the spatial separation between the stimulating electrodes (electrode separation) in sequential stream segregation was explored in cochlear implant (CI) listeners using a deviant detection task. Twelve CI listeners were instructed to attend to a series of target sounds in the presence of interleaved distractor sounds. A deviant was randomly introduced in the target stream either at the beginning, middle or end of each trial. The listeners were asked to detect sequences that contained a deviant and to report its location within the trial. The perceptual segregation of the streams should, therefore, improve deviant detection performance. The electrode range for the distractor sounds was varied, resulting in different amounts of overlap between the target and the distractor streams. For the largest electrode separation condition, event-related potentials (ERPs) were recorded under active and passive listening conditions. The listeners were asked to perform the behavioral task for the active listening condition and encouraged to watch a muted movie for the passive listening condition. Deviant detection performance improved with increasing electrode separation between the streams, suggesting that larger electrode differences facilitate the segregation of the streams. Deviant detection performance was best for deviants happening late in the sequence, indicating that a segregated percept builds up over time. The analysis of the ERP waveforms revealed that auditory selective attention modulates the ERP responses in CI listeners. Specifically, the responses to the target stream were, overall, larger in the active relative to the passive listening condition. Conversely, the ERP responses to the distractor stream were not affected by selective attention. However, no significant correlation was observed between the behavioral performance and the amount of attentional modulation. Overall, the findings from the present study suggest that CI listeners can use electrode separation to perceptually group sequential sounds. Moreover, selective attention can be deployed on the resulting auditory objects, as reflected by the attentional modulation of the ERPs at the group level.
Keywords: auditory attention; auditory scene analysis; build-up; cochlear implant; event-related potentials; segregation.
Figures


Similar articles
-
Auditory Stream Segregation Can Be Modeled by Neural Competition in Cochlear Implant Listeners.Front Comput Neurosci. 2019 Jul 3;13:42. doi: 10.3389/fncom.2019.00042. eCollection 2019. Front Comput Neurosci. 2019. PMID: 31333438 Free PMC article.
-
The Role of Place Cues in Voluntary Stream Segregation for Cochlear Implant Users.Trends Hear. 2018 Jan-Dec;22:2331216517750262. doi: 10.1177/2331216517750262. Trends Hear. 2018. PMID: 29347886 Free PMC article.
-
Perceptual organization of sequential stimuli in cochlear implant listeners: A temporal processing approach.Int Tinnitus J. 2019 Jan 1;23(1):37-41. doi: 10.5935/0946-5448.20190007. Int Tinnitus J. 2019. PMID: 31469526
-
Explaining the high voice superiority effect in polyphonic music: evidence from cortical evoked potentials and peripheral auditory models.Hear Res. 2014 Feb;308:60-70. doi: 10.1016/j.heares.2013.07.014. Epub 2013 Aug 3. Hear Res. 2014. PMID: 23916754 Review.
-
Development of auditory scene analysis: a mini-review.Front Hum Neurosci. 2024 Mar 12;18:1352247. doi: 10.3389/fnhum.2024.1352247. eCollection 2024. Front Hum Neurosci. 2024. PMID: 38532788 Free PMC article. Review.
Cited by
-
The influence of auditory selective attention on linguistic outcomes in deaf and hard of hearing children with cochlear implants.Eur Arch Otorhinolaryngol. 2023 Jan;280(1):115-124. doi: 10.1007/s00405-022-07463-y. Epub 2022 Jul 13. Eur Arch Otorhinolaryngol. 2023. PMID: 35831674 Free PMC article.
-
Previous binaural experience supports compensatory strategies in hearing-impaired children's auditory horizontal localization.PLoS One. 2024 Dec 5;19(12):e0312073. doi: 10.1371/journal.pone.0312073. eCollection 2024. PLoS One. 2024. PMID: 39637020 Free PMC article.
-
Strength of Attentional Modulation on Cortical Auditory Evoked Responses Correlates with Speech-in-Noise Performance in Bimodal Cochlear Implant Users.Trends Hear. 2022 Jan-Dec;26:23312165221141143. doi: 10.1177/23312165221141143. Trends Hear. 2022. PMID: 36464791 Free PMC article.
-
Auditory stream segregation of amplitude-modulated narrowband noise in cochlear implant users and individuals with normal hearing.Front Psychol. 2022 Sep 2;13:927854. doi: 10.3389/fpsyg.2022.927854. eCollection 2022. Front Psychol. 2022. PMID: 36118488 Free PMC article.
-
Can You Hear Out the Melody? Testing Musical Scene Perception in Young Normal-Hearing and Older Hearing-Impaired Listeners.Trends Hear. 2020 Jan-Dec;24:2331216520945826. doi: 10.1177/2331216520945826. Trends Hear. 2020. PMID: 32895034 Free PMC article.
References
-
- Anstis S. M., Saida S. (1985). Adaptation to auditory streaming of frequency-modulated tones. J. Exp. Psychol. Hum. Percept. Perform. 11 257–271. 10.1037/0096-1523.11.3.257 - DOI
-
- Bates D., Mächler M., Bolker B., Walker S. (2014). Fitting linear mixed-effects models using lme4. J. Statis. Softw. 67:51 10.18637/jss.v067.i01 - DOI
LinkOut - more resources
Full Text Sources
Other Literature Sources