. 2018 Aug 22:12:587.
doi: 10.3389/fnins.2018.00587. eCollection 2018.

BrainWave: A Matlab Toolbox for Beamformer Source Analysis of MEG Data

Affiliations

BrainWave: A Matlab Toolbox for Beamformer Source Analysis of MEG Data

Cecilia Jobst et al. Front Neurosci. .

Abstract

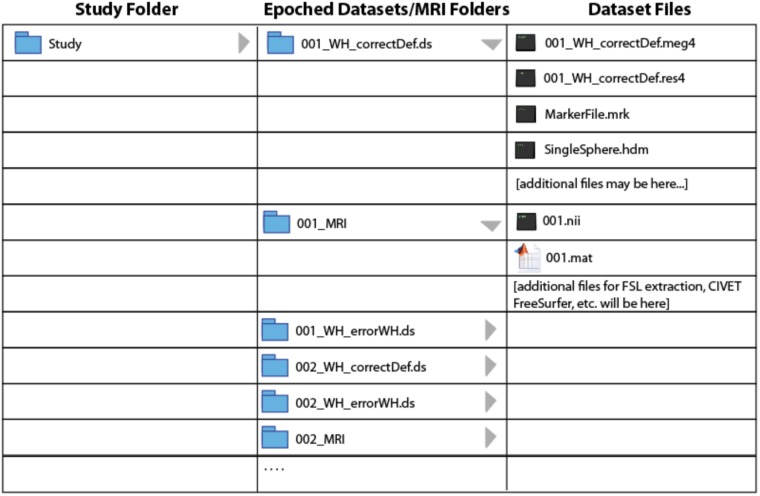
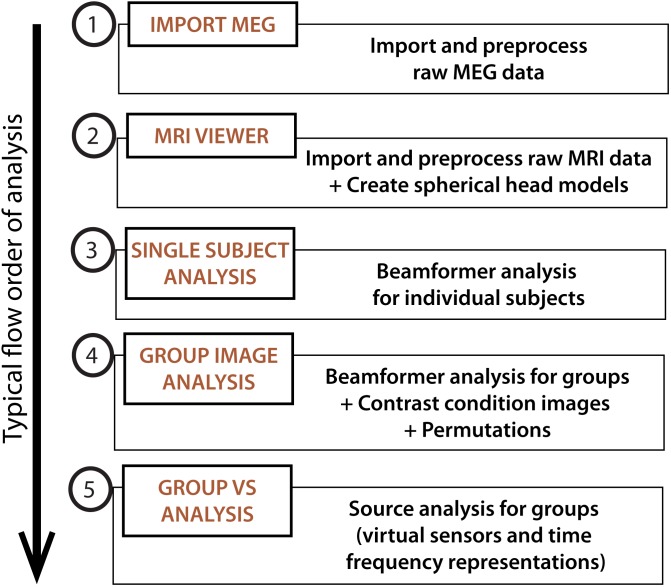
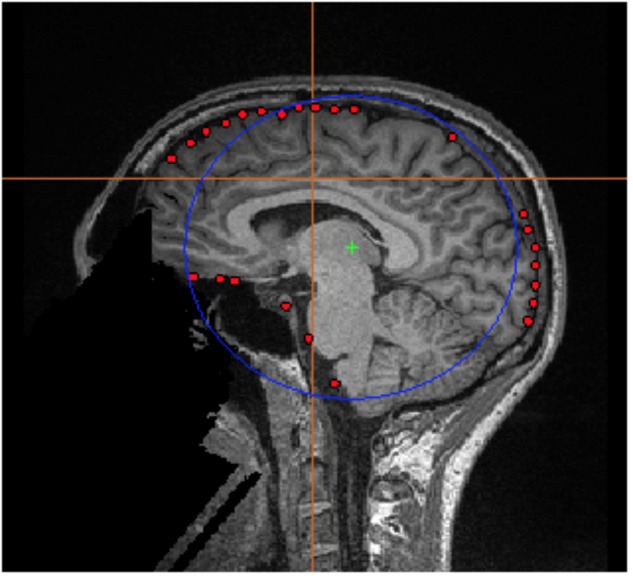
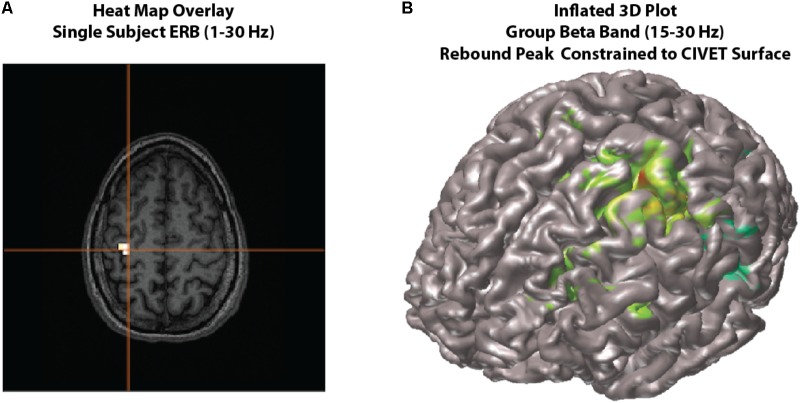
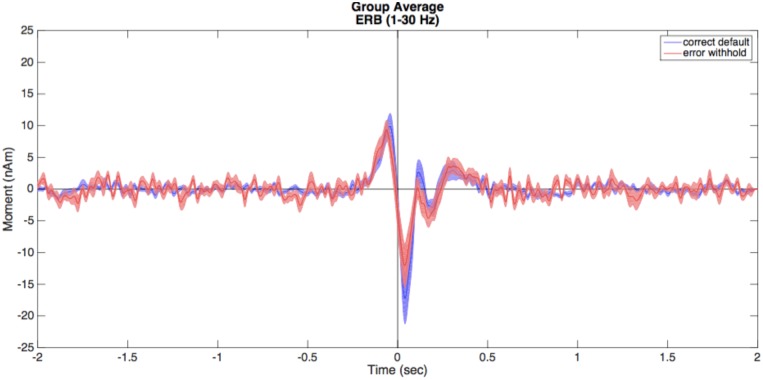
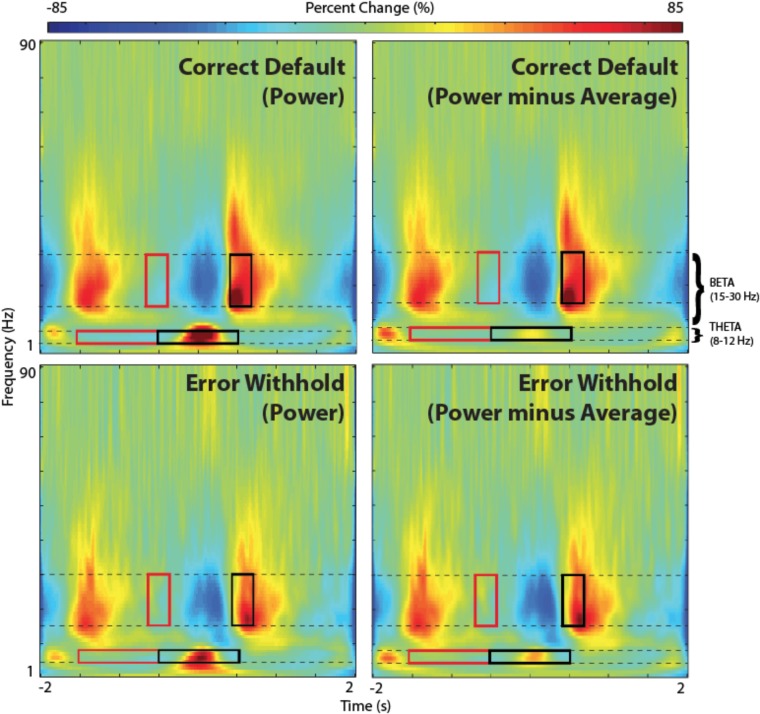
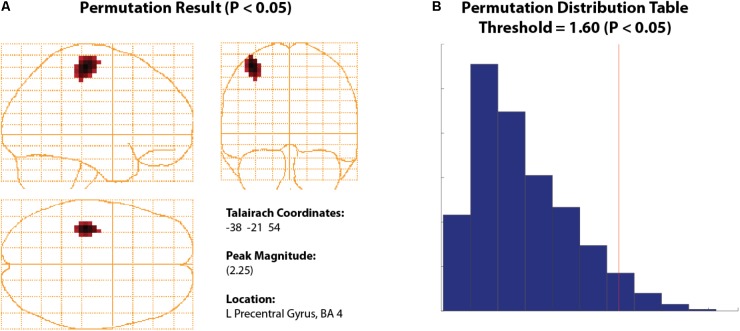
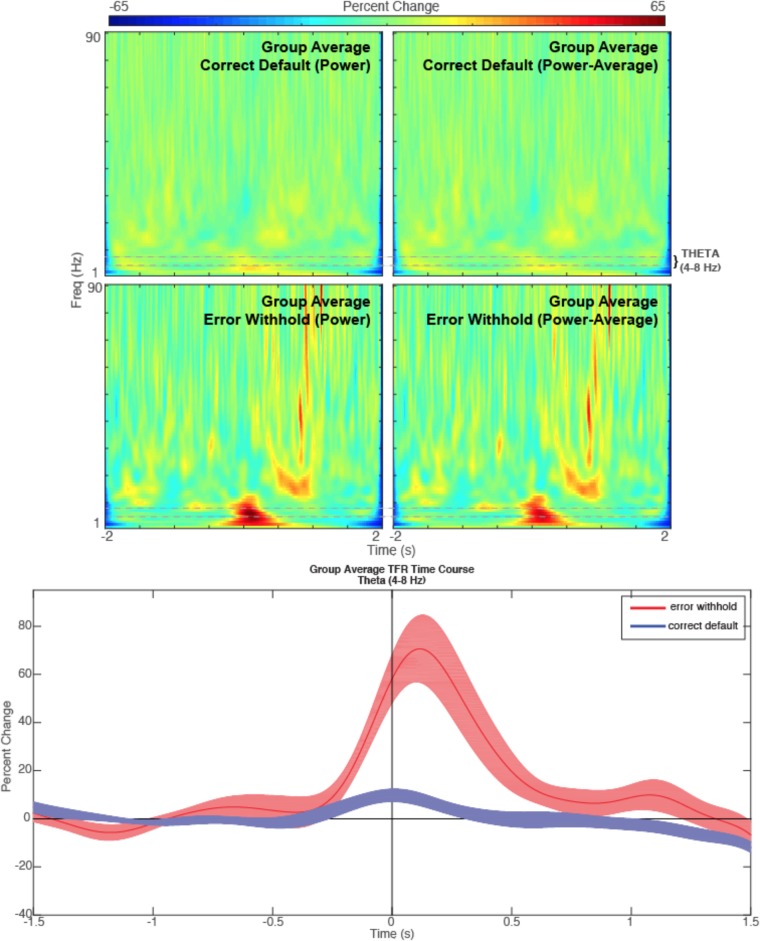
BrainWave is an easy-to-use Matlab toolbox for the analysis of magnetoencephalography data. It provides a graphical user interface for performing minimum-variance beamforming analysis with rapid and interactive visualization of evoked and induced brain activity. This article provides an overview of the main features of BrainWave with a step-by-step demonstration of how to proceed from raw experimental data to group source images and time series analyses. This includes data selection and pre-processing, magnetic resonance image co-registration and normalization procedures, and the generation of volumetric (whole-brain) or cortical surface based source images, and corresponding source time series as virtual sensor waveforms and their time-frequency representations. We illustrate these steps using example data from a recently published study on response inhibition (Isabella et al., 2015) using the sustained attention to response task paradigm in 12 healthy adult participants. In this task participants were required to press a button with their right index finger to a rapidly presented series of numerical digits and withhold their response to an infrequently presented target digit. This paradigm elicited movement-locked brain responses, as well as task-related modulation of brain rhythmic activity in different frequency bands (e.g., theta, beta, and gamma), and is used to illustrate two different types of source reconstruction implemented in the BrainWave toolbox: (1) event-related beamforming of averaged brain responses and (2) beamformer analysis of modulation of rhythmic brain activity using the synthetic aperture magnetometry algorithm. We also demonstrate the ability to generate group contrast images between different response types, using the example of frontal theta activation patterns during error responses (failure to withhold on target trials). BrainWave is free academic software available for download at http://cheynelab.utoronto.ca/brainwave along with supporting software and documentation. The development of the BrainWave toolbox was supported by grants from the Canadian Institutes of Health Research, the National Research and Engineering Research Council of Canada, and the Ontario Brain Institute.

Keywords: Matlab toolbox; beamforming; group analysis; magnetoencephalography; response inhibition; source analysis.


Figures

FIGURE 1
FIGURE 1
Data structure. MEG dataset and MRI directory file structure used by BrainWave.
FIGURE 2
FIGURE 2
BrainWave. The main menu can be used to launch the main analysis modules in BrainWave, including (1) the import and preprocessing of raw MEG data, (2) MRI preparation for MEG co-registration, (3) single subject beamformer analysis for exploratory and/or single patient data analysis, (4) group beamformer analysis, and (5) an additional module for time course plotting and time-frequency decomposition from arbitrary or pre-selected brain locations.
FIGURE 3
FIGURE 3
FSL Surface Extraction. Example of the inner skull surface extraction using FSL for subject 001 (red dots), with an overlaid single sphere head model (blue circle).
FIGURE 4
FIGURE 4
Viewing options. Examples of viewing options for source images. (A) Individual subject results can be overlaid onto their own MRI in the MRIViewer module. This example shows evoked activity (ERB) response of subject 002, overlaid onto their own MRI. Single subject or group images can also be viewed on a built-in template brain surface [FreeSurfer extracted pial surface from the Colin-27 (CH2.nii) average brain] or an averaged extracted pial surface from CIVET. (B) Shows an example synthetic aperture magnetometry (SAM) group analysis of a beta band (15–30 Hz) rebound peak, constrained to a CIVET extracted surface.
FIGURE 5
FIGURE 5
Virtual sensors (VS). Illustrated here are the averaged VS plots calculated from the ERB peak of each condition. Correct default (in blue) and error withhold (in red) plots are displayed with shaded standard error bars using BrainWave tools, then edited to a single plot using Matlab’s figure editing tools (e.g., overlay, add legend, text size, etc.).
FIGURE 6
FIGURE 6
Time-frequency representations (TFR). TFR plots are useful as an aid in the identification of appropriate baseline and active windows for SAM beamformer analyses. Here, we demonstrate the chosen baseline window (red) and active window (black) within the beta band frequency (15–30 Hz), as well as suggested windows for theta band frequency (4–8 Hz), for a group SAM motor peak analyses. Time zero indicates button press. Note that removing the averaged evoked activity (power-average dropdown option within BrainWave) shows only non-phase locked activity, resulting in reduced power in both beta and theta bands. However, larger reductions are found in theta and remains higher in the error condition.
FIGURE 7
FIGURE 7
Permuted Beta Suppression Peak. (A) Significant beta rebound peak with all voxels shown with a significance of P > 0.05 or higher. (B) The significance cut-off was determined using a permutation distribution plot which calculated all significant values to the right of the red vertical line.
FIGURE 8
FIGURE 8
Theta. Time-frequency representations are shown for the R Anterior Cingulate peak (top) generated from a contrasted (error withhold > correct default) group theta band (4–8 Hz) beamformer as described. Note that the theta band power remains present in error peaks when phase-locked activity is removed (power minus average). A time course of the theta band TFR is represented (bottom) with shaded error bars for each condition described.

References

    1. Ad-Dab’bagh Y., Einarson D., Lyttelton O., Muehlboeck J.-S., Mok K., Ivanov O., et al. (2005). “The CIVET image-processing environment: a fully automated comprehensive pipeline for anatomical neuroimaging research,” in Proceedings of the 12th Annual Meeting of the Organization for Human Brain Mapping, Florence.
    1. Baillet S. (2017). Magnetoencephalography for brain electrophysiology and imaging. Nat. Neurosci. 20 327–339. 10.1038/nn.4504 - DOI - PubMed
    1. Bardouille T., Herdman A. T., Chau W., Pantev C. A. (2004). Spatiotemporal approach to cortical mapping using synthetic aperture magnetometry. Brain Cogn. 54 175–176. - PubMed
    1. Bischoff-Grethe A., Ozyurt B., Busa E., Quinn B., Fennema-Notestine C., Clark C., et al. (2007). A technique for the deidentification of structural brain MR images. Hum. Brain Mapp. 28 892–903. 10.1002/hbm.20312 - DOI - PMC - PubMed
    1. Brookes M., Vrba J., Robinson S., Stevenson C., Peters A., Barnes A., et al. (2008). Optimising experimental design for MEG beamformer imaging. Neuroimage 39 1788–1802. 10.1016/j.neuroimage.2007.09.050 - DOI - PubMed

LinkOut - more resources