. 2018 Aug 22:12:66.
doi: 10.3389/fncir.2018.00066. eCollection 2018.

Intersectional Strategies for Targeting Amacrine and Ganglion Cell Types in the Mouse Retina

Affiliations

Intersectional Strategies for Targeting Amacrine and Ganglion Cell Types in the Mouse Retina

Andrew Jo et al. Front Neural Circuits. .

Abstract

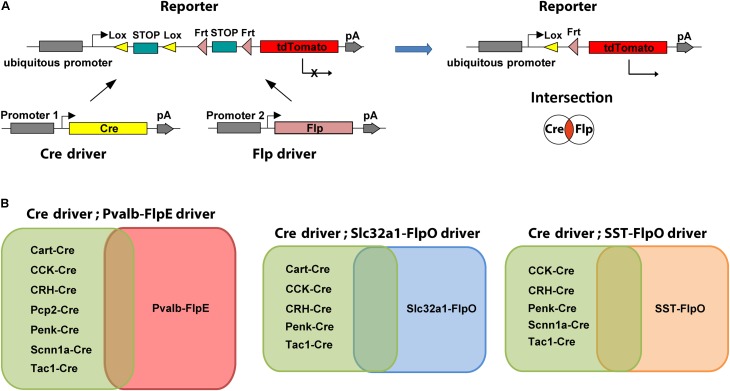
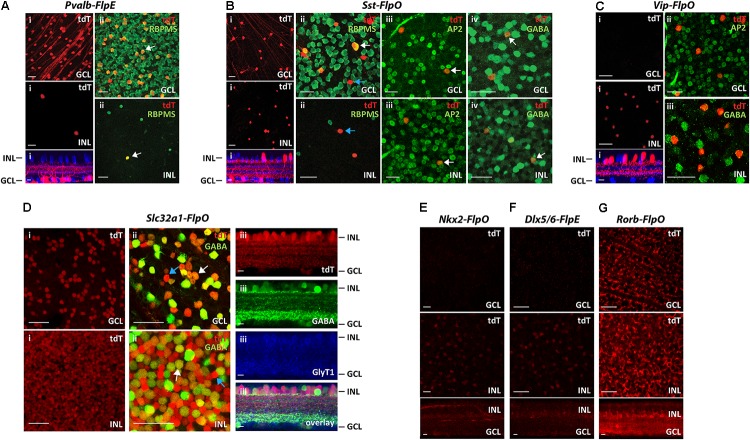
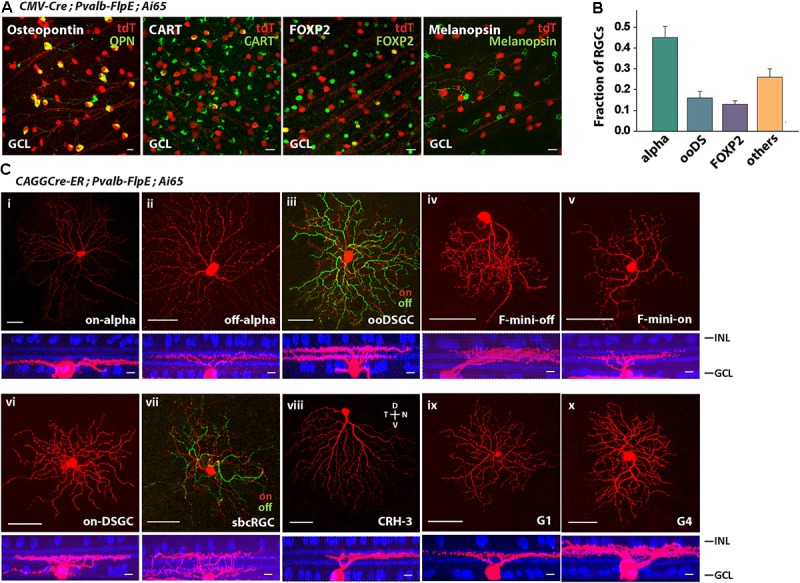
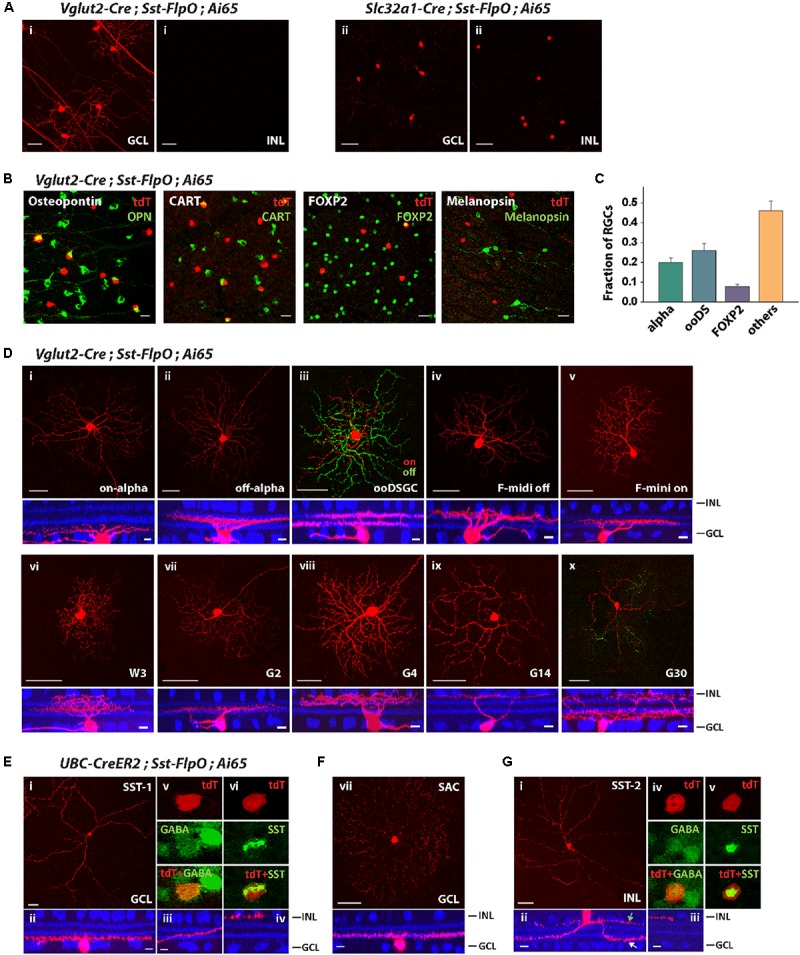
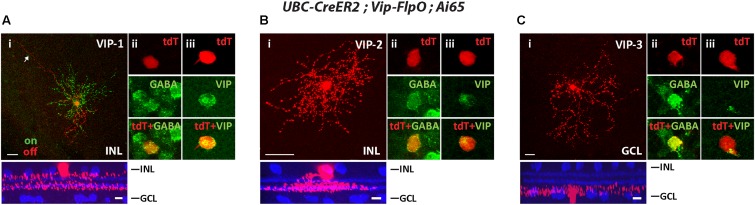
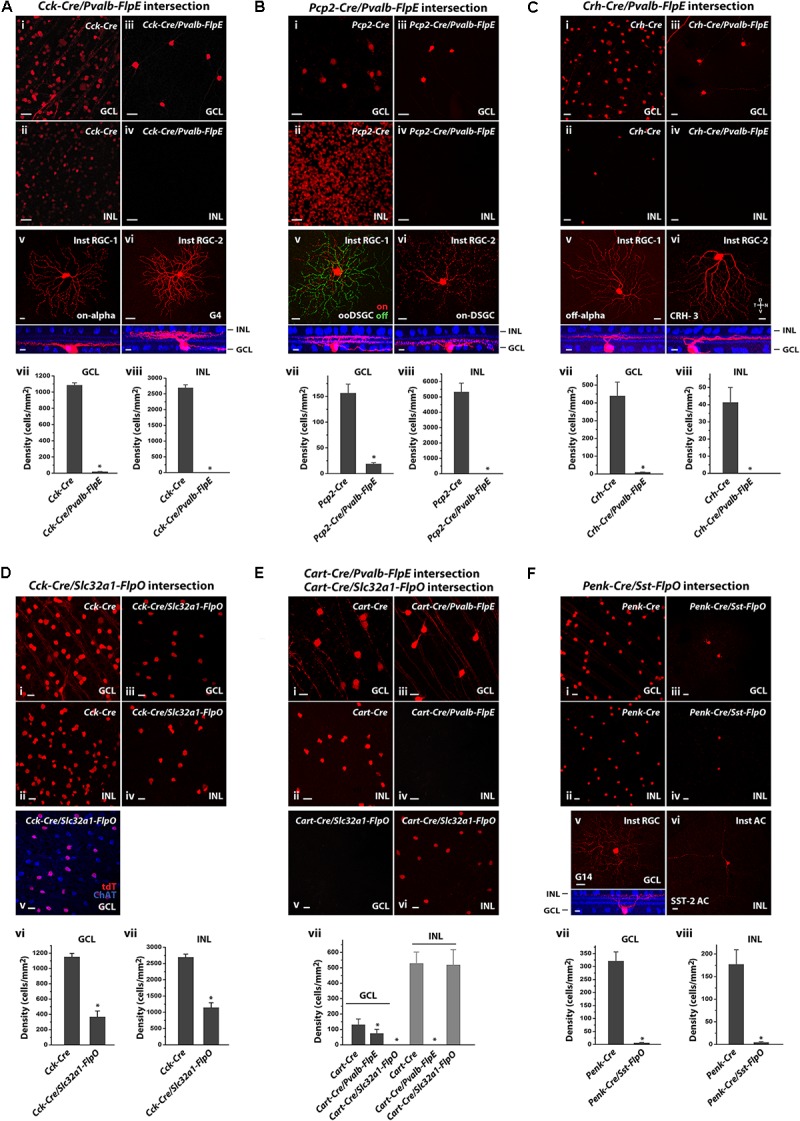
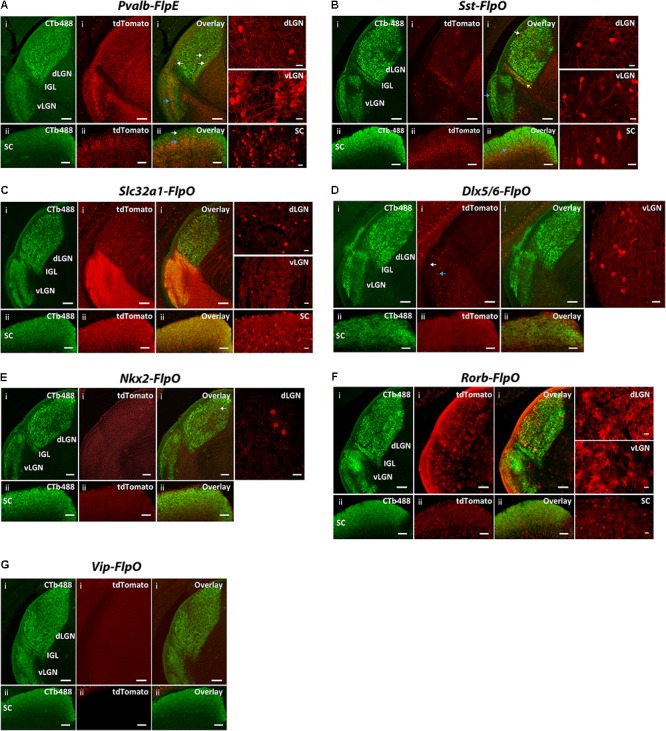
The mammalian retina harbors over 100 different cell types. To understand how retinal circuits work, it is essential to systematically access each type. A widely used approach for achieving targeted transgene expression exploits promoter-driven Cre lines. However, Cre expression in a given transgenic line in the retina and elsewhere in the brain is rarely confined to a single cell type, contributing ambiguity to the interpretation of results from broadly applied manipulations. To obtain unambiguous information about retinal processing, it is desirable to have strategies for further restricting transgene expression to a few or even to a single cell type. We employed an intersectional strategy based on a Cre/Flp double recombinase system to target amacrine and ganglion cell types in the inner retina. We analyzed expression patterns in seven Flp drivers and then created combinational mouse lines by selective cross breeding with Cre drivers. Breeding with Flp drivers can routinely remove labeling from more than 90% of the cells in Cre drivers, leading to only a handful cell types, typically 2-3, remaining in the intersection. Cre/Flp combinatorial mouse lines enabled us to identify and anatomically characterize retinal cell types with greater ease and demonstrated the feasibility of intersectional strategies in retinal research. In addition to the retina, we examined Flp expression in the lateral geniculate nucleus and superior colliculus. Our results establish a foundation for future application of intersectional strategies in the retina and retino-recipient regions.

Keywords: Cre; Flp; amacrine cell; ganglion cell; intersection; retina.


Figures

FIGURE 1
FIGURE 1
Intersectional strategy with Cre/Flp dual recombinase. (A) Schematic diagram of the intersectional strategy with Cre/Flp dual recombinase. The Cre driver line uses gene specific promoter 1, the Flp driver line uses gene specific promoter 2, and the double reporter uses a ubiquitous promoter (left). Expression of tdTomato in the reporter line (Ai65) is prevented by lox- and frt-flanked STOP cassettes. Following removal of both STOP cassettes, tdTomato is expressed in the cells that are in the overlap or “intersection” of the two populations of neurons targeted by either the Cre driver or the Flp driver (right). (B) Intersectional strategies provide flexibility for targeting specific cell types. Each Flp line can be crossed with many Cre lines to create multiple intersections.
FIGURE 2
FIGURE 2
Distribution of FLP-expressing cells in 7 Flp drivers. Each Flp driver was crossed with CMV-Cre and Ai65 mice. (A) Pvalb-FlpE driver. (i) FLPe expressing cells labeled with tdTomato (tdT, red) were observed in the GCL (top) with only a few cells in the INL (middle). Bottom: side view with ChAT (blue). (ii) Staining for the RGC marker RBPMS (green) confirmed that all of the tdTomato-labeled cells (tdT, red) in the GCL and the INL were RGCs. White arrows point to example cells that express RBPMS. (B) Sst-FlpO driver. (i) tdTomato-labeled cells were distributed in both the GCL (top) and the INL (middle). Bottom: side view with ChAT (blue).(ii) RBPMS staining (green). SST+ RGCs were found in the GCL, but not in the INL. White arrow indicates a RBPMS+ cell (RGC), blue arrow indicates a RBPMS- cell (presumably an amacrine cell). (iii) An amacrine cell marker, AP-2 (green) overlaps with SST+ amacrine cells in both the GCL and the INL. White arrows indicate example cells that express AP2. (iv) GABA staining (green). White arrows indicate example cells expressing GABA. SST+ amacrine cells in both GCL and INL were GABAergic. (C) Vip-FlpO driver. (i) A majority of the targeted cells (red) in the Vip-FlpO driver were located in the INL (middle). Bottom: side view with ChAT (blue). These presumptive GABAergic amacrine cells were positive for both AP2 (ii) and GABA staining (iii). (D) Slc32a1-FlpO driver. (i) Labeling density was high in both the GCL and INL. (ii) Double labeling for tdTomato (red) and GABA (green). In the GCL, ∼80% of cells were GABAergic, whereas in the INL, ∼50% of tdT cells were GABAergic. Examples of GABAergic and non-GABAergic cells (presumably glycinergic amacrine cells) are indicated by white and blue arrows, respectively.(iii) Vertical sections showed that tdTomato-labeled cells were either GABAergic (green, GABA staining) or glycinergic (blue, GlyT1 staining). (E,F) Nkx2-FlpO driver(E) and Dlx5/6-FlpE driver (F) showed very little labeling in both the GCL and the INL. (G) Rorb-FlpO driver showed broad labeling in the GCL and INL, with the strongest labeling in Müller cells. Scale bar, 40 μm for flat-mount view, 10 μm for side view.
FIGURE 3
FIGURE 3
The Pvalb-FlpE driver targeted multiple RGC types. (A) The Pvalb-FlpE driver was crossed with CMV-Cre and Ai65 mice. Immunostainings were performed by using antibody markers for 4 different RGC types: Osteopontin for alpha RGCs, CART for ooDSGCs, FOXP2 for F-RGCs, and melanopsin for ipRGCs. Scale bar, 20 μm. (B) Proportions of RGC types targeted in the Pvalb-FlpE driver. n = 6 retinas from 6 animals (6 litters). (C) RGC types extracted from CAGGCre-ER;Pvalb-FlpE;Ai65 retinas without tamoxifen administration. Flat-mount view (top) and side view (bottom) with ChAT (blue) labeling. Scale bar: 50 μm for the flat-mount view, 10 μm for the side view.
FIGURE 4
FIGURE 4
The Sst-FlpO driver targeted both RGCs and ACs. (A) (i) To identify targeted RGCs, the Sst-FlpO driver was crossed with Vglut2-Cre and Ai65 reporter mice. (ii) To identify targeted amacrine cells, the Sst-FlpO driver was crossed with Slc32a1-Cre and Ai65 mice. Scale bar, 50μm. (B) Staining for RGC markers (green). RGC constituents were probed with antibodies against Osteopontin, CART, FOXP2 and melanopsin in the Vglut2-Cre;Sst-FlpO;Ai65 retinas. Scale bar, 20 μm. (C) Proportions of RGC types targeted in the Sst-FlpO driver. n = 7 retinas from 7 animals (6 litters). (D) Individual RGC types extracted from the Vglut2-Cre;Sst-FlpO;Ai65 retinas. Flat-mount views (top) and side views (bottom) with ChAT (blue). Scale bar: 50 μm for the flat-mount view, 10 μm for the side view. (E–G) Amacrine cell types extracted from the UBC-CreER2;Sst-FlpO;Ai65 retinas, without tamoxifen administration. (E) Representative images of an SST-1 AC. (i) Flat-mount view of the soma and surrounding processes. (ii) Side view of the soma and surrounding “dendrite-like” and “axon-like” processes. (iii) Axon-like processes traveled across the IPL and ended at the INL border (iv). An SST-1 AC was co-labeled with antibodies against GABA (v) and SST (vi). (F) A starburst amacrine cell (SAC) in the GCL. Flat-mount view (top) and side view (bottom) with ChAT (blue). (G) SST-2 AC. Flat-mount view of the soma and surrounding processes. (ii) Side view of the soma and surrounding dendrite-like (white arrow) and axon-like processes (green arrow). (iii) Axon-like process end at the INL border. An SST-2 AC was co-labeled with antibodies against GABA (iv) and SST (v). Scale bar for (E–G): 50 μm for the flat-mount view, 10 μm for the side view.
FIGURE 5
FIGURE 5
The Vip-FlpO driver targeted 3 types of ACs. The Vip-FlpO driver was crossed with UBC-CreER2 and Ai65, 20 μg tamoxifen was administered to achieve sparse labeling of ACs. Representative images for VIP-1 AC (A), VIP-2 AC (B), and VIP-3 AC (C) are shown in flat-mount view (top) and side view (bottom) with ChAT (blue) in (i). Arrow in (Ai) shows the “tail” of the VIP-1 AC. Sections were co-labeled with antibodies against GABA (green) (ii) and VIP (green) (iii). Scale bar: 25 μm for flat-mount view, 10 μm for side view.
FIGURE 6
FIGURE 6
Intersectional strategies to restrict labeling of retinal cell subpopulations. (A) Cck-Cre driver alone and in intersection with the Pvalb-FlpE driver. (i,ii) Distribution of tdTomato-labeled cells in the GCL (i) and the INL (ii) in the Cck-Cre driver crossed with the Ai9 reporter line. (iii,iv) Distribution of tdTomato-labeled cells from the Cck-Cre;Pvalb-FlpE;Ai65 intersection. (v,vi) Examples of individual cell types within the Cck/Pvalb intersection. Flat-mount view (top) and side view (bottom) with ChAT (blue). (vii,viii) Cell labeling density in the Cck-Cre and the Cck-Cre/Pvalb-FlpE intersection for the GCL (vii) or the INL (viii). n = 6 retinas from 6 animals (4 litters) for the Cck-Cre;Ai9. n = 6 retinas from 6 animals (5 litters) for the Cck-Cre;Pvalb-FlpE;Ai65. p < 0.05, two-tailed t-test. (B) Pcp2-Cre driver alone and in intersection with the Pvalb-FlpE driver. (i,ii) labeling of Pcp2-Cre mice by crossing with the Ai9 reporter. (iii,iv) Intersection of Pcp2-Cre and Pvalb-FlpE in the Ai65 reporter. (v,vi) Flat mount views (top) and side views (bottom) of the cell types within the Pcp2/Pvalb intersection. (vii,viii) Cell labeling density in the Pcp2-Cre and the Pcp2-Cre/Pvalb-FlpE intersection for the GCL (vii) or the INL (viii). n = 6 retinas from 6 animals (4 litters) for the Pcp2-Cre;Ai9. n = 6 retinas from 6 animals (6 litters) for the Pcp2-Cre;Pvalb-FlpE;Ai65. p < 0.05, two-tailed t-test. (C) Crh-Cre driver alone and in intersection with the Pvalb-FlpE driver. (i,ii) Crh-Cre driver expression as reported by Ai9 mice. (iii,iv) Intersection of Crh-Cre and Pvalb-FlpE in the Ai65 reporter. (v,vi) Example images of flat mount views (top) and side views (bottom) of the cells within the Crh/Pvalb intersection. (vii,viii) Comparing cell labeling density in the Crh-Cre and the Crh-Cre/Pvalb-FlpE intersection for the GCL (vii) or the INL (viii). n = 7 retinas from 7 animals (5 litters) for the Crh-Cre;Ai9. n = 7 retinas from 7 animals (5 litters) for the Crh-Cre;Pvalb-FlpE;Ai65. p < 0.05, two-tailed t-test. (D) Cck-Cre driver alone and Cck-Cre/Slc32a1-FlpO intersection. (i,ii) Cck-Cre driver crossed with the Ai9 reporter. (iii,iv) Intersection of Cck-Cre and Slc32a1-FlpO reported in Ai65 mice. (v) Cck-Cre/Slc32a1-FlpO intersection (red) in the GCL counter-stained with an antibody against ChAT (blue). (vi,vii) Cell labeling density in the Cck-Cre and the Cck-Cre/Slc32a1-FlpO intersection for the GCL (vi) or the INL (vii). n = 6 retinas from 6 animals (5 litters) for the Cck-Cre;Ai9. n = 6 retinas from 6 animals (5 litters) for the Cck-Cre;Slc32a1-FlpO;Ai65. p < 0.05, two-tailed t-test. (E) Cart-Cre driver alone and in intersection with Pvalb-FlpE or Slc32a1-FlpO. (i,ii) Cart-Cre driver with Ai9 reporter. (iii,iv) Cart-Cre/Pvalb-FlpE intersection removed labeling from amacrine cells. (v,vi) Cart-Cre/Slc32a1-FlpO intersection removed labeling from RGCs. (vii) Cell labeling density in Cart-Cre alone, Cart-Cre/Pvalb-FlpE intersection, and Cart-Cre/Slc32a1-FlpO intersection for the GCL (dark gray) or the INL (gray). n = 8 retinas from 8 animals (5 litters) for the Cart-Cre;Ai9. n = 8 retinas from 8 animals (6 litters) for the Cart-Cre;Pvalb-FlpE;Ai65. n = 8 retinas from 8 animals (6 litters) for the Cart-Cre;Slc32a1-FlpO;Ai65. p < 0.05, two-tailed t-test. (F) Penk-Cre driver alone and Penk-Cre /Sst-FlpO intersection. (i,ii) Penk-Cre driver with Ai9 reporter. (iii,iv) Intersection of Penk-Cre and Sst-FlpO in the Ai65 reporter. (v,vi) Example images of individual cell types within the Penk/Sst intersection. Flat-mount view (top) and side view (bottom) with ChAT (blue). (vii,viii) Cell labeling density in the Penk-Cre and the Penk/Sst intersection for the GCL (vii) or the INL (viii). n = 7 retinas from 7 animals (5 litters) for the Penk-Cre;Ai9. n = 7 retinas from 7 animals (5 litters) for the Penk-Cre;Sst-FlpO;Ai65.p < 0.05, two-tailed t-test. Scale bar, 20 μm for flat-mount view, 10 μm for side view.
FIGURE 7
FIGURE 7
Expression patterns of Flp drivers in the SC and the LGN. FLP-expressing cells were labeled with tdTomato (red) in CMV-Cre;Flp;Ai65 mice. Retino-recipient zones were labeled with cholera toxin B conjugated to Alexa Fluor 488 (CTb-488) (green) injected to the eyes. (A) Pvalb-FlpE driver. In the SC, FLPe strongly expressed in the deep layer (ii, blue arrow) but sparsely expressed in the superficial layer (ii, white arrow). The middle layer of vLGN also strongly expressed FLPe (i, blue arrow). The dLGN showed very sparse labeling (i, white arrows). Intense tdTomato background comes from axons of FLPe+ RGCs. (B) Sst-FlpO driver. Strong FLPo expression was found in the deep layer of the SC (ii, blue arrow). Only sparse labeling was found in the vLGN and dLGN, while most of the labeled cells were in the superficial layer (i, white arrow for dLGN, blue arrow for vLGN). There was also moderate labeling in IGL (yellow arrow). (C) Slc32a1-FlpO targeted FLPo expression broadly to all the layers in the LGN and SC. (D) Dlx5/6-FlpO driver. FLPo expression was sparse and restricted primarily to the superficial (i, white arrow) and middle layer of the vLGN (i, blue arrow). No FLPo labeling was found in SC and dLGN. (E) Nkx2-FlpO driver. In the dLGN, sparely labeled cells were found in the core region (i, arrow). There was no labeling in other areas. (F) Rorb-FlpO driver. FLPo expression was observed in neurons in all layers in the SC (ii), as well as glial cells in the entire LGN including both the dLGN and the vLGN (i). (G) Vip-FlpO driver did not express in either the LGN or the SC. For each driver, examples of enlarged labeling area are shown on the right. Scale bar: 100 μm for the LGN, 50 μm for the SC, 20 μm for the enlarged regions.

Similar articles

Cited by

References

    1. Akrouh A., Kerschensteiner D. (2015). Morphology and function of three VIP-expressing amacrine cell types in the mouse retina. J. Neurophysiol. 114 2431–2438. 10.1152/jn.00526.2015 - DOI - PMC - PubMed
    1. Allen W. E., Luo L. (2015). Intersectional illumination of neural circuit function. Neuron 85 889–892. 10.1016/j.neuron.2015.02.032 - DOI - PMC - PubMed
    1. Atasoy D., Aponte Y., Su H. H., Sternson S. M. (2008). A FLEX switch targets Channelrhodopsin-2 to multiple cell types for imaging and long-range circuit mapping. J. Neurosci. 28 7025–7030. 10.1523/JNEUROSCI.1954-08.2008 - DOI - PMC - PubMed
    1. Baden T., Berens P., Franke K., Roman Roson M., Bethge M., Euler T. (2016). The functional diversity of retinal ganglion cells in the mouse. Nature 529 345–350. 10.1038/nature16468 - DOI - PMC - PubMed
    1. Bassett E. A., Pontoriero G. F., Feng W., Marquardt T., Fini M. E., Williams T., et al. (2007). Conditional deletion of activating protein 2alpha (AP-2alpha) in the developing retina demonstrates non-cell-autonomous roles for AP-2alpha in optic cup development. Mol. Cell. Biol. 27 7497–7510. 10.1128/MCB.00687-07 - DOI - PMC - PubMed

Publication types

LinkOut - more resources