Periplaneta americana Ameliorates Dextran Sulfate Sodium-Induced Ulcerative Colitis in Rats by Keap1/Nrf-2 Activation, Intestinal Barrier Function, and Gut Microbiota Regulation
- PMID: 30186174
- PMCID: PMC6113651
- DOI: 10.3389/fphar.2018.00944
Periplaneta americana Ameliorates Dextran Sulfate Sodium-Induced Ulcerative Colitis in Rats by Keap1/Nrf-2 Activation, Intestinal Barrier Function, and Gut Microbiota Regulation
Abstract
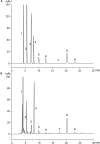
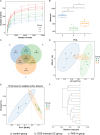
Periplaneta americana, a magic medicinal insect being present for over 300 million years, exhibits desirable therapeutic outcome for gastrointestinal ulcer treatment. Nowadays, P. americana ethanol extract (PAE) has been shown to ameliorate ulcerative colitis (UC) by either single-use or in combination with other therapeutic agents in clinics. However, its underlying mechanisms are still seldom known. Herein, we investigated the anti-UC activity of PAE by alleviating intestinal inflammation and regulating the disturbed gut microbiota structure in dextran sulfate sodium (DSS)-induced UC rats. Based on multiple constitute analyses by HPLC for quality control, PAE was administrated to DSS-induced UC rats by oral gavage for 2 weeks. The anti-UC effect of PAE was evaluated by inflammatory cytokine production, immunohistochemical staining, and gut microbiota analysis via 16S rRNA sequencing. As a result, PAE remarkably attenuated DSS-induced UC in rats. The colonic inflammatory responses manifested as decreased colonic atrophy, intestinal histopathology scores and inflammatory cytokines. In addition, PAE improved the intestinal barrier function via activating Keap1/Nrf-2 pathway and promoting the expressions of tight junction proteins. It was observed that the UC rats showed symptoms of gut microbial disturbance, i.e., the increased Firmicutes/Bacteroidetes ratio and the significantly decreased probiotics such as Lactobacillus, Roseburia, and Pectobacterium, which were negatively correlated with these detected pro-inflammatory cytokines (secreted by immune CD4+ T cells, and including IFN-γ, TNF-α, IL-6, IL-8, IL-17, IL-1β). Besides, PAE administration regulated the abnormal intestinal microbial composition and made it similar to that in normal rats. Therefore, PAE could attenuate the DSS-induced UC in rats, by means of ameliorating intestinal inflammation, improving intestinal barrier function, and regulating the disturbed gut microbiota, especially improving beneficial intestinal flora growth, modulating the flora structure, and restoring the intestinal-immune system.
Keywords: 16S rRNA; Periplaneta americana; gut microbiota; intestinal immunity; ulcerative colitis.
Figures


 P < 0.05 LPS + PAE groups vs. LPS-stimulated group (n = 6 per group).
 P < 0.05 model group vs. PAE-H group (n = 6 per group).

 P < 0.05 model group vs. PAE-H group (n = 6 per group).
 P < 0.05 model group vs. PAE-treated group (n = 6 per group).


Similar articles
-
2,3,5,4'-Tetrahydroxystilbene-2-O-β-D-glucoside, a major bioactive component from Polygoni multiflori Radix (Heshouwu) suppresses DSS induced acute colitis in BALb/c mice by modulating gut microbiota.Biomed Pharmacother. 2021 May;137:111420. doi: 10.1016/j.biopha.2021.111420. Epub 2021 Feb 23. Biomed Pharmacother. 2021. PMID: 33761623
-
Phloretin ameliorates dextran sulfate sodium-induced ulcerative colitis in mice by regulating the gut microbiota.Pharmacol Res. 2019 Dec;150:104489. doi: 10.1016/j.phrs.2019.104489. Epub 2019 Nov 2. Pharmacol Res. 2019. PMID: 31689519
-
Paeonol alleviates ulcerative colitis in mice by increasing short-chain fatty acids derived from Clostridium butyricum.Phytomedicine. 2023 Nov;120:155056. doi: 10.1016/j.phymed.2023.155056. Epub 2023 Sep 9. Phytomedicine. 2023. PMID: 37703619
-
Changes in serum inflammatory cytokine levels and intestinal flora in a self-healing dextran sodium sulfate-induced ulcerative colitis murine model.Life Sci. 2020 Dec 15;263:118587. doi: 10.1016/j.lfs.2020.118587. Epub 2020 Oct 13. Life Sci. 2020. PMID: 33065145 Review.
-
The mechanism of traditional medicine in alleviating ulcerative colitis: regulating intestinal barrier function.Front Pharmacol. 2023 Oct 9;14:1228969. doi: 10.3389/fphar.2023.1228969. eCollection 2023. Front Pharmacol. 2023. PMID: 37876728 Free PMC article. Review.
Cited by
-
Indigo Naturalis Ameliorates Dextran Sulfate Sodium-Induced Colitis in Mice by Modulating the Intestinal Microbiota Community.Molecules. 2019 Nov 12;24(22):4086. doi: 10.3390/molecules24224086. Molecules. 2019. PMID: 31726738 Free PMC article.
-
Cockroaches: a potential source of novel bioactive molecule(s) for the benefit of human health.Appl Entomol Zool. 2023;58(1):1-11. doi: 10.1007/s13355-022-00810-9. Epub 2022 Dec 15. Appl Entomol Zool. 2023. PMID: 36536895 Free PMC article. Review.
-
Fucose Ameliorates Tryptophan Metabolism and Behavioral Abnormalities in a Mouse Model of Chronic Colitis.Nutrients. 2020 Feb 11;12(2):445. doi: 10.3390/nu12020445. Nutrients. 2020. PMID: 32053891 Free PMC article.
-
Unravelling the potential of insects for medicinal purposes - A comprehensive review.Heliyon. 2023 Apr 29;9(5):e15938. doi: 10.1016/j.heliyon.2023.e15938. eCollection 2023 May. Heliyon. 2023. PMID: 37206028 Free PMC article. Review.
-
Kuijieyuan Decoction Improved Intestinal Barrier Injury of Ulcerative Colitis by Affecting TLR4-Dependent PI3K/AKT/NF-κB Oxidative and Inflammatory Signaling and Gut Microbiota.Front Pharmacol. 2020 Jul 29;11:1036. doi: 10.3389/fphar.2020.01036. eCollection 2020. Front Pharmacol. 2020. PMID: 32848725 Free PMC article.
References
-
- Amer M., Nadeem M., Nazir S. U. R., Fakhar M., Abid F., Ain Q. U., et al. (2018). Probiotics and their use in inflammatory bowel disease. Altern. Ther. Health Med. 24 16–23. - PubMed
LinkOut - more resources
Full Text Sources
Other Literature Sources
Research Materials

