

Local and Regional Scale Heterogeneity Drive Bacterial Community Diversity and Composition in a Polar Desert
- PMID: 30186257
- PMCID: PMC6110917
- DOI: 10.3389/fmicb.2018.01928
Local and Regional Scale Heterogeneity Drive Bacterial Community Diversity and Composition in a Polar Desert
Abstract
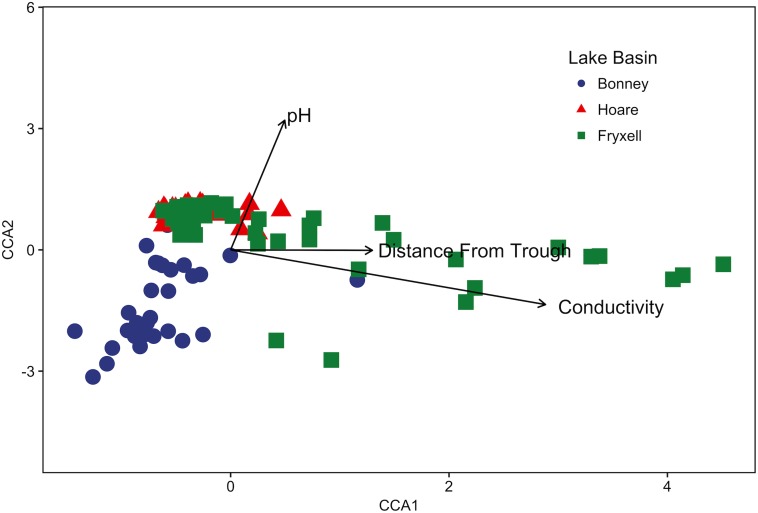
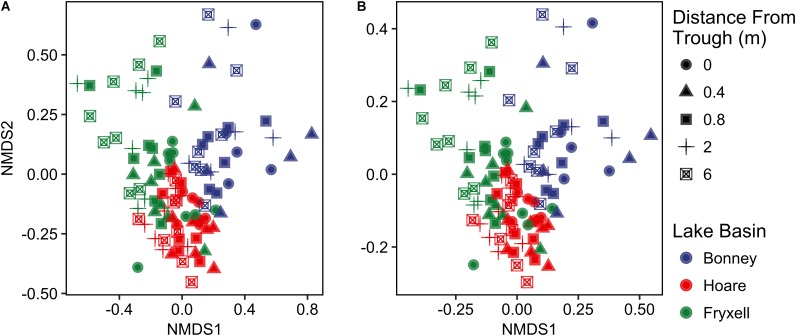
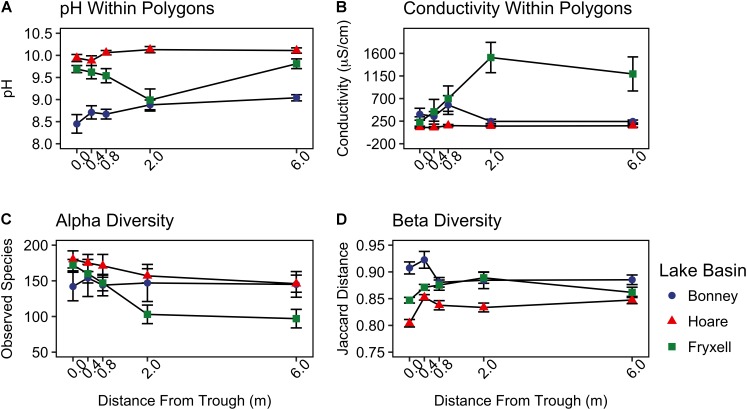
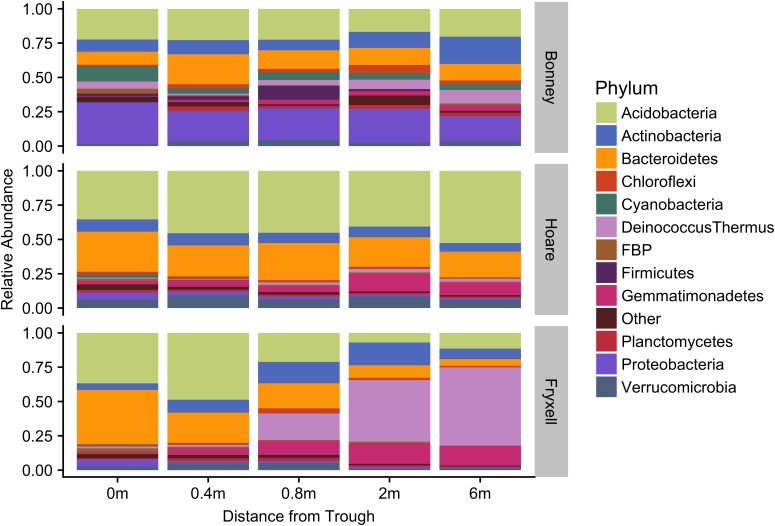
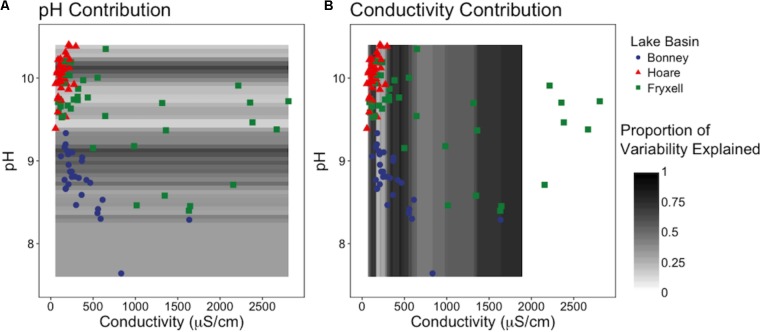
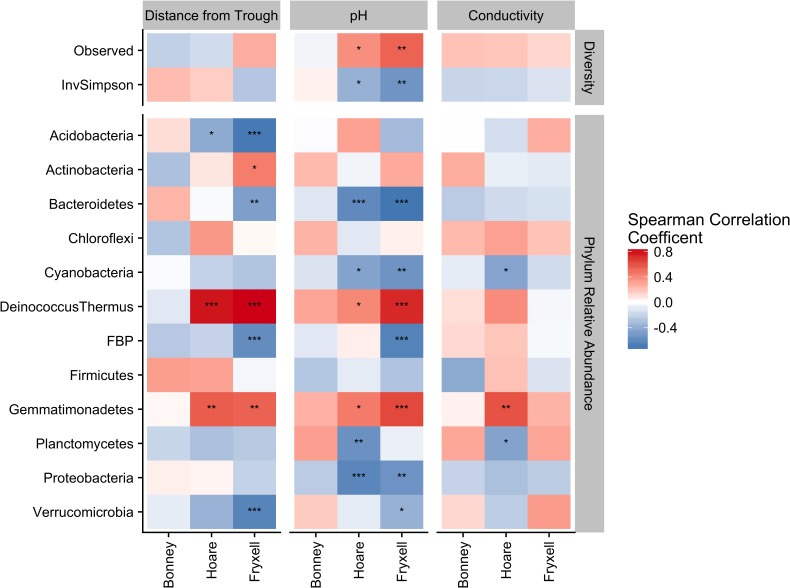
The distribution of organisms in an environment is neither uniform nor random but is instead spatially patterned. The factors that control this patterning are complex and the underlying mechanisms are poorly understood. Soil microbes are critical to ecosystem function but exhibit highly complex distributions and community dynamics due in large part to the scale-dependent effects of environmental heterogeneity. To better understand the impact of environmental heterogeneity on the distribution of soil microbes, we sequenced the 16S rRNA gene from bacterial communities in the microbe-dominated polar desert ecosystem of the McMurdo Dry Valleys (MDV), Antarctica. Significant differences in key edaphic variables and alpha diversity were observed among the three lake basins of the Taylor Valley (Kruskal-Wallis; pH: χ2 = 68.89, P < 0.001, conductivity: χ2 = 35.03, P < 0.001, observed species: χ2 = 7.98, P = 0.019 and inverse Simpson: χ2 = 18.52, P < 0.001) and each basin supported distinctive microbial communities (ANOSIM R = 0.466, P = 0.001, random forest ratio of 14.1). However, relationships between community structure and edaphic characteristics were highly variable and contextual, ranging in magnitude and direction across regional, basin, and local scales. Correlations among edaphic factors (pH and soil conductivity) and the relative abundance of specific phyla were most pronounced along local environmental gradients in the Lake Fryxell basin where Acidobacteria, Bacteroidetes, and Proteobacteria declined while Deinococcus-Thermus and Gemmatimonadetes increased with soil conductivity (all P < 0.1). Species richness was most strongly related to the soil conductivity gradient present within this study system. We suggest that the relative importance of pH versus soil conductivity in structuring microbial communities is related to the length of edaphic gradients and the spatial scale of sampling. These results highlight the importance of conducting studies over large ranges of key environmental gradients and across multiple spatial scales to assess the influence of environmental heterogeneity on the composition and diversity of microbial communities.
Keywords: 16S rRNA genes; McMurdo Dry Valleys; environmental heterogeneity; gradient analysis; polar desert; spatial scale.
Figures
Similar articles
-
Factors Controlling Soil Microbial Biomass and Bacterial Diversity and Community Composition in a Cold Desert Ecosystem: Role of Geographic Scale.PLoS One. 2013 Jun 18;8(6):e66103. doi: 10.1371/journal.pone.0066103. Print 2013. PLoS One. 2013. PMID: 23824063 Free PMC article.
-
Bacterial community composition of divergent soil habitats in a polar desert.FEMS Microbiol Ecol. 2014 Aug;89(2):490-4. doi: 10.1111/1574-6941.12306. Epub 2014 Mar 21. FEMS Microbiol Ecol. 2014. PMID: 24579975
-
Soil pH and electrical conductivity are key edaphic factors shaping bacterial communities of greenhouse soils in Korea.J Microbiol. 2016 Dec;54(12):838-845. doi: 10.1007/s12275-016-6526-5. Epub 2016 Nov 26. J Microbiol. 2016. PMID: 27888456
-
Primary productivity as a control over soil microbial diversity along environmental gradients in a polar desert ecosystem.PeerJ. 2017 Jul 25;5:e3377. doi: 10.7717/peerj.3377. eCollection 2017. PeerJ. 2017. PMID: 28761776 Free PMC article.
-
Ranking environmental and edaphic attributes driving soil microbial community structure and activity with special attention to spatial and temporal scales.mLife. 2024 Mar 26;3(1):21-41. doi: 10.1002/mlf2.12116. eCollection 2024 Mar. mLife. 2024. PMID: 38827504 Free PMC article. Review.
Cited by
-
Uncovering the Uncultivated Majority in Antarctic Soils: Toward a Synergistic Approach.Front Microbiol. 2019 Feb 15;10:242. doi: 10.3389/fmicb.2019.00242. eCollection 2019. Front Microbiol. 2019. PMID: 30828325 Free PMC article. Review.
-
Unique Geothermal Chemistry Shapes Microbial Communities on Mt. Erebus, Antarctica.Front Microbiol. 2022 May 3;13:836943. doi: 10.3389/fmicb.2022.836943. eCollection 2022. Front Microbiol. 2022. PMID: 35591982 Free PMC article.
-
Geology defines microbiome structure and composition in nunataks and valleys of the Sør Rondane Mountains, East Antarctica.Front Microbiol. 2024 Feb 6;15:1316633. doi: 10.3389/fmicb.2024.1316633. eCollection 2024. Front Microbiol. 2024. PMID: 38380088 Free PMC article.
-
Soil resource availability is much more important than soil resource heterogeneity in determining the species diversity and abundance of karst plant communities.Ecol Evol. 2021 Oct 28;11(23):16680-16692. doi: 10.1002/ece3.8285. eCollection 2021 Dec. Ecol Evol. 2021. PMID: 34938465 Free PMC article.
-
Microbial Communities in Permafrost Soils of Larsemann Hills, Eastern Antarctica: Environmental Controls and Effect of Human Impact.Microorganisms. 2020 Aug 7;8(8):1202. doi: 10.3390/microorganisms8081202. Microorganisms. 2020. PMID: 32784619 Free PMC article.
References
-
- Arenz B. E., Blanchette R. A. (2011). Distribution and abundance of soil fungi in antarctica at sites on the peninsula, ross sea region and mcmurdo dry valleys. Soil Biol. Biochem. 43 308–315. 10.1016/j.soilbio.2010.10.016 - DOI
-
- Baker K. L., Langenheder S., Nicol G. W., Ricketts D., Killham K., Campbell C. D., et al. (2009). Environmental and spatial characterisation of bacterial community composition in soil to inform sampling strategies. Soil Biol. Biochem. 41 2292–2298. 10.1016/j.soilbio.2009.08.010 - DOI
-
- Bar-Massada A., Wood E. M. (2014). The richness–heterogeneity relationship differs between heterogeneity measures within and among habitats. Ecography 37 528–535. 10.1111/j.1600-0587.2013.00590.x - DOI
Grants and funding
LinkOut - more resources
Full Text Sources
Other Literature Sources