

Structural and Functional Alterations in the Microbial Community and Immunological Consequences in a Mouse Model of Antibiotic-Induced Dysbiosis
- PMID: 30186263
- PMCID: PMC6110884
- DOI: 10.3389/fmicb.2018.01948
Structural and Functional Alterations in the Microbial Community and Immunological Consequences in a Mouse Model of Antibiotic-Induced Dysbiosis
Abstract
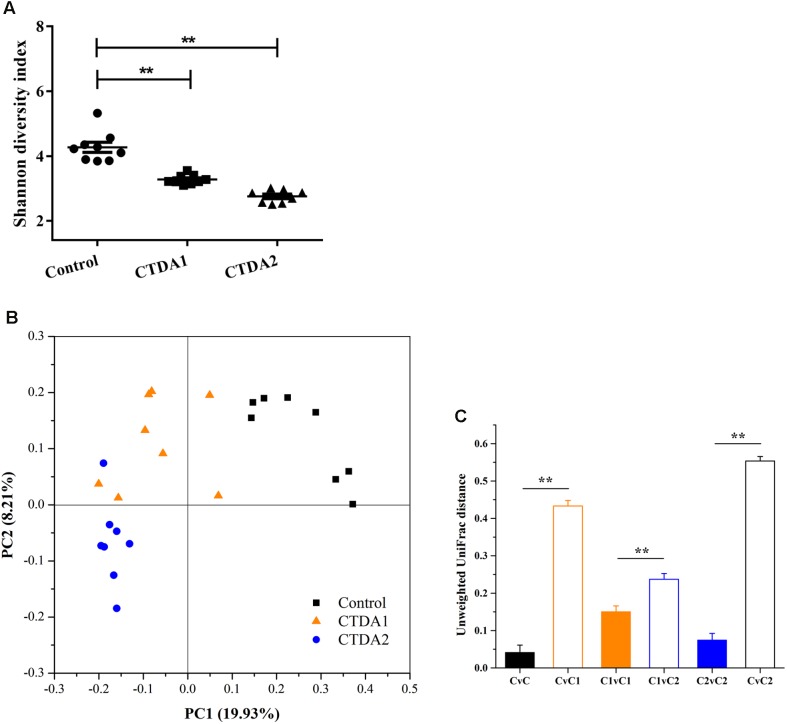
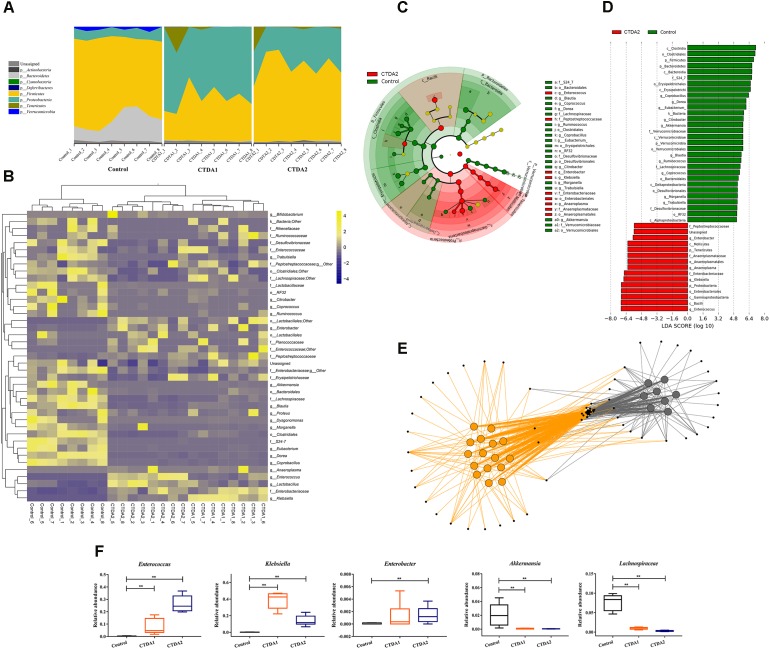
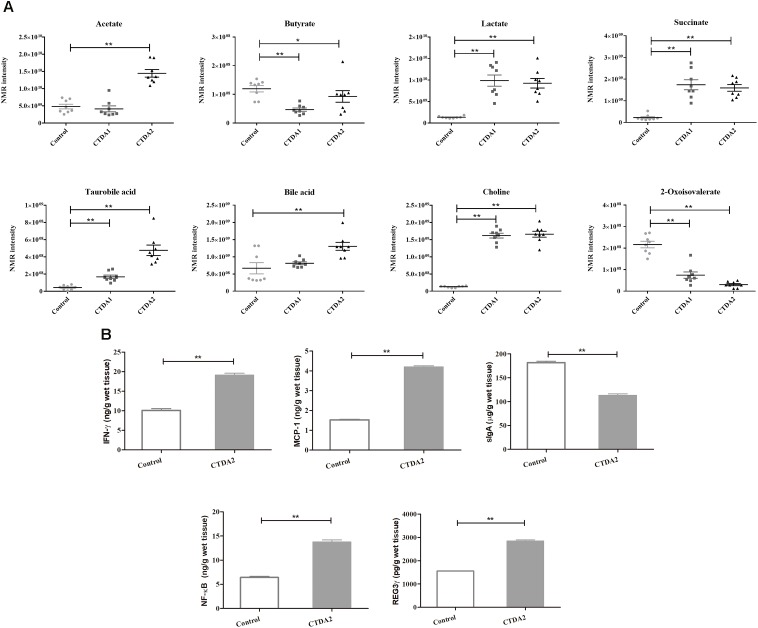
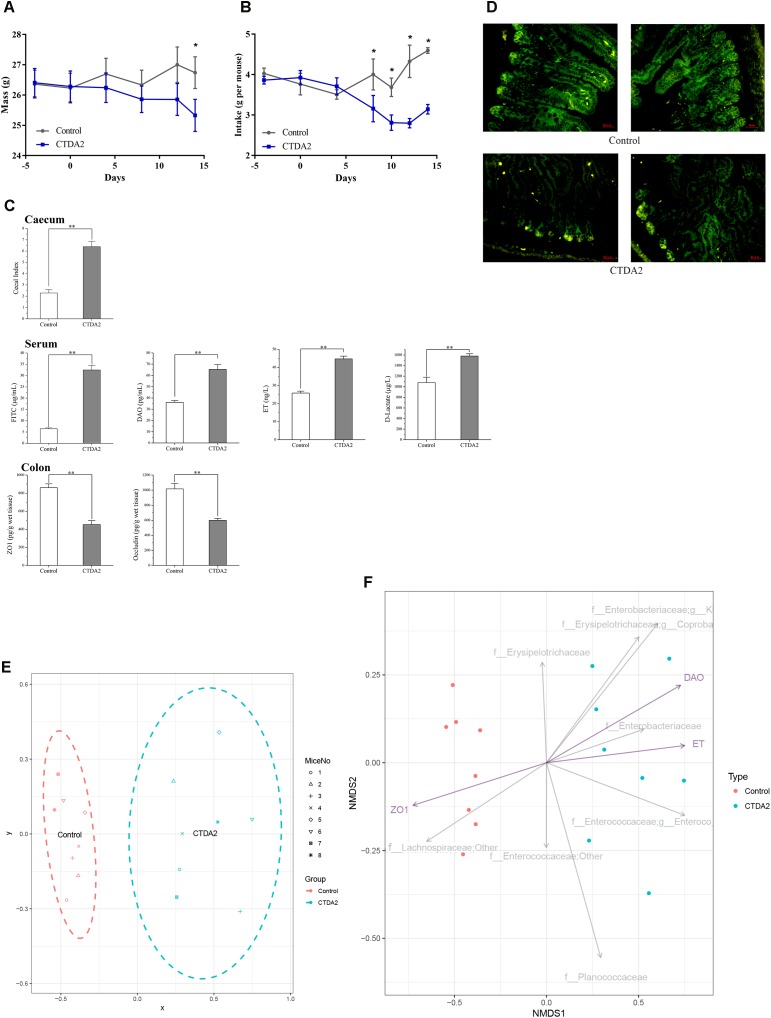
The aim of this study was to establish continuous therapeutic-dose ampicillin (CTDA)-induced dysbiosis in a mouse model, mimicking typical adult exposure, with a view to using this to assess its impact on gut microbiota, intestinal metabolites and host immune responses. Mice were exposed to ampicillin for 14 days and antibiotic-induced dysbiosis was evaluated by alteration of microbiota and gut permeability. The cecal index was increased in the CTDA group, and the gut permeability indicated by fluorescent dextran, endotoxin and D-Lactate in the serum was significantly increased after antibiotic use. The tight-junction proteins ZO-1 and occludin in the colon were reduced to half the control level in CTDA. We found that alpha-diversity was significantly decreased in mice receiving CTDA, and microbial community structure was altered compared with the control. Key taxa were identified as CTDA-specific, and the relative abundance of Enterococcus and Klebsiella was particularly enriched while Lachnospiraceae, Coprobacillus and Dorea were depleted after antibiotic treatment. In particular, a significant increase in succinate and a reduction in butyrate was detected in CTDA mice, and the triggering of NF-κB enhancement reflected that the host immune response was influenced by ampicillin use. The observed perturbation of the microbiota was accompanied by modulation of inflammatory state; this included increase in interferon-γ and RegIIIγ, and a decrease in secretory IgA in the colon mucosa. This study allowed us to identify the key taxa associated with an ampicillin-induced state of dysbiosis in mice and to characterize the microbial communities via molecular profiling. Thus, this work describes the bacterial ecology of antibiotic exposure model in combination with host physiological characteristics at a detailed level of microbial taxa.
Keywords: ampicillin; gut dysbiosis; inflammation; metabolite; mice model; microbiota.
Figures
Similar articles
-
A Polysaccharide Isolated from Dictyophora indusiata Promotes Recovery from Antibiotic-Driven Intestinal Dysbiosis and Improves Gut Epithelial Barrier Function in a Mouse Model.Nutrients. 2018 Jul 31;10(8):1003. doi: 10.3390/nu10081003. Nutrients. 2018. PMID: 30065236 Free PMC article.
-
A mixture of Lactobacillus species isolated from traditional fermented foods promote recovery from antibiotic-induced intestinal disruption in mice.J Appl Microbiol. 2018 Mar;124(3):842-854. doi: 10.1111/jam.13687. Epub 2018 Feb 6. J Appl Microbiol. 2018. PMID: 29314490
-
Saireito, a Japanese herbal medicine, alleviates leaky gut associated with antibiotic-induced dysbiosis in mice.PLoS One. 2022 Jun 15;17(6):e0269698. doi: 10.1371/journal.pone.0269698. eCollection 2022. PLoS One. 2022. PMID: 35704618 Free PMC article.
-
Role of Gut Dysbiosis in Liver Diseases: What Have We Learned So Far?Diseases. 2019 Nov 12;7(4):58. doi: 10.3390/diseases7040058. Diseases. 2019. PMID: 31726747 Free PMC article. Review.
-
Evaluating the Efficacy of Secondary Metabolites in Antibiotic-Induced Dysbiosis: A Narrative Review of Preclinical Studies.Antibiotics (Basel). 2025 Feb 1;14(2):138. doi: 10.3390/antibiotics14020138. Antibiotics (Basel). 2025. PMID: 40001382 Free PMC article. Review.
Cited by
-
Daily full spectrum light exposure prevents food allergy-like allergic diarrhea by modulating vitamin D3 and microbiota composition.NPJ Biofilms Microbiomes. 2021 May 6;7(1):41. doi: 10.1038/s41522-021-00213-8. NPJ Biofilms Microbiomes. 2021. PMID: 33958592 Free PMC article.
-
Mobility of β-Lactam Resistance Under Bacterial Co-infection and Ampicillin Treatment in a Mouse Model.Front Microbiol. 2020 Jul 7;11:1591. doi: 10.3389/fmicb.2020.01591. eCollection 2020. Front Microbiol. 2020. PMID: 32733428 Free PMC article.
-
Improvement and Recovery of Intestinal Flora Disorder Caused by Ciprofloxacin Using Lactic Acid Bacteria.Probiotics Antimicrob Proteins. 2024 Nov 20. doi: 10.1007/s12602-024-10401-5. Online ahead of print. Probiotics Antimicrob Proteins. 2024. PMID: 39565564
-
The Effects of Erchen Decoction on Gut Microbiota and Lipid Metabolism Disorders in Zucker Diabetic Fatty Rats.Front Pharmacol. 2021 Jul 22;12:647529. doi: 10.3389/fphar.2021.647529. eCollection 2021. Front Pharmacol. 2021. PMID: 34366839 Free PMC article.
-
Microbiota-gut-brain axis impairment in the pathogenesis of stroke: implication as a potent therapeutic target.Biosci Microbiota Food Health. 2023;42(3):143-151. doi: 10.12938/bmfh.2022-067. Epub 2023 Apr 24. Biosci Microbiota Food Health. 2023. PMID: 37404572 Free PMC article. Review.
References
-
- Buffie C. G., Jarchum I., Equinda M., Lipuma L., Gobourne A., Viale A., et al. (2012). Profound alterations of intestinal microbiota following a single dose of clindamycin results in sustained susceptibility to Clostridium difficile-induced colitis. Infect. Immun. 80 62–73. 10.1128/Iai.05496-11 - DOI - PMC - PubMed
Grants and funding
- BBS/E/F/00044453/BB_/Biotechnology and Biological Sciences Research Council/United Kingdom
- BBS/E/F/000PR10353/BB_/Biotechnology and Biological Sciences Research Council/United Kingdom
- BBS/E/F/000PR10356/BB_/Biotechnology and Biological Sciences Research Council/United Kingdom
- BBS/OS/NW/000006/BB_/Biotechnology and Biological Sciences Research Council/United Kingdom
LinkOut - more resources
Full Text Sources
Other Literature Sources
Miscellaneous