Metabolic Reprogramming of Clostridioides difficile During the Stationary Phase With the Induction of Toxin Production
- PMID: 30186274
- PMCID: PMC6110889
- DOI: 10.3389/fmicb.2018.01970
Metabolic Reprogramming of Clostridioides difficile During the Stationary Phase With the Induction of Toxin Production
Abstract
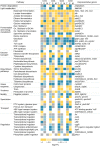
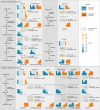
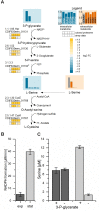
The obligate anaerobe, spore forming bacterium Clostridioides difficile (formerly Clostridium difficile) causes nosocomial and community acquired diarrhea often associated with antibiotic therapy. Major virulence factors of the bacterium are the two large clostridial toxins TcdA and TcdB. The production of both toxins was found strongly connected to the metabolism and the nutritional status of the growth environment. Here, we systematically investigated the changes of the gene regulatory, proteomic and metabolic networks of C. difficile 630Δerm underlying the adaptation to the non-growing state in the stationary phase. Integrated data from time-resolved transcriptome, proteome and metabolome investigations performed under defined growth conditions uncovered multiple adaptation strategies. Overall changes in the cellular processes included the downregulation of ribosome production, lipid metabolism, cold shock proteins, spermine biosynthesis, and glycolysis and in the later stages of riboflavin and coenzyme A (CoA) biosynthesis. In contrast, different chaperones, several fermentation pathways, and cysteine, serine, and pantothenate biosynthesis were found upregulated. Focusing on the Stickland amino acid fermentation and the central carbon metabolism, we discovered the ability of C. difficile to replenish its favored amino acid cysteine by a pathway starting from the glycolytic 3-phosphoglycerate via L-serine as intermediate. Following the growth course, the reductive equivalent pathways used were sequentially shifted from proline via leucine/phenylalanine to the central carbon metabolism first to butanoate fermentation and then further to lactate fermentation. The toxin production was found correlated mainly to fluxes of the central carbon metabolism. Toxin formation in the supernatant was detected when the flux changed from butanoate to lactate synthesis in the late stationary phase. The holistic view derived from the combination of transcriptome, proteome and metabolome data allowed us to uncover the major metabolic strategies that are used by the clostridial cells to maintain its cellular homeostasis and ensure survival under starvation conditions.
Keywords: Clostridioides difficile; Clostridium difficile; Stickland reactions; metabolism; starvation; toxin formation.
Figures


Similar articles
-
High metabolic versatility of different toxigenic and non-toxigenic Clostridioides difficile isolates.Int J Med Microbiol. 2017 Sep;307(6):311-320. doi: 10.1016/j.ijmm.2017.05.007. Epub 2017 Jun 1. Int J Med Microbiol. 2017. PMID: 28619474
-
Diverse Energy-Conserving Pathways in Clostridium difficile: Growth in the Absence of Amino Acid Stickland Acceptors and the Role of the Wood-Ljungdahl Pathway.J Bacteriol. 2020 Sep 23;202(20):e00233-20. doi: 10.1128/JB.00233-20. Print 2020 Sep 23. J Bacteriol. 2020. PMID: 32967909 Free PMC article.
-
Characterization of Clostridioides difficile DSM 101085 with A-B-CDT+ Phenotype from a Late Recurrent Colonization.Genome Biol Evol. 2020 May 1;12(5):566-577. doi: 10.1093/gbe/evaa072. Genome Biol Evol. 2020. PMID: 32302381 Free PMC article.
-
Metabolism the Difficile Way: The Key to the Success of the Pathogen Clostridioides difficile.Front Microbiol. 2019 Feb 15;10:219. doi: 10.3389/fmicb.2019.00219. eCollection 2019. Front Microbiol. 2019. PMID: 30828322 Free PMC article. Review.
-
Integration of metabolism and virulence in Clostridium difficile.Res Microbiol. 2015 May;166(4):375-83. doi: 10.1016/j.resmic.2014.10.002. Epub 2014 Oct 15. Res Microbiol. 2015. PMID: 25445566 Free PMC article. Review.
Cited by
-
Transcriptome Analysis of the Clostridioides difficile Response to Different Doses of Bifidobacterium breve.Front Microbiol. 2020 Jul 31;11:1863. doi: 10.3389/fmicb.2020.01863. eCollection 2020. Front Microbiol. 2020. PMID: 32849451 Free PMC article.
-
Elucidating dynamic anaerobe metabolism with HRMAS 13C NMR and genome-scale modeling.Nat Chem Biol. 2023 May;19(5):556-564. doi: 10.1038/s41589-023-01275-9. Epub 2023 Mar 9. Nat Chem Biol. 2023. PMID: 36894723 Free PMC article.
-
Differential View on the Bile Acid Stress Response of Clostridioides difficile.Front Microbiol. 2019 Feb 18;10:258. doi: 10.3389/fmicb.2019.00258. eCollection 2019. Front Microbiol. 2019. PMID: 30833939 Free PMC article.
-
Metabolic adaption to extracellular pyruvate triggers biofilm formation in Clostridioides difficile.ISME J. 2021 Dec;15(12):3623-3635. doi: 10.1038/s41396-021-01042-5. Epub 2021 Jun 21. ISME J. 2021. PMID: 34155333 Free PMC article.
-
Multi-omics analysis of hospital-acquired diarrhoeal patients reveals biomarkers of enterococcal proliferation and Clostridioides difficile infection.Nat Commun. 2023 Nov 25;14(1):7737. doi: 10.1038/s41467-023-43671-8. Nat Commun. 2023. PMID: 38007555 Free PMC article.
References
-
- Aboulnaga E.-H., Pinkenburg O., Schiffels J., El-Refai A., Buckel W., Selmer T. (2013). Effect of an oxygen-tolerant bifurcating butyryl coenzyme A dehydrogenase/electron-transferring flavoprotein complex from Clostridium difficile on butyrate production in Escherichia coli. J. Bacteriol. 195 3704–3713. 10.1128/JB.00321-13 - DOI - PMC - PubMed
-
- Benjamini Y., Hochberg Y. (1995). Controlling the false discovery rate: a practical and powerful approach to multiple testing. J. R. Stat. Soc. Series B Stat. Methodol. 57 289–300.
LinkOut - more resources
Full Text Sources
Other Literature Sources
Molecular Biology Databases

