

Genetic Diversity and Population Structure of the USDA Sweetpotato (Ipomoea batatas) Germplasm Collections Using GBSpoly
- PMID: 30186293
- PMCID: PMC6111789
- DOI: 10.3389/fpls.2018.01166
Genetic Diversity and Population Structure of the USDA Sweetpotato (Ipomoea batatas) Germplasm Collections Using GBSpoly
Abstract
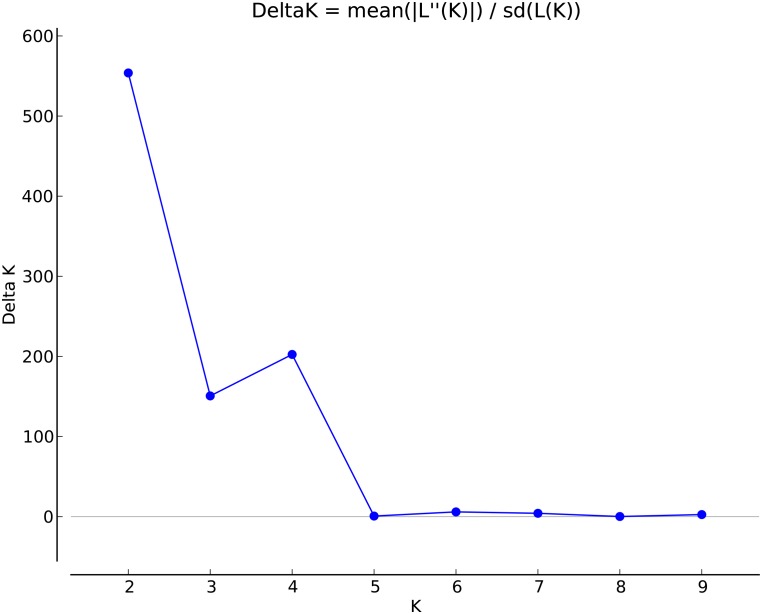
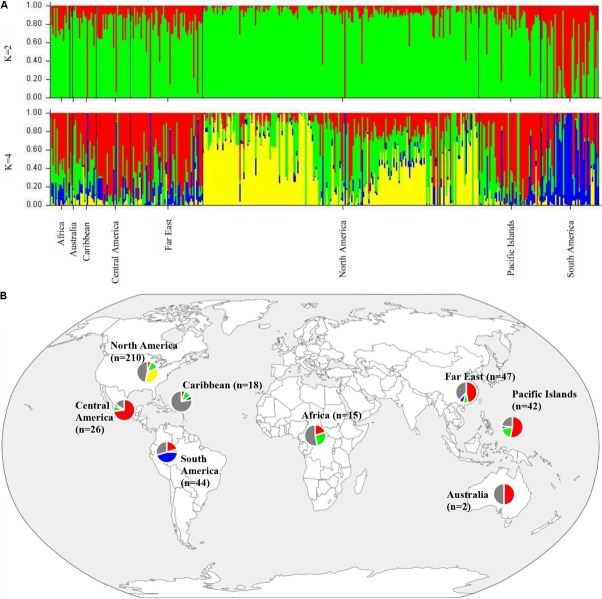
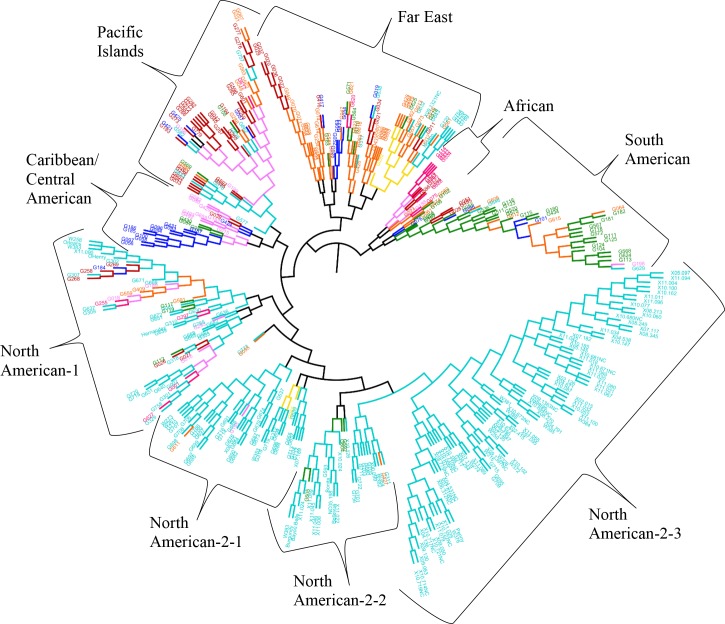
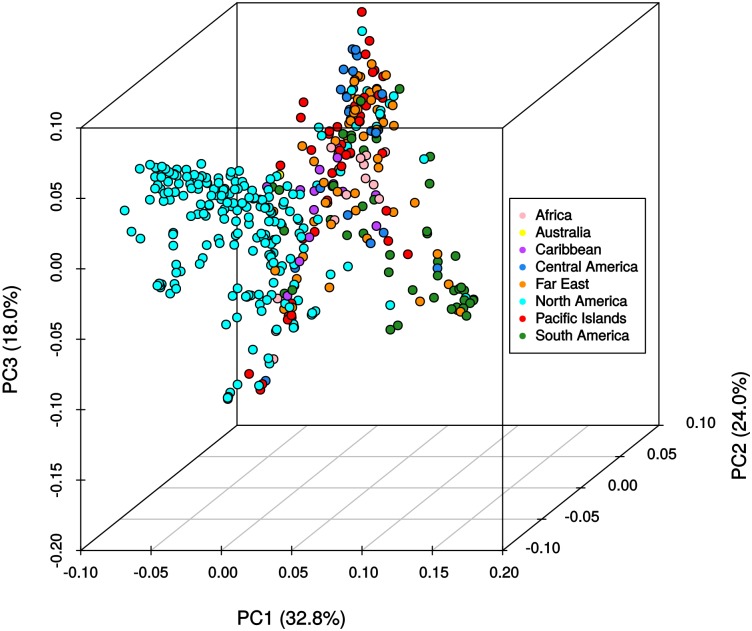
Sweetpotato (Ipomoea batatas) plays a critical role in food security and is the most important root crop worldwide following potatoes and cassava. In the United States (US), it is valued at over $700 million USD. There are two sweetpotato germplasm collections (Plant Genetic Resources Conservation Unit and US Vegetable Laboratory) maintained by the USDA, ARS for sweetpotato crop improvement. To date, no genome-wide assessment of genetic diversity within these collections has been reported in the published literature. In our study, population structure and genetic diversity of 417 USDA sweetpotato accessions originating from 8 broad geographical regions (Africa, Australia, Caribbean, Central America, Far East, North America, Pacific Islands, and South America) were determined using single nucleotide polymorphisms (SNPs) identified with a genotyping-by-sequencing (GBS) protocol, GBSpoly, optimized for highly heterozygous and polyploid species. Population structure using Bayesian clustering analyses (STRUCTURE) with 32,784 segregating SNPs grouped the accessions into four genetic groups and indicated a high degree of mixed ancestry. A neighbor-joining cladogram and principal components analysis based on a pairwise genetic distance matrix of the accessions supported the population structure analysis. Pairwise FST values between broad geographical regions based on the origin of accessions ranged from 0.017 (Far East - Pacific Islands) to 0.110 (Australia - South America) and supported the clustering of accessions based on genetic distance. The markers developed for use with this collection of accessions provide an important genomic resource for the sweetpotato community, and contribute to our understanding of the genetic diversity present within the US sweetpotato collection and the species.
Keywords: Convolvulaceae; GBSpoly; SNPs; USDA germplasm; genotyping-by-sequencing; polyploid; sweetpotato.
Figures
References
-
- Austin D. F. (1988). “The taxonomy, evolution and genetic diversity of sweet potatoes and related wild species,” in Proceedings of the Exploration, Maintenance and Utilization of Sweet Potato Genetic Resources: report of the First Sweet Potato Planning Conference 1987 (Lima: International Potato Center; ), 27–59.
-
- Bruckner A. W. (2004). AFLP-based Genetic Diversity Assessment of Global Sweetpotato (Ipomoea batatas (L.) Lam.) Germplasm Resources: Progress Toward the Development of a Sweetpotato Core Collection Master Thesis, North Carolina State University, Raleigh, NC, USA.
-
- Earl D. A. (2012). STRUCTURE HARVESTER: a website and program for visualizing structure output and implementing the evanno method. Conserv. Genet. Resour. 4 359–361. 10.1007/s12686-011-9548-7 - DOI
LinkOut - more resources
Full Text Sources
Other Literature Sources
Miscellaneous