. 2018 Aug 21:9:1209.
doi: 10.3389/fpls.2018.01209. eCollection 2018.

Nuclear Speckle RNA Binding Proteins Remodel Alternative Splicing and the Non-coding Arabidopsis Transcriptome to Regulate a Cross-Talk Between Auxin and Immune Responses

Affiliations

Nuclear Speckle RNA Binding Proteins Remodel Alternative Splicing and the Non-coding Arabidopsis Transcriptome to Regulate a Cross-Talk Between Auxin and Immune Responses

Jérémie Bazin et al. Front Plant Sci. .

Abstract

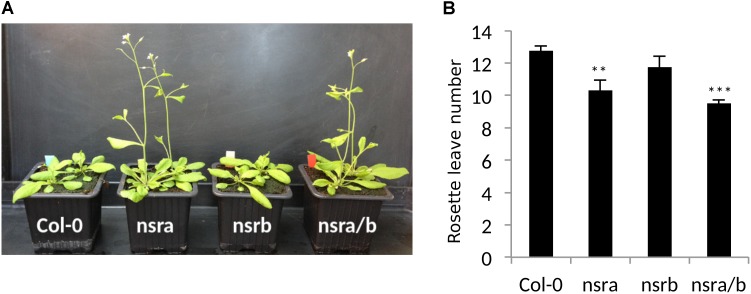
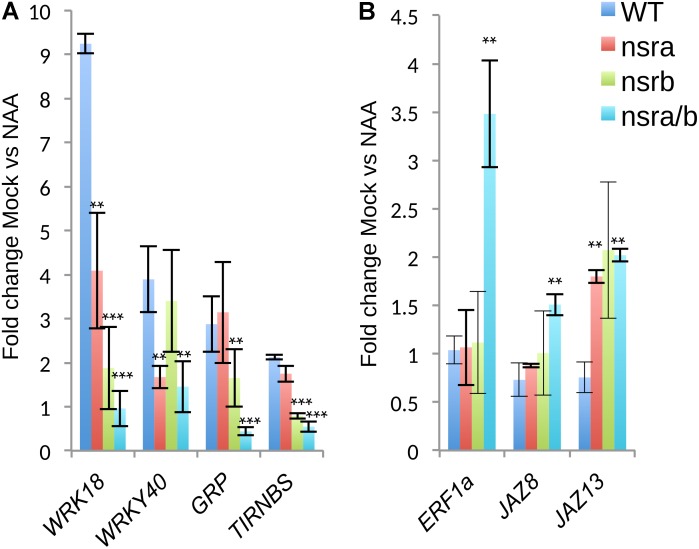
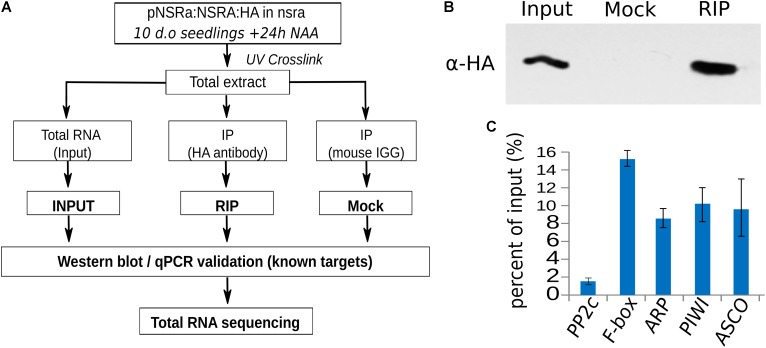
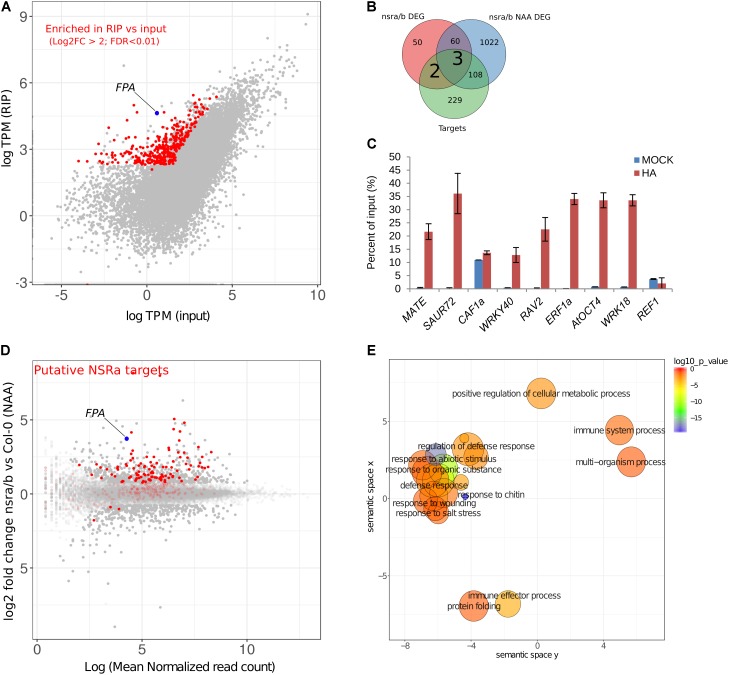
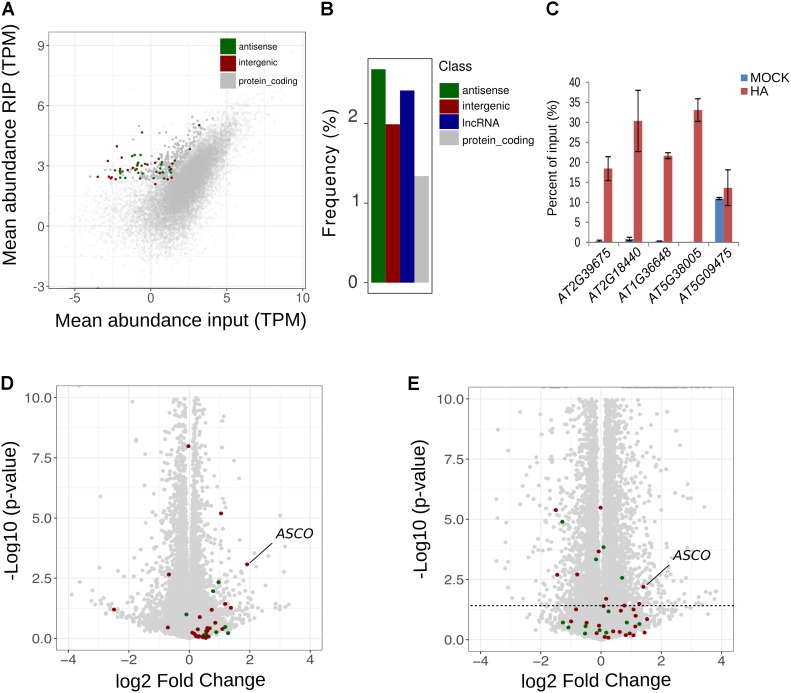
Nuclear speckle RNA binding proteins (NSRs) act as regulators of alternative splicing (AS) and auxin-regulated developmental processes such as lateral root formation in Arabidopsis thaliana. These proteins were shown to interact with specific alternatively spliced mRNA targets and at least with one structured lncRNA, named Alternative Splicing Competitor RNA. Here, we used genome-wide analysis of RNAseq to monitor the NSR global role on multiple tiers of gene expression, including RNA processing and AS. NSRs affect AS of 100s of genes as well as the abundance of lncRNAs particularly in response to auxin. Among them, the FPA floral regulator displayed alternative polyadenylation and differential expression of antisense COOLAIR lncRNAs in nsra/b mutants. This may explains the early flowering phenotype observed in nsra and nsra/b mutants. GO enrichment analysis of affected lines revealed a novel link of NSRs with the immune response pathway. A RIP-seq approach on an NSRa fusion protein in mutant background identified that lncRNAs are privileged direct targets of NSRs in addition to specific AS mRNAs. The interplay of lncRNAs and AS mRNAs in NSR-containing complexes may control the crosstalk between auxin and the immune response pathway.

Keywords: RNA binding proteins; RNP complexes; alternative splicing; auxin; immune response.


Figures

FIGURE 1
FIGURE 1
The nsra/b mutant shows changes in auxin-dependent gene expression and AS. (A) Experimental design to analyze expression and alternative splicing (AS) changes in response to the synthetic auxin NAA in nsra/b compared to Col-0 (WT). (B) Number of up or down regulated genes between nsra/b and Col-0 (WT) in control and NAA treated seedlings. (C) Comparison of gene sets whose expression is significantly affected by the nsra/b mutation only (genotype), the NAA treatment (condition) or the interaction between the two factors (interaction). (D) Number of genes containing at least one differential RNA processing events in introns, CDS, 5′ UTR, and 3′ UTR or a switching isoform in each possible pairwise comparison. (E) Comparison of differentially spliced genes identified by the different methods. The exon group represents genes with a differential processing events in 5′ UTR, 3′ UTR, or CDS exons.
FIGURE 2
FIGURE 2
NSRs control the expression of numerous lncRNAs. (A) Experimental design to analyze changes in lncRNAs expression in nsra/b vs. Col-0 (WT) in control condition and in response to the synthetic auxin NAA. LncRNAs were predicted de novo using cufflinks and merged with Araport11 lncRNA annotation. (B) Differentially expressed antisense (blue) and intergenic (red) lncRNA in nsra/b compared to Col-0 in mock (red circle) or NAA treated (blue circle) seedlings. Already characterized lncRNA ASCO (Bardou et al., 2014), APOLO (Ariel et al., 2014), and COOLAIR (Liu et al., 2009) are indicated on the figure.
FIGURE 3
FIGURE 3
NSRs modulate the relative abundance of lncRNA COOLAIR variants. (A) Schematic representation of transcripts from the FLC/COOLAIR locus. COOLAIR isoforms are shown including positions of primers (arrows) used to measure distal (blue arrows) and proximal (red arrows) and total (black arrows) COOLAIR variant abundance. Black rectangles and black lines denote exons and introns, respectively. (B) COOLAIR and (C) FLC abundance measured by RT-qPCR in nsra, nsrb, nsra/b and Col-0 in seedlings. (D) Proximal and (E) distal variant usage normalized to the total amount of COOLAIR. (F) Distal vs. proximal variant usage ratio. Data represent the mean of three biological replicates ± standard error. Results were analyzed by one-way analysis of variance (ANOVA) followed by Tukey’s post-hoc test: groups with different letters are statistically different (p ≤ 0.05) and groups with the same letters are statistically equal (p ≤ 0.05). Significance was determined using an ANOVA coupled with a Tukey pairwise test (p-value < 0.05).
FIGURE 4
FIGURE 4
FPA is differentially processed in nsra/b plants. (A) The RNA processing event detected in FPA by RNAprof from the comparison of WT (in orange) and nsra/b (blue). Significant differential events are delimited by green lines and labeled with their p-value (p) The Y-axis show the normalized RNA-seq coverage from RNAprof. Section between two purple lines with p-values indicated denote significant differences between nucleotide based coverage. Orange and blue traces correspond triplicate samples of Col-0 and nsra/b treated with a mock solution, respectively. The X-axis represents gene coordinates (boxes and lines representing exons and introns, respectively). Positions of polyadenylation sites identified in Hornyik et al. (2010) are shown on the gene model as well as the two transcript variants deriving. Positions of primer pairs used to amplify the short and long FPA variant are indicated as black and with arrows (respectively). (B) Isoforms specific RT-qPCR analysis of short and long FPA variant and their abundance ratio in nsra, nsrb, and nsra/b. Depicted data is the mean of fold change compared to Col-0 ± standard deviation of three biological replicates. Significance is was determined according to a Student’s t-test (p < 0.05; ∗∗p < 0.01). (C) RIP assays using ProNSRa::NSRa::HA (NSRa), Col-0 (w/o: without tag) plants on total cell lysates of 10-day-old seedlings treated with 10 mM NAA for 24 h. Results of RT-qPCR are expressed as mean of the percentage of the respective INPUT signal (total signal before RIP) from three independent replicates ± standard error. Genes analyzed are a housekeeping gene (At1g13320) named here REF and FPA (AT2G43410) short and long isoforms.
FIGURE 5
FIGURE 5
NSRa affects flowering time in Arabidopsis. (A) Representative picture of Col-0 nsra, nsrb and nsra/b at 21 days after germination. (B) Mean number of rosette leaves at bolting in Col-0, nsra, nsrb, and nsra/b. Data is mean of 12 plants ± standard deviation. Significance was determined using a Student’s t-test (∗∗p-value < 0.01; ∗∗∗p-value < 0.001).
FIGURE 6
FIGURE 6
Steady state abundances and AS of genes involved in biotic stress responses are affected in nsra/b mutants. (A) Heatmap of log2 fold change (log2FC) expression change in response to NAA for differentially expressed genes in nsra/b compared to wild type. Genes were clustered using K-mean clustering, the left side bar represent the delimitation of each cluster REVIGO plots of Biological Function. (B) Gene Ontology (GO) of cluster 2 and (C) cluster 3 as defined in panel A and gene with significant isoforms switching events (D). Each circle represents a significant GO category but only group with the highest significance are labeled. Related GOs have similar (x, y) coordinates.
FIGURE 7
FIGURE 7
Expression analysis of a selected subset of genes by RT-qPCR. (A) Expression changes in response to NAA of genes belonging to cluster 2 and cluster 3 (B) as defined in Figure 6A. Expression was tested in Col-0 nsra, nsrb and nsra/b, on three biological replicates. Values correspond to the mean fold change of Mock treated versus NAA treated seedling of the designated genotype. Error bars correspond to ± the standard deviation of three biological replicates. Significance was determined using a Student’s t-test (∗∗p-value < 0.01; ∗∗∗p-value < 0.001).
FIGURE 8
FIGURE 8
RNA immunoprecipitation of NSRa. (A) Experimental design to identify NSRa direct targets using RNA-immunoprecipitation assay. (B) Specificity of the immunoprecipitation demonstrated by a Western blot showing a discrete band at 27 kDa in the input and the RIP fraction but not the Mock IP (IgG) fraction. The membrane was blotted with HA antibody. (C) RT-qPCR analysis of previously identified (Bardou et al., 2014) NSRa targets (FBOX, ARP, PIWI, ASCO) and randomly selected abundant housekeeping genes (PP2C), showing the efficiency of the RIP assay toward target mRNAs.
FIGURE 9
FIGURE 9
Identification of putative NSRa targets by RIP-seq. (A) Identification of NSRa targets: comparison of mean transcript abundance (TPM) in input vs. RIP-seq libraries Dots in red correspond to putative targets, e.g., significantly enriched transcripts in RIP as compared to input (FDR < 0.01 Log2 fold change > 2) and depleted in Mock IP. (B) Overlap between putative target genes and differentially regulated genes in nsra/b in mock (nsra/b DEG) or NAA-treated (nsra/b NAA DEG) seedlings. (C) RIP-qPCR assays using ProNSRa::NSRa::HA (NSRa) plants on total cell lysates of 10-day-old seedlings treated with 10 mM NAA for 24 h. Genes were randomly selected from NSRa putative target list Results of RT-qPCR are expressed as the mean of the percentage of input of three independent experiments ± standard error. (D) MA plot of showing the relationship between foldchange and transcript abundance for the comparison between nsra/b and Col-0 in the presence of NAA. Red dots correspond to putative NSRa targets. Plain dots correspond to differentially expressed genes. (E) REVIGO plots of GO enrichment clusters of putative target genes Each circle represents a significant GO category but only clusters with highest significance are labeled. Related GOs have similar (x, y) coordinates.
FIGURE 10
FIGURE 10
NSRa binds to numerous lncRNA. (A) Comparison of mean transcript abundance (TPM) in input vs. RIP-seq libraries. Dots in gray; red and green correspond to protein coding, intergenic and antisense lncRNA transcripts, respectively. Plain dots correspond to significantly enriched genes in RIP vs. Input, e.g., putative targets. (B) Frequency of all lncRNAs, antisense lncRNA, intergenic lncRNA andprotein coding genes among the NSRa targets: blue red, green, and gray bars, respectively. Frequency was calculated compared the number detected genes in the input for each class. (C) RIP-qPCR assays using proNSRa::NSRa::HA (NSRa) plants on total cell lysates of 10-day-old seedlings treated with 10mM NAA for 24 h. lncRNA were randomly selected from NSRa putative target list. Results of RT-qPCR are expressed as the mean of the percentage of input of three independent experiments ± standard error. Volcano plots of showing the relationship between the fold change and p-value of the comparison between nsra/b and Col-0 in (D) mock or (E) NAA treated samples. Plain colored dots correspond to intergenic (red) and antisense (blue) lncRNA which are putative targets of NSRa. The dotted line delineates a p-value of 0.05.

Similar articles

Cited by

References

    1. Andrews S. (2010). FastQC: A Quality Control Tool for High Throughput Sequence Data. Available at: http://www.bioinformatics.babraham.ac.uk/projects/fastqc
    1. Ariel F., Jegu T., Latrasse D., Romero-Barrios N., Christ A., Benhamed M., et al. (2014). Noncoding transcription by alternative RNA polymerases dynamically regulates an auxin-driven chromatin loop. Mol. Cell 55 383–396. 10.1016/j.molcel.2014.06.011 - DOI - PubMed
    1. Bailey-Serres J., Sorenson R., Juntawong P. (2009). Getting the message across: cytoplasmic ribonucleoprotein complexes. Trends Plant Sci. 14 443–453. 10.1016/j.tplants.2009.05.004 - DOI - PubMed
    1. Bardou F., Ariel F., Simpson C. G., Romero-Barrios N., Laporte P., Balzergue S., et al. (2014). Long noncoding RNA modulates alternative splicing regulators in Arabidopsis. Dev. Cell 30 166–176. 10.1016/j.devcel.2014.06.017 - DOI - PubMed
    1. Bray N. L., Pimentel H., Melsted P., Pachter L. (2016). Near-optimal probabilistic RNA-seq quantification. Nat. Biotechnol. 34 525–527. 10.1038/nbt.3519 - DOI - PubMed