. 2018 Aug 30:24:25.
doi: 10.1186/s40409-018-0157-8. eCollection 2018.

Impact of autologous whole blood administration upon experimental mouse models of acute Trypanosoma cruzi infection

Affiliations

Impact of autologous whole blood administration upon experimental mouse models of acute Trypanosoma cruzi infection

Beatriz Philot Pavão et al. J Venom Anim Toxins Incl Trop Dis. .

Abstract

Background: Autologous whole blood (AWB) administration is described as alternative/complementary medical practice widely employed in medical and veterinary therapy against infections, chronic pathologies and neoplasias. Our aim is to investigate in vivo biological effect of AWB using healthy murine models under the course of Trypanosoma cruzi acute infection.

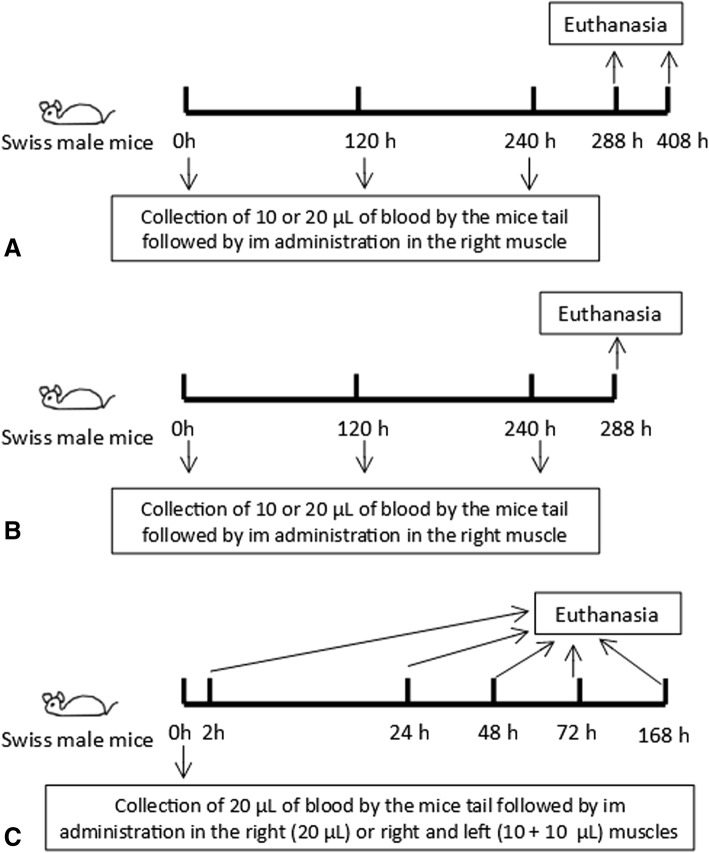
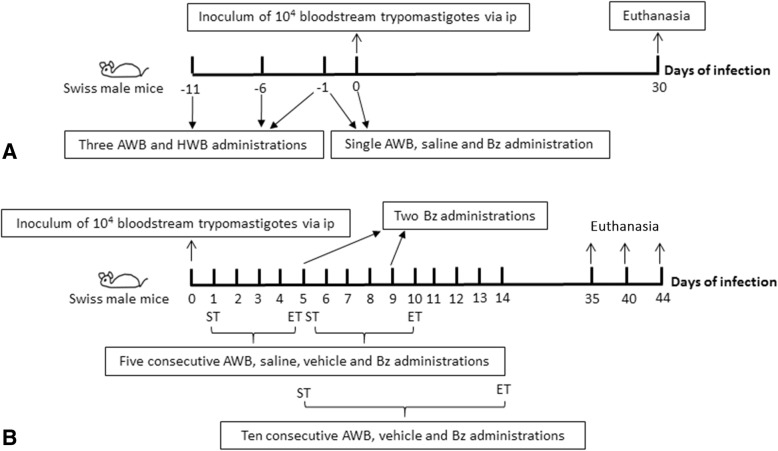
Methods: The first set of studies consisted of injecting different volumes of AWB and saline (SAL) into the posterior region of quadriceps muscle of healthy male Swiss mice under distinct therapeutic schemes evaluating: animal behavior, body and organ weight, hemogram, plasmatic biochemical markers for tissue damage and inflammatory cytokine levels and profile. To assess the impact on the experimental T. cruzi infection, different schemes (prior and post infection) and periods of AWB administration (from one up to 10 days) were conducted, also employing heterologous whole blood (HWB) and evaluating plasma cytokine profile.

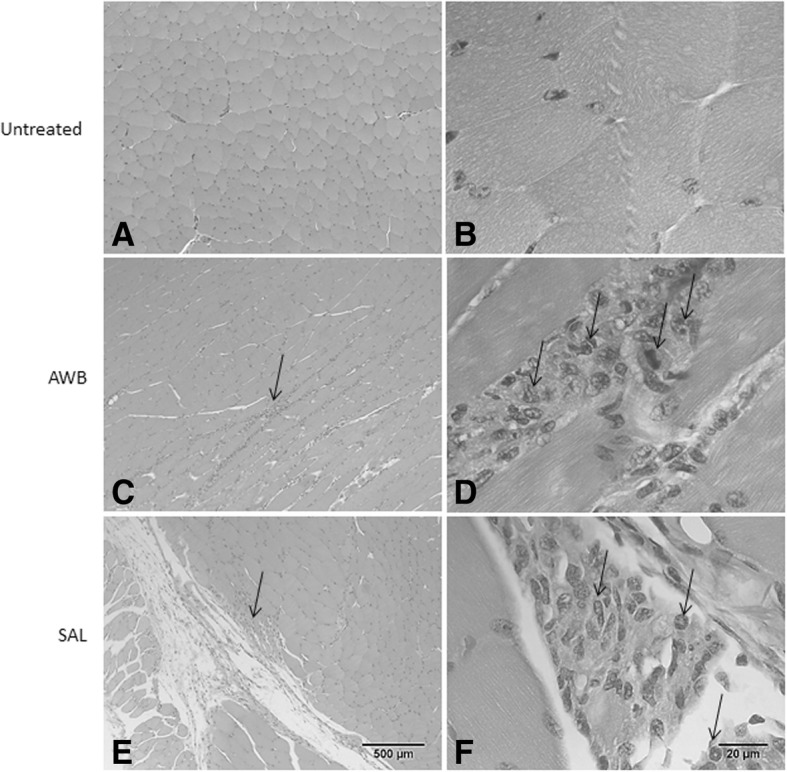
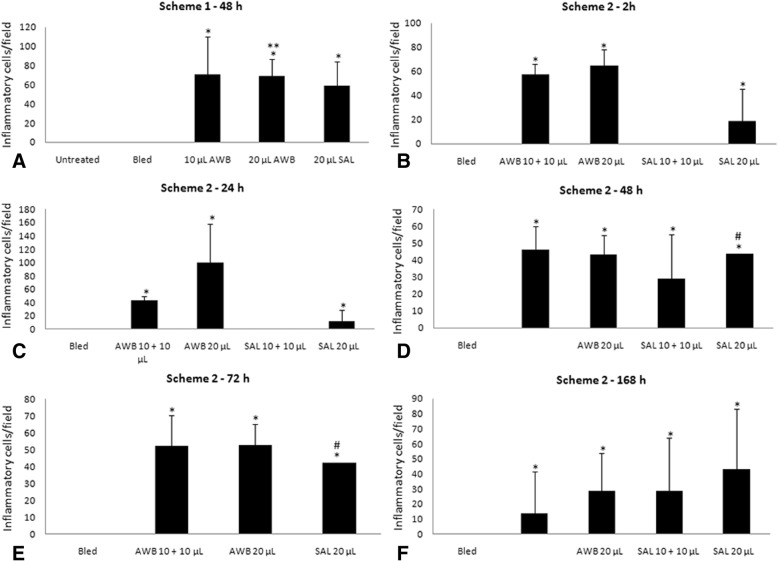
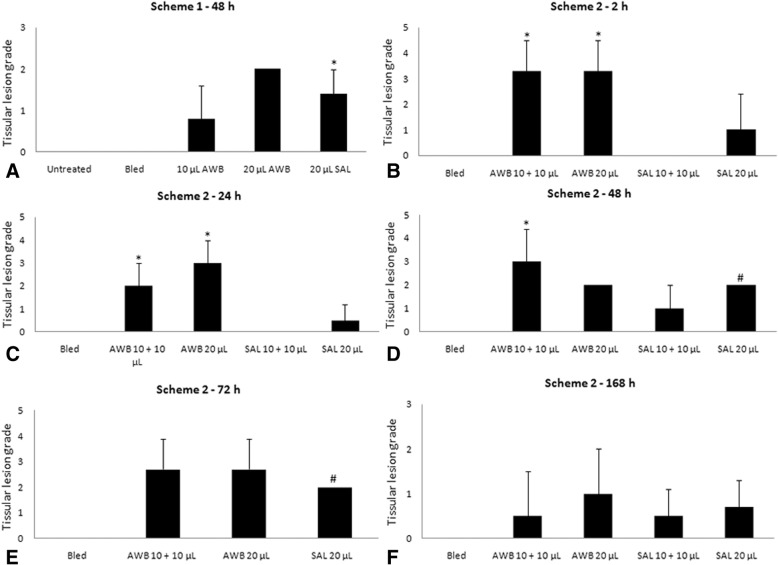
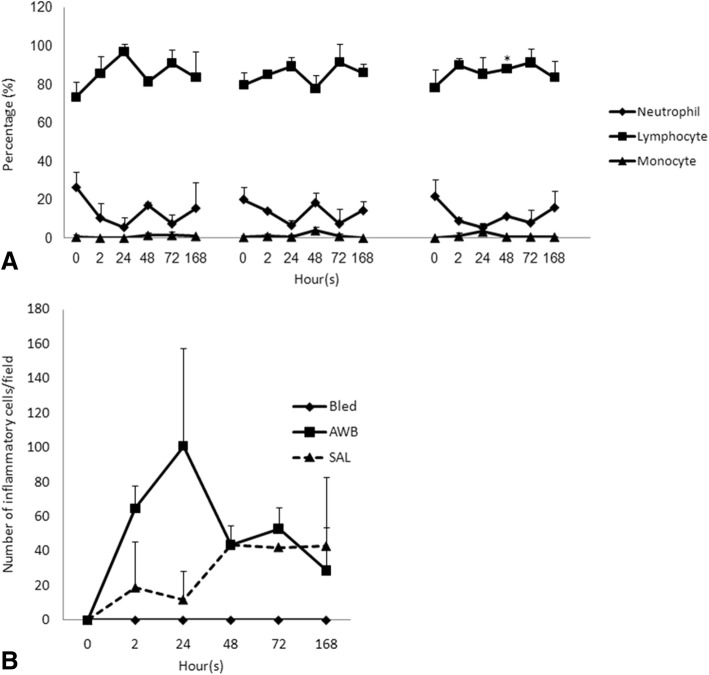
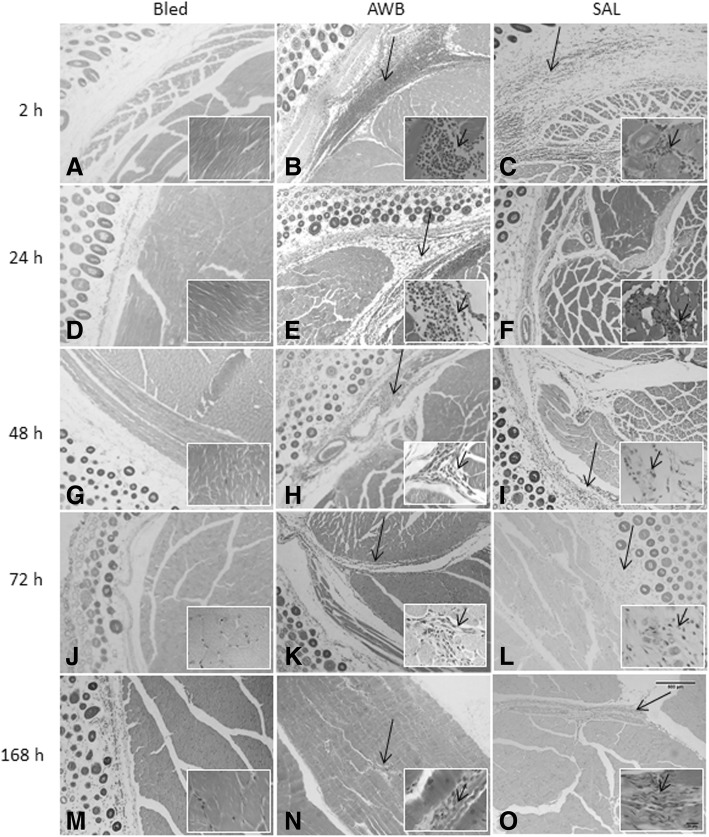
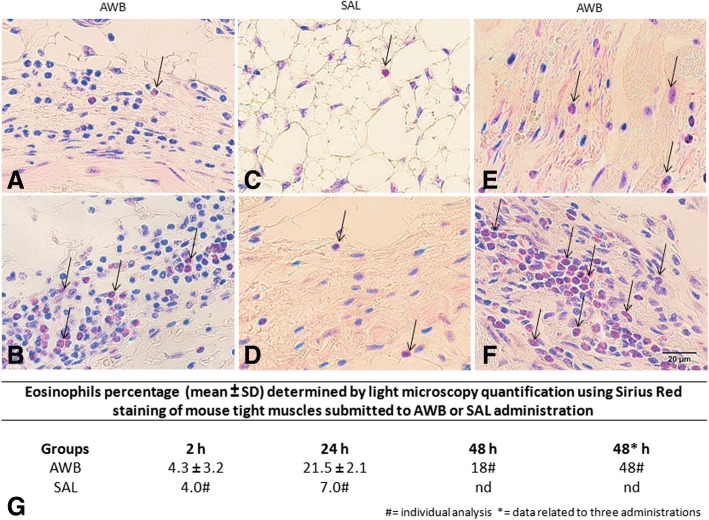
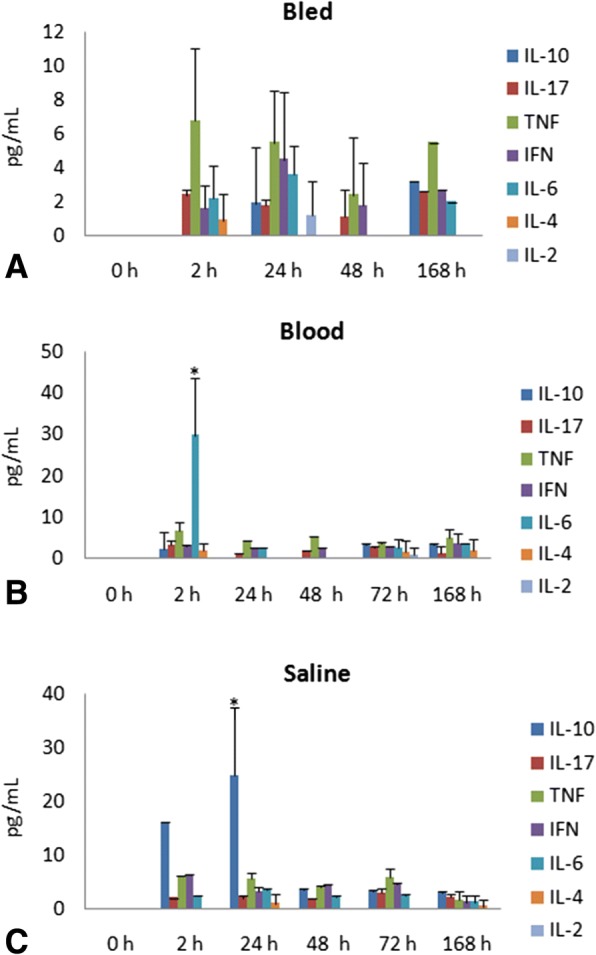
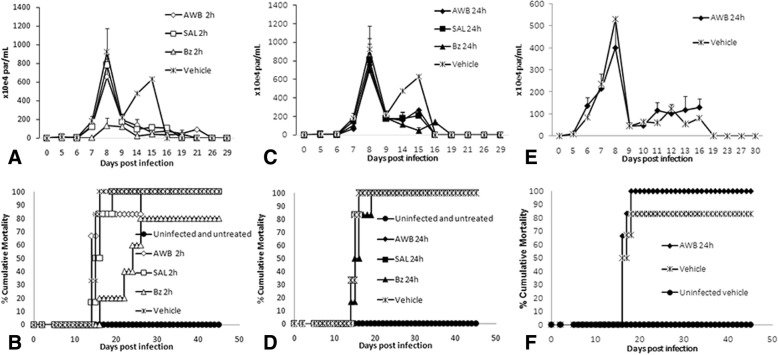
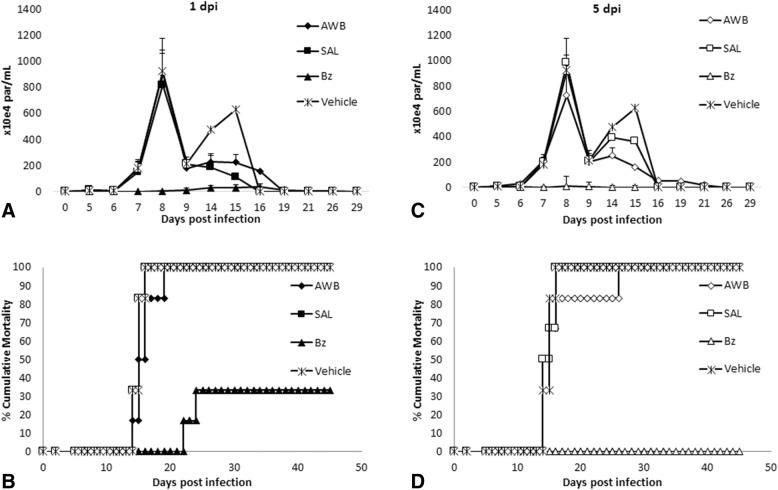
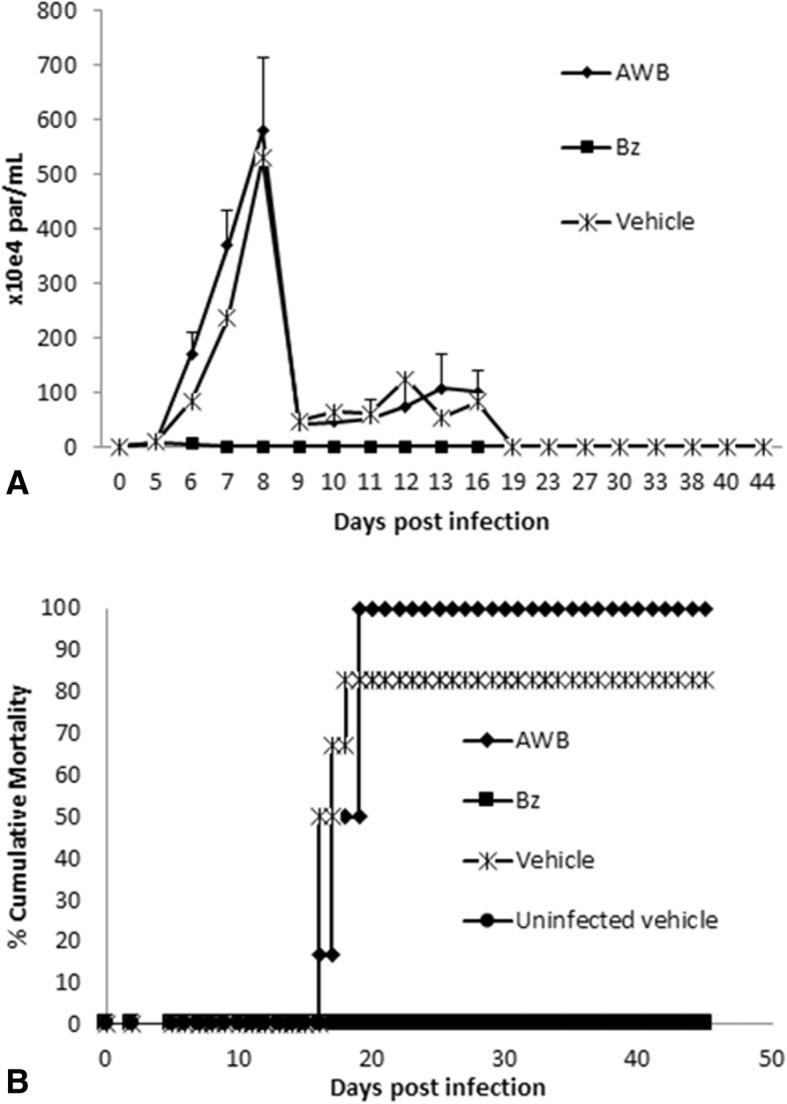
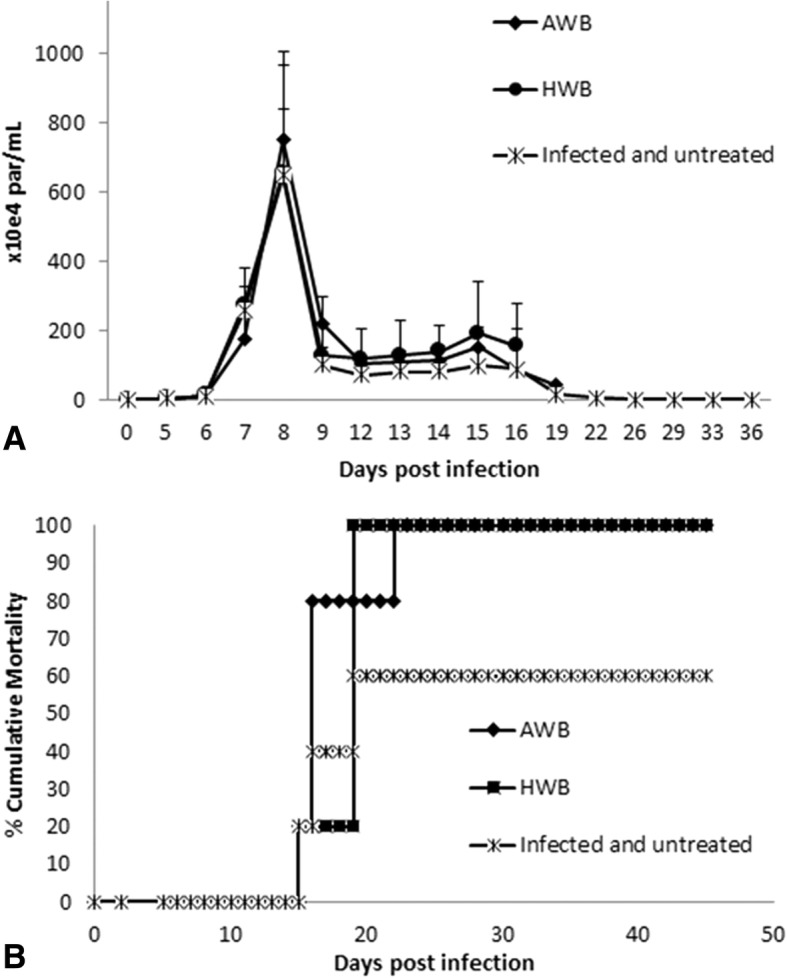
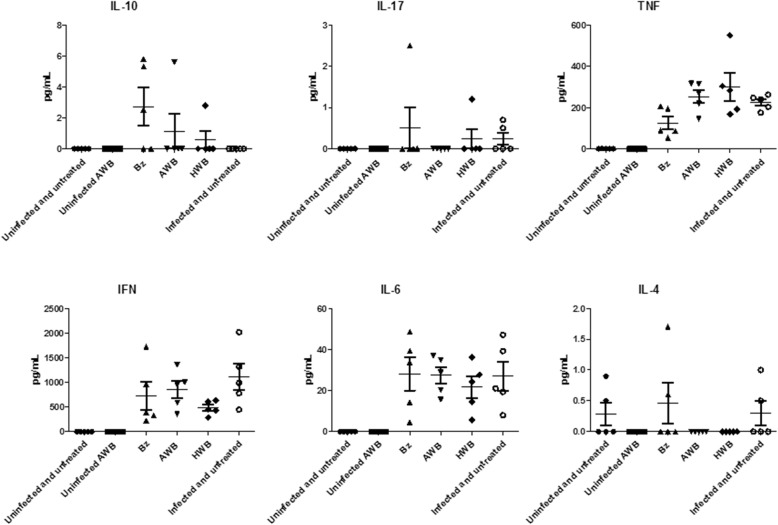
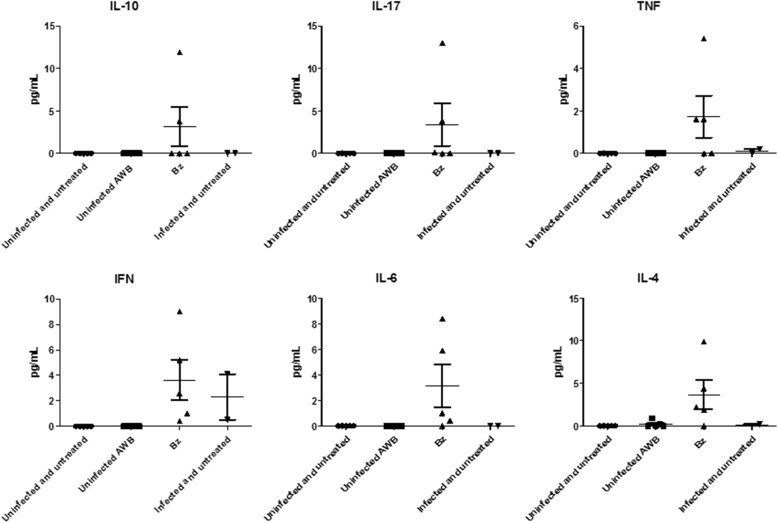
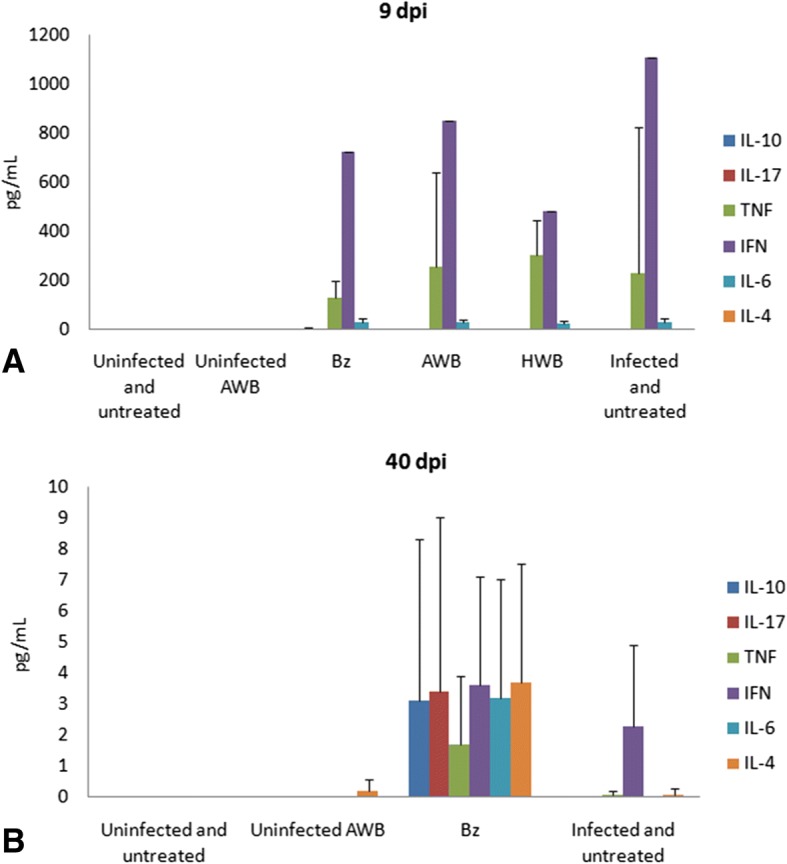
Results: No major adverse events were observed in healthy AWB-treated mice, except gait impairment in animals that received three doses of 20 μL AWB in the same hind limb. AWB and SAL triggered an immediate polymorphonuclear response followed by mononuclear infiltrate. Although SAL triggered an inflammatory response, the kinetics and intensity of the histological profile and humoral mediator levels were different from AWB, the latter occurring earlier and more intensely with concomitant elevation of plasma IL-6. Inflammatory peak response of SAL, mainly composed of mononuclear cells with IL-10, was increased at 24 h. According to the mouse model of acute T. cruzi infection, only minor decreases (< 30%) in the parasitemia levels were produced by AWB and HWB given before and after infection, without protecting against mortality. Rises in IFN-gamma, TNF-alpha and IL-6 were detected at 9 dpi in all infected animals as compared to uninfected mice but only Bz displayed a statistically significant diminution (p = 0.02) in TNF-alpha levels than infected and untreated mice.

Conclusions: This study revealed that the use of autologous whole blood (AWB) in the acute model employed was unable to reduce the parasitic load of infected mice, providing only a minor decrease in parasitemia levels (up to 30%) but without protecting against animal mortality. Further in vivo studies will be necessary to elucidate the effective impact of this procedure.

Keywords: Alternative therapy; Autologous blood; Mouse models; Trypanosoma cruzi.


Conflict of interest statement

Our present study was submitted to Fiocruz Committee of Ethics for the Use of Animals (CEUA) and approved under the license number CEUA L-032/2016.Not applicable.The authors declare that they have no competing interests.Springer Nature remains neutral with regard to jurisdictional claims in published maps and institutional affiliations.

Figures

Fig. 1
Fig. 1
Intramuscular treatment approach according to the different schemes. (a) and (b) (Scheme 1): three AWB administrations at five-day intervals and (c) (Scheme 2): single AWB administration. Control groups: administration of SAL, bled and untreated mice, and groups of non-bled and untreated mice
Fig. 2
Fig. 2
Schemes employed before (a) and after (b) T. cruzi acute infection (Y strain) of mice. The therapy was given intramuscularly (autologous whole blood – AWB and heterologous whole blood – HWB) and orally (benznidazole – Bz) using from one up to 10 daily administrations. Control groups: saline, Bz or vehicle, infected-and-untreated and uninfected-and-untreated. ST = Start of therapy, ET = End of therapy
Fig. 3
Fig. 3
Histopathological analysis of the inflammatory infiltrate profile in uninfected mice. The mice were submitted to three administrations of 20 μL of AWB (c and d) and of SAL (e and f) at five-day intervals (Scheme 1). The evaluation by light microscopy was performed by hematoxylin-eosin staining from the posterior region of the quadriceps muscle collected from mice 48 h after AWB and SAL injection (c-f) compared to samples obtained from untreated (a, b) animals. Original increments × 100 (a, c and e) and × 1000 (b, d and f). Arrows: inflammatory infiltrate
Fig. 4
Fig. 4
Analysis of the inflammatory presence in thighs of uninfected mice. Evaluation of the number of inflammatory cells (mean and SD) after administration of AWB and SAL at 48 h (a) (three administration under a five-day interval - Scheme 1) and at 2 h (b), 24 h (c), 48 h (d), 72 h (e) and 168 h (f) (unique administration - Scheme 2) post treatment. ANOVA (p ≤ 0.05) = *untreated/bled; ** AWB and SAL; # = individual analysis
Fig. 5
Fig. 5
Analysis of tissue lesion in thighs of uninfected mice. Evaluation of degree of tissue lesion (mean and SD) after administration of AWB and SAL at 48 h (a) (three administration under a five-day interval - Scheme 1) and at 2 h (b), 24 h (c), 48 h (d), 72 h (e) and 168 h (f) (unique administration - Scheme 2) post treatment. The tissue injury grade was assessed using the following classification: 0 = no change, 1 = mild localized inflammatory infiltrate, 2 = mild multifocal inflammatory infiltrate, 3 = moderate localized inflammatory infiltrate, 4 = moderate multifocal inflammatory infiltrate, 5 = severe diffuse inflammatory infiltrate. ANOVA (p ≤ 0.05) = *untreated/bled; # = individual analysis
Fig. 6
Fig. 6
Leukogram and inflammatory tissue analysis in uninfected mice. Mean and SD of (a) leukogram by blood smear stained with Giemsa and (b) tissue inflammation of mice thighs submitted or not to AWB and SAL injection. The samples were collected at endpoints of 2, 24, 48, 72 and 168 h after treatment (single administration - Scheme 2). * ANOVA = p ≤ 0.05 (n = 2–3) between bleeding / treated animals
Fig. 7
Fig. 7
Histopathological analysis of the presence of inflammatory infiltrate in uninfected mice. The evaluation of inflammatory infiltrate was performed by light microscopy (a-o) using hematoxylin-eosin staining of quadriceps muscles from the back of the hind thigh collected from mice at 2, 24, 48, 72, 168 h after a single injection (Scheme 2) of 20 μL of AWB (b, e, h, k and n) and SAL (c, f, i, l and o). Original magnifications × 100 and × 1000 (inset) for all panels
Fig. 8
Fig. 8
Histopathological analysis of the presence of eosinophils in uninfected mice. The evaluation was performed by using Sirius Red staining of quadriceps muscles from the back of the hind thigh collected from mice submitted to AWB and SAL therapy. (a-f) Light microscopy analysis and (g) determination of the percentage of eosinophils (mean ± SD) stained by the pink labeling (arrows, a-f) of tissue samples collected from mice submitted to one (a-e) or three (f) cycles of AWB (a, b, f and g) and SAL (c, d and g) injection (20 μL) and monitored at 2 (a, c and g), 24 (b, d and g) and 48 h* (e, f and g) after therapy. Original magnification × 1000 for all panels. Bars represent 20 μm
Fig. 9
Fig. 9
Analysis of the plasma cytokine profile in uninfected mice. Mean and SD of cytokine blood samples from mice that were only bled (a) or submitted to AWB (b) and SAL (c) injection. The samples were collected at endpoints of 2, 24, 48, 72 and 168 h after treatment (single administration - Scheme 2). * ANOVA = p ≤ 0.05 (n = 2–3) between bleeding/treated animals
Fig. 10
Fig. 10
Analysis of parasitemia levels and percentage of cumulative mortality in acute T. cruzi infection of mice. In vivo effect of single (ad) and three (intervals of 5 days between each dose) (e, f) administrations of autologous whole blood (AWB), saline (SAL) and benznidazole (Bz) prior to T. cruzi acute infection using male Swiss mice inoculated with 104 bloodstream trypomastigotes (Y strain). The data express parasitemia levels (a, c and e) and percent of cumulative mortality (b, d and f)
Fig. 11
Fig. 11
Analysis of parasitemia levels and percentage of cumulative mortality in acute T. cruzi infection of mice. In vivo effect of autologous whole blood (AWB), saline (SAL) and benznidazole (Bz) administration for 5 consecutive days after T. cruzi acute infection using male Swiss mice inoculated with 104 bloodstream trypomastigotes (Y strain). a and c parasitemia levels and b and d percent of cumulative mortality. The therapy was started at 1 dpi (a and b) and at the parasitemia onset (5 dpi – c and d). dpi = Days post infection
Fig. 12
Fig. 12
Analysis of parasitemia levels and percentage of cumulative mortality in acute T. cruzi infection of mice. In vivo effect of autologous (AWB) and benznidazole (Bz) administration for 10 consecutive days after T. cruzi acute infection using male Swiss mice inoculated with 104 bloodstream trypomastigotes (Y strain), evaluated through parasitemia levels (a) and percent of cumulative mortality (b). The therapy was started at the parasitemia onset (5 dpi)
Fig. 13
Fig. 13
Analysis of parasitemia levels and percentage of cumulative mortality in acute T. cruzi infection of mice. In vivo effect of three (intervals of 5 days) administration of AWB, HWB and benznidazole prior T. cruzi acute infection using male Swiss mice inoculated with 104 bloodstream trypomastigotes (Y strain) evaluated through parasitemia levels (a) and percent of cumulative mortality (b)
Fig. 14
Fig. 14
Analysis of the plasma cytokine profile in acute T. cruzi infection of mice. The blood samples were collected at 9 dpi from mice submitted to three AWB or HWB (intervals of five days) administrations prior to T. cruzi acute infection or benznidazole (5 and 9 dpi) using male Swiss mice inoculated with 104 bloodstream trypomastigotes (Y strain)
Fig. 15
Fig. 15
Analysis of the plasma cytokine profile in acute T. cruzi infection of mice. The blood samples were collected at 40 dpi from mice submitted to three AWB or HWB (intervals of five days) administrations prior to acute T. cruzi infection or benznidazole (5 and 9 dpi) using male Swiss mice inoculated with 104 bloodstream trypomastigotes (Y strain). *ANOVA = p ≤ 0.05 (n = 5) related to infected and untreated. Dpi = Days post infection
Fig. 16
Fig. 16
Analysis of the plasmatic cytokine profile at 9 (a) and 40 (b) days post infection of mouse models inoculated with bloodstream forms of Trypanosoma cruzi (Y strain). Mean and SD of the cytokines from the animal blood samples are given after three AWB or HWB administrations prior to parasite inoculation. Benznidazole was also given (from 5 to 9 dpi) as reference drug

Similar articles

Cited by

References

    1. Akpunar D, Bebis H, Yavan T. Use of complementary and alternative medicine in patients with gynecologic cancer: a systematic review. Asian Pac J Cancer Prev. 2015;16(17):7847–7852. doi: 10.7314/APJCP.2015.16.17.7847. - DOI - PubMed
    1. Ching S, Ramachandran V, Gew LT, Lim SMS, Sulaiman WAW, Foo YL, et al. Complementary alternative medicine use among patients with dengue fever in the hospital setting: a cross-sectional study in Malaysia. BMC Complement Altern Med. 2016;16:37. doi: 10.1186/s12906-016-1017-0. - DOI - PMC - PubMed
    1. Ren RL, Vora N, Yang F, Longmate J, Wang W, Sun H, et al. Variations of dose and electrode spacing for rat breast cancer electrochemical treatment. Bioelectromagnetics. 2001;22(3):205–211. doi: 10.1002/bem.40. - DOI - PubMed
    1. Cabrales LB, Ciria HC, Bruzón RP, Quevedo MS, Aldana RH, De Oca LM, et al. Electrochemical treatment of mouse Ehrlich tumor with direct electric current. Bioelectromagnetics. 2001;22(5):316–322. doi: 10.1002/bem.56. - DOI - PubMed
    1. Chou CK, McDougall JA, Ahn C, Vora N. Electrochemical treatment of mouse and rat fibrosarcomas with direct current. Bioelectromagnetics. 1997;18(1):14–24. doi: 10.1002/(SICI)1521-186X(1997)18:1<14::AID-BEM4>3.0.CO;2-8. - DOI - PubMed

LinkOut - more resources