

Metabolomic analysis of obesity, metabolic syndrome, and type 2 diabetes: amino acid and acylcarnitine levels change along a spectrum of metabolic wellness
- PMID: 30186675
- PMCID: PMC6120443
- DOI: 10.7717/peerj.5410
Metabolomic analysis of obesity, metabolic syndrome, and type 2 diabetes: amino acid and acylcarnitine levels change along a spectrum of metabolic wellness
Abstract
Background: Metabolic syndrome (MS) is a construct used to separate "healthy" from "unhealthy" obese patients, and is a major risk factor for type 2 diabetes (T2D) and cardiovascular disease. There is controversy over whether obese "metabolically well" persons have a higher morbidity and mortality than lean counterparts, suggesting that MS criteria do not completely describe physiologic risk factors or consequences of obesity. We hypothesized that metabolomic analysis of plasma would distinguish obese individuals with and without MS and T2D along a spectrum of obesity-associated metabolic derangements, supporting metabolomic analysis as a tool for a more detailed assessment of metabolic wellness than currently used MS criteria.
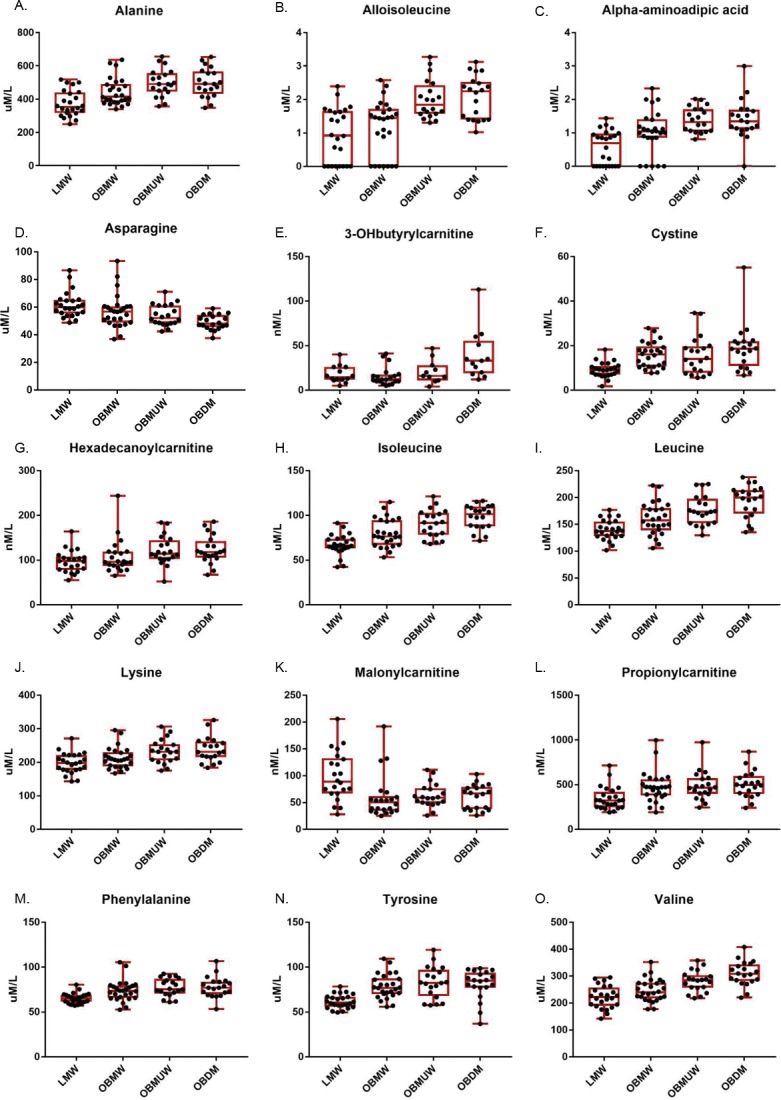
Methods: Fasting plasma samples from 90 adults were assigned to groups based on BMI and ATP III criteria for MS: (1) lean metabolically well (LMW; n = 24); (2) obese metabolically well (OBMW; n = 26); (3) obese metabolically unwell (OBMUW; n = 20); and (4) obese metabolically unwell with T2D (OBDM; n = 20). Forty-one amino acids/dipeptides, 33 acylcarnitines and 21 ratios were measured. Obesity and T2D effects were analyzed by Wilcoxon rank-sum tests comparing obese nondiabetics vs LMW, and OBDM vs nondiabetics, respectively. Metabolic unwellness was analyzed by Jonckheere-Terpstra trend tests, assuming worsening health from LMW → OBMW → OBMUW. To adjust for multiple comparisons, statistical significance was set at p < 0.005. K-means cluster analysis of aggregated amino acid and acylcarnitine data was also performed.
Results: Analytes and ratios significantly increasing in obesity, T2D, and with worsening health include: branched-chain amino acids (BCAAs), cystine, alpha-aminoadipic acid, phenylalanine, leucine + lysine, and short-chain acylcarnitines/total carnitines. Tyrosine, alanine and propionylcarnitine increase with obesity and metabolic unwellness. Asparagine and the tryptophan/large neutral amino acid ratio decrease with T2D and metabolic unwellness. Malonylcarnitine decreases in obesity and 3-OHbutyrylcarnitine increases in T2D; neither correlates with unwellness. Cluster analysis did not separate subjects into discreet groups based on metabolic wellness.
Discussion: Levels of 15 species and metabolite ratios trend significantly with worsening metabolic health; some are newly recognized. BCAAs, aromatic amino acids, lysine, and its metabolite, alpha-aminoadipate, increase with worsening health. The lysine pathway is distinct from BCAA metabolism, indicating that biochemical derangements associated with MS involve pathways besides those affected by BCAAs. Even those considered "obese, metabolically well" had metabolite levels which significantly trended towards those found in obese diabetics. Overall, this analysis yields a more granular view of metabolic wellness than the sole use of cardiometabolic MS parameters. This, in turn, suggests the possible utility of plasma metabolomic analysis for research and public health applications.
Keywords: Acylcarnitines; Amino acids; Metabolic syndrome; Metabolic wellness; Metabolomic; Metabolomics; Obesity; Type 2 diabetes.
Conflict of interest statement
The authors declare there are no competing interests.
Figures
Similar articles
-
Diabetes and branched-chain amino acids: What is the link?J Diabetes. 2018 May;10(5):350-352. doi: 10.1111/1753-0407.12645. Epub 2018 Feb 13. J Diabetes. 2018. PMID: 29369529
-
Branched-Chain and Aromatic Amino Acids, Type 2 Diabetes, and Cardiometabolic Risk Factors among Puerto Rican Adults.Nutrients. 2024 Aug 4;16(15):2562. doi: 10.3390/nu16152562. Nutrients. 2024. PMID: 39125441 Free PMC article.
-
Identification of pathognomonic purine synthesis biomarkers by metabolomic profiling of adolescents with obesity and type 2 diabetes.PLoS One. 2020 Jun 26;15(6):e0234970. doi: 10.1371/journal.pone.0234970. eCollection 2020. PLoS One. 2020. PMID: 32589682 Free PMC article.
-
Metabolomic Signature Between Metabolically Healthy Overweight/Obese and Metabolically Unhealthy Overweight/Obese: A Systematic Review.Diabetes Metab Syndr Obes. 2021 Mar 4;14:991-1010. doi: 10.2147/DMSO.S294894. eCollection 2021. Diabetes Metab Syndr Obes. 2021. PMID: 33692630 Free PMC article. Review.
-
Insulin action, type 2 diabetes, and branched-chain amino acids: A two-way street.Mol Metab. 2021 Oct;52:101261. doi: 10.1016/j.molmet.2021.101261. Epub 2021 May 24. Mol Metab. 2021. PMID: 34044180 Free PMC article. Review.
Cited by
-
Obese Individuals with and without Type 2 Diabetes Show Different Gut Microbial Functional Capacity and Composition.Cell Host Microbe. 2019 Aug 14;26(2):252-264.e10. doi: 10.1016/j.chom.2019.07.004. Epub 2019 Aug 6. Cell Host Microbe. 2019. PMID: 31399369 Free PMC article.
-
Pilot Study of Metabolomic Clusters as State Markers of Major Depression and Outcomes to CBT Treatment.Front Neurosci. 2019 Sep 12;13:926. doi: 10.3389/fnins.2019.00926. eCollection 2019. Front Neurosci. 2019. PMID: 31572108 Free PMC article.
-
Circulating amino acids and acylcarnitines correlated with different CAC score ranges in diabetic postmenopausal women using LC-MS/MS based metabolomics approach.BMC Endocr Disord. 2022 Jul 21;22(1):186. doi: 10.1186/s12902-022-01073-9. BMC Endocr Disord. 2022. PMID: 35864499 Free PMC article.
-
Activation of the gut microbiota-kynurenine-liver axis contributes to the development of nonalcoholic hepatic steatosis in nondiabetic adults.Aging (Albany NY). 2021 Sep 2;13(17):21309-21324. doi: 10.18632/aging.203460. Epub 2021 Sep 2. Aging (Albany NY). 2021. PMID: 34473644 Free PMC article.
-
Genetic and Lifestyle-Related Factors Influencing Serum Hyper-Propionylcarnitine Concentrations and Their Association with Metabolic Syndrome and Cardiovascular Disease Risk.Int J Mol Sci. 2023 Oct 31;24(21):15810. doi: 10.3390/ijms242115810. Int J Mol Sci. 2023. PMID: 37958793 Free PMC article.
References
-
- Adams SH, Hoppel CL, Lok KH, Zhao L, Wong SW, Minkler PE, Hwang DH, Newman JW, Garvey WT. Plasma acylcarnitine profiles suggest incomplete long-chain fatty acid beta-oxidation and altered tricarboxylic acid cycle activity in type 2 diabetic African-American women. The Journal of Nutrition. 2009;139:1073–1081. doi: 10.3945/jn.108.103754. - DOI - PMC - PubMed
-
- Alberti KG, Zimmet PZ. Definition, diagnosis and classification of diabetes mellitus and its complications. Part 1: diagnosis and classification of diabetes mellitus provisional report of a WHO consultation. Diabetic Medicine. 1998;15:539–553. doi: 10.1002/(SICI)1096-9136(199807)15:7<539::AID-DIA668>3.0.CO;2-S. - DOI - PubMed
-
- Bailey K. Typologies and tax-onomies: an introduction to classification. Sage Publications; Thousand Oaks: 1994. Numerical taxonomy ad cluster analysis; pp. 34–65. - DOI
Further reading
-
- Batch BC, Shah SH, Newgard CB, Turer CB, Haynes C, Bain JR, Muehlbauer M, Patel MJ, Stevens RD, Appel LJ, Newby LK, Svetkey LP. Branched chain amino acids are novel biomarkers for discrimination of metabolic wellness. Metabolism: Clinical and Experimental. 2013;62:961–969. doi: 10.1016/j.metabol.2013.01.007. - DOI - PMC - PubMed
-
- Floegel A, Wientzek A, Bachlechner U, Jacobs S, Drogan D, Prehn C, Adamski J, Krumsiek J, Schulze MB, Pischon T, Boeing H. Linking diet, physical activity, cardiorespiratory fitness and obesity to serum metabolite networks: findings from a population-based study. International Journal of Obesity (2005) 2014;38:1388–1396. doi: 10.1038/ijo.2014.39. - DOI - PMC - PubMed
LinkOut - more resources
Full Text Sources
Other Literature Sources
